

Abstract
Heterogeneity in the expression levels of mammalian genes is large even in clonal populations and has phenotypic consequences. Alternative splicing is a fundamental aspect of gene expression, yet its contribution to heterogeneity is unknown. Here, we use single-molecule imaging to characterize the cell-to-cell variability in mRNA isoform ratios for two endogenous genes, CAPRIN1 and MKNK2. We show that isoform variability in non-transformed, diploid cells is remarkably close to the minimum possible given the stochastic nature of individual splicing events, while variability in HeLa cells is considerably higher. Analysis of the potential sources of isoform ratio heterogeneity indicates that a difference in the control over splicing factor activity is one origin of this increase. Our imaging approach also visualizes non-alternatively spliced mRNA and active transcription sites, and yields spatial information regarding the relationship between splicing and transcription. Together, our work demonstrates that mammalian cells minimize fluctuations in mRNA isoform ratios by tightly regulating the splicing machinery.
Keywords: alternative splicing, cell-to-cell variability, co-transcriptional splicing, gene expression
Introduction
Heterogeneity among cells in a population, even when they are genetically identical, arises due to the stochastic nature of intercellular biochemical reactions. Such variability has important roles in mammalian cells, such as affecting the outcome of stem-cell differentiation (Chang et al, 2008), the latency period of viruses (Weinberger et al, 2005, 2008), T-cell activation (Feinerman et al, 2008), and the tolerance of cancer cells to chemotherapy (Spencer et al, 2009). Thus, understanding the origins of gene expression variability has become an important goal in cell biology.
Alternative splicing is a highly regulated process in which the exons of nascent mRNAs are differentially assembled to form mature mRNAs, thereby increasing transcriptome complexity (Nilsen and Graveley, 2010). As alternative splicing occurs in >90% of human genes (Wang et al, 2008a), variability in isoform levels between individual cells is a potentially large source of gene expression heterogeneity. Characterizing this variability is particularly important since alternative splicing frequently creates isoforms with different cellular functions (Schwerk and Schulze-Osthoff, 2005; Chen and Manley, 2009; Nilsen and Graveley, 2010).
The regulation of alternative splicing has been the subject of much research and has been shown to involve multiple components. At the RNA sequence level, large strides have been made toward unraveling the ‘splicing code,’ or identifying the cis-regulatory sequences that attract splicing factor proteins which suppress or promote splicing (Barash et al, 2010). As individual splicing factors can affect numerous genes, many of these proteins have evolved to tightly autoregulate their own abundance (Lareau et al, 2007; Ni et al, 2007; Saltzman et al, 2008). The regulation of alternative splicing is further complicated by the presence of upstream, pathway-specific regulation that can affect the alternative splicing of distinct genes. Further, recent studies have shown that histone modifications (Luco et al, 2010) and even the elongation rate of RNA polymerase can impact isoform ratios (de la Mata et al, 2003). However, it is still unknown how the combined effect of these multiple regulatory modules affects cell-to-cell variability in isoform ratios.
Previous studies have demonstrated considerable mRNA abundance heterogeneity between individual cells for multiple genes (Bengtsson et al, 2005; Raj et al, 2006, 2010; Zenklusen et al, 2008; Gandhi et al, 2011). Although the vast majority of mRNAs undergo alternative splicing, the extent of cell-to-cell variability in isoform ratios resulting from alternative splicing is still unknown. To answer this question, we used single-molecule mRNA isoform imaging to assess the isoform ratio variability for two endogenous genes, CAPRIN1 and MKNK2, in a clonal, non-cancerous diploid cell line (Rpe1, retinal pigment epithelial cells) and in a clonal, cancerous cell line (HeLa, cervical epithelial cancer cells). We found that cell-to-cell variability in isoform ratios for Rpe1 cells was remarkably close to a binomial partitioning of isoforms, or the minimum possible in the absence of feedback. In contrast, isoform ratio variability in HeLa cells was substantially higher. Further statistical analysis of potential variability sources and knockdown of a key splicing factor suggested that the increased variability in HeLa cells is a function of reduced control over the regulatory splicing machinery. Finally, making use of the spatial resolution of our data, we showed that not all nascent CAPRIN1 mRNA transcripts are alternatively spliced co-transcriptionally.
Results
Identification of candidate genes for single-molecule imaging of alternative RNA splicing
The absolute abundance of endogenous mRNA transcripts in individual cells can be quantified using single-molecule fluorescent in situ hybridization (smFISH; Femino et al, 1998; Raj et al, 2008a). This approach requires the target mRNA transcript to be sufficiently long in order to hybridize multiple fluorescent probes, thus rendering individual mRNAs bright enough to be visualized as diffraction-limited spots and identified computationally (Raj et al, 2008a).
As the large majority of alternatively spliced genes contain isoforms that differ only slightly in their mRNA sequences, we conducted a genome-wide search for genes in which we can selectively image alternatively spliced mRNA isoforms (Figure 1). We first scanned the genome for genes with two isoforms in which both isoforms differ substantially in their RNA sequence (>800 bp). Second, we excluded genes with isoforms that contain different 5′ start sites and genes that have short isoforms (<1000 bp). The remaining genes were sorted by different types of alternative mRNA processing (Lutz, 2008; Wang and Burge, 2008b): alternative polyadenylation (304 genes), alternative splicing (138 genes), and alternative splicing coupled to alternative polyadenylation (63 genes). We proceeded with the latter two in order to study the effects of alternative splicing.
Figure 1.

Schematic for identification of candidate mRNAs. A series of steps were taken to identify suitable genes for smFISH imaging of alternatively spliced isoforms including searching for genes with two isoforms which have the same 5′ start site and differ substantially in sequence (>800 bp), verification of isoform presence in multiple databases and/or in the literature, and qRT–PCR verification of isoform presence.
To further narrow our list of candidate genes, we examined each gene individually for further verification of the existence of two isoforms. We first checked whether both isoforms were annotated in the RefSeq database (NCBI) and the UCSC Genome Browser, and if expression data were present in the BioGPS database (http://biogps.gnf.org). We next performed a literature search to see if both isoforms are mentioned and/or if the gene has a previously characterized cellular function. Using this approach, we selected a final set of 22 genes for experimental validation. By means of qRT–PCR, we were able to validate the presence of both isoforms for 10 of the 22 genes (Supplementary Table S1). From these 10 genes we selected CAPRIN1 and MKNK2 due to their interesting biological functions and long unique RNA sequences for smFISH probe hybridization.
CAPRIN1 and MKNK2 have different mRNA abundances, cellular functions, and types of alternative splicing. CAPRIN1 encodes a well-conserved, ubiquitously expressed, cytoplasmic, RNA-binding protein implicated in G1/S cell-cycle progression (Wang et al, 2005; Solomon et al, 2007). Its two isoforms differ in their terminal exons (Figure 2A) such that isoform 1 contains a unique RGG RNA-binding motif in its C-terminus. In contrast, the mRNA isoforms of MKNK2 (MKNK2a and MKNK2b, hereafter isoforms 2 and 1, respectively) are generated as a result of alternative 3′ splice site usage in the C-terminus (Figure 2B) and are together present at lower levels than CAPRIN1. MKNK2 encodes one of two human Mnk kinase genes and phosphorylates the cap binding transcription factor eIF4E on Ser209, an event linked to tumorigenesis (Topisirovic et al, 2004; Wendel et al, 2007). The two isoforms of MKNK2 have different cellular localizations (Scheper et al, 2003) and basal kinase activity (Buxade et al, 2008), with isoform 1 being predominantly cytoplasmic.
Figure 2.

The alternative splicing of CAPRIN1 and MKNK2 imaged at single-molecule resolution. (A) The mutually exclusive mRNA sequences of CAPRIN1 isoform 1 and isoform 2 were hybridized to tens of short oligo probes coupled to Alexa555 (green) or Cy5 (red) dyes, respectively. (B) The entire mature mRNA sequence of MKNK2 was hybridized with Cy5 (red) probes except for the unique sequence of isoform 1 (Alexa555 probes, green). Isoform 1 was detected as a colocalized spot in both channels (yellow). (C, D) Example images of CAPRIN1 (C) and MKNK2 (D) in HeLa and Rpe1 cells, respectively. Images are maximum intensity projections covering the entire z axis of the cells. Nuclei are stained with DAPI (blue). Scale bars, 10 μM. Background subtraction (ImageJ) applied to merges. (E, F) Maximum intensity projections of cells hybridized with no probes (E) or with 48 randomly scrambled, 20 bp, Cy5-coupled probes (F).
The spliced isoforms of CAPRIN1 and MKNK2 can be imaged and quantified in individual cells
We imaged the isoforms of CAPRIN1 and MKNK2 using an smFISH variant in which tens of 20 bp-long, fluorescently labeled DNA probes are hybridized to each mRNA sequence of interest (Raj et al, 2008a). For CAPRIN1, we hybridized a distinctly labeled probe set (Cy5 or Alexa555) to each alternatively spliced terminal exon (Figure 2A and C). For MKNK2, we targeted one probe set (Alexa555) to the unique sequence of isoform 2 and another (Cy5) to the entire mRNA sequence of isoform 1 (which is also shared by isoform 2) (Figure 2B and D). Isoform 2 molecules were detected as colocalized spots in both channels with isoform 1 being detected only in the Cy5 channel (Figure 2D). No bright spots were observed when no probe was used or when using 48 random, 20 bp probes (Figure 2E and F).
Accurate quantification of RNA transcripts using smFISH requires a high signal-to-noise ratio. Indeed, the signal intensities from individual mRNAs were much larger than the background, allowing precise quantification of isoform abundances (Figure 3). Further, the dual color labeling strategy provided an important control for estimating our measurement error for MKNK2, as cytoplasmic Alexa555 spots should typically have a corresponding Cy5 spot. Using this control, we found that only ∼2.5% (Rpe1, 2.8%; Hela, 2.1%) of the cytoplasmic Alexa555 spots were not colocalized with Cy5. This control can be commonly used in smFISH studies.
Figure 3.

Detection of active sites of transcription using single-molecule imaging. Transcription sites actively transcribing CAPRIN1 or MKNK2 mRNA were identified as colocalized nuclear spots whose signal was either beyond the linear range of detection (4096 AU on a 12bit camera) or at least 1.5 times brighter than the mean spot intensity in both channels. (A) Maximum intensity projections of an Rpe1 cell which containing an active CAPRIN1 transcription site. Arrows point to the spot that fulfills the criteria for detection as an active transcription site. This spot is also the highest intensity spot for each channel. Scale bars, 10 μM. (B) Intensity plots of the lines in panel (A) show that mRNA spot signals are substantially above background. (C) Intensity histograms of all identified spots (mRNAs) in each channel. Arrows point to the spot depicted by the yellow arrows in panel (A). The dashed gray line points to the mean background intensity for each channel (Alexa555, 452 AU; Cy5, 407 AU). (D) Active transcription sites were not detected following treatment with the transcription inhibitor actinomycin D.
CAPRIN1 mRNA alternative splicing in relationship to transcription sites
In addition to enabling the quantification of absolute isoform levels per cell, the visual nature of our assay also allowed us to examine the spatial relationship between alternative splicing and transcription, specifically for CAPRIN1. Although thought to be mostly co-transcriptional (Allemand et al, 2008; Pandya-Jones and Black, 2009), the actual distance between splicing of alternative exons and transcription for a given gene has not been well characterized in mammalian cells. Our imaging strategy allowed us to assess this distance selectively for CAPRIN1 by identifying non-alternatively spliced mRNAs and active transcription sites (Figure 4). The former were detected as colocalized nuclear spots (which for MKNK2 also show isoform 2), while the latter were identified as colocalized nuclear spots whose intensity in both channels was substantially higher than that of average mRNAs (Figure 3; see Materials and methods). Although this is not a complete count of all active sites, as it requires the presence of multiple nearly full-length pre-mRNAs, inhibiting transcription using actinomycin D confirmed that we do not detect false positives (Figure 3D).
Figure 4.
Non-alternatively spliced CAPRIN1 mRNA is present away from transcription sites. (A, B) Maximum intensity projections of CAPRIN1 (A) and MKNK2 (B) mRNA in HeLa cells containing an identified transcription site (red arrows). Enlargements show enrichment of colocalized nuclear spots (yellow) around the transcription sites of both genes. One spot is depicted by a white arrow in each enlargement. For CAPRIN1, these yellow spots represent mRNA that has not undergone alternative splicing. For MKNK2, in addition to non-alternatively spliced mRNA, these spots also represent isoform 2. Scale bars, 5 μM. Background subtraction (ImageJ) applied to MKNK2 enlargement. (C) Plot showing the abundance of detected transcription sites in HeLa and Rpe1 cells. Bars represent mean±s.d. (n=3). (D) Histogram of mRNA distance from transcription sites for CAPRIN1 shows enrichment of unspliced mRNA up to several microns away from transcription sites. n depicts number of cells per plot. Data represent mean±s.d. (n=3). Source data is available for this figure at www.nature.com/msb.

Spatial analysis of the spots revealed that CAPRIN1 mRNA that has not been alternatively spliced is enriched near transcription sites, up to ∼6–8 μm away, when compared with mature mRNA isoforms (Figure 4D). We also observed an enrichment of colocalized nuclear spots proximal to transcription sites for MKNK2 (Figure 4B). In addition to pre-mRNA, non-alternatively spliced transcripts may represent misprocessed mRNA since co-transcriptional splicing is thought to be more efficient (Allemand et al, 2008). Thus, the imaged transcription sites may contain mature mRNAs in addition to unspliced transcripts. As the range of nuclear mRNA diffusion coefficients in mammalian cells is large (D=0.003–0.7 μm2/s) (Shav-Tal et al, 2004; Vargas et al, 2005; Shav-Tal and Gruenbaum, 2009; Mor et al, 2010), our findings suggest that alternative splicing or transcript degradation for CAPRIN1 can occur at least 1.5 min after the end of transcription and in some cases longer.
Quantification of isoform ratio variability in Rpe1 and HeLa cells
Single-molecule counting of isoforms revealed that CAPRIN1 and MKNK2 represent different spectrums of cytoplasmic mRNA abundance and isoform ratios, quantified herein as fractional isoform abundance (FIA, or FIA1 for isoform 1) (Table I). CAPRIN1 mRNA is present on average at ∼240 and ∼130 transcripts per cell in HeLa and Rpe1 cells, respectively, with isoform 1 being ∼20-fold more abundant than isoform 2. In contrast, the two isoforms of MKNK2 are present at similar levels (∼6–20 copies per cell on average) (Figure 5A and B; Table I). MKNK2 mRNA is roughly seven-fold less abundant than CAPRIN1 mRNA for both cell types. All analyses refer to cytoplasmic isoform abundance as this is not biased by the presence of pre-mRNA, misprocessed mRNA, or introns.
Table 1. Mean cytoplasmic isoform abundances and fractional isoform 1 abundances (FIA1).
| Gene | Experiment | Cells (N) | Copy number (mean±s.d.) |
〈FIA1〉 | FIA1 standard deviation | |
|---|---|---|---|---|---|---|
| Iso1 | Iso2 | |||||
| Errors for averages are ±s.d. between the mean of the experiments. | ||||||
| CAPRIN1 | HeLa 1 | 191 | 244±117 | 11.6±7.0 | 0.9546 | 0.0186 |
| HeLa 2 | 141 | 226±84 | 11.9±7.3 | 0.9504 | 0.0227 | |
| HeLa 3 | 157 | 230±99 | 9.8±5.1 | 0.9581 | 0.0177 | |
| Average | 163±26 | 234±9.6 | 11.1±1.1 | 0.954±0.004 | 0.020±0.002 | |
| Rpe1 1 | 160 | 133±46 | 6.3±4.0 | 0.9553 | 0.0223 | |
| Rpe1 2 | 126 | 111±37 | 5.0±2.9 | 0.9563 | 0.0211 | |
| Rpe1 3 | 105 | 124±42 | 5.4±3.0 | 0.9573 | 0.0196 | |
| Average | 130±28 | 123±11.1 | 5.6±0.6 | 0.956±0.001 | 0.021±0.001 | |
| MKNK2 | HeLa 1 | 163 | 16.5±10.2 | 15.9±8.5 | 0.4992 | 0.1549 |
| HeLa 2 | 185 | 22.4±13.9 | 20.8±13.9 | 0.5152 | 0.1412 | |
| HeLa 3 | 198 | 18.6±11.4 | 18.2±9.5 | 0.5015 | 0.1538 | |
| Average | 182±18 | 19.2±3.0 | 18.3±2.4 | 0.505±0.009 | 0.150±0.008 | |
| Rpe1 1 | 306 | 7.6±5.5 | 12.0±7.8 | 0.3932 | 0.1673 | |
| Rpe1 2 | 345 | 6.2±4.4 | 9.2±7.4 | 0.4162 | 0.1803 | |
| Rpe1 3 | 145 | 5.8±4.1 | 9.9±6.8 | 0.3754 | 0.1493 | |
| Average | 265±106 | 6.5±0.9 | 10.4±1.4 | 0.395±0.020 | 0.166±0.016 | |
Figure 5.
FIA variability is close to the theoretical minimum in Rpe1 but not in HeLa cells. (A, B) Histograms of isoform variability for CAPRIN1 (A) and MKNK2 (B). Bars represent mean±s.e.m. (n=3). (C, D) FIA is not correlated with total cytoplasmic mRNA. An example scatter plot of FIA1 versus total mRNA is shown (D). Bars represent mean±s.d. (n=3). (E) Plot quantifying the increase in measured FIA variability above the theoretical minimum established by a binomial partitioning of isoforms. Bars represent mean±s.d. (n=3). Source data is available for this figure at www.nature.com/msb.

Interestingly, cell-to-cell variability in isoform ratios differed considerably between the two genes. For CAPRIN1, the standard deviation of FIA1 was ∼0.02 in both cell lines, whereas for MKNK2 it was 0.15±0.008 and 0.166±0.016 for HeLa and Rpe1 cells, respectively (Table I). The differences in FIA variability between the two genes appear to be inversely correlated with the ∼7-fold difference in abundance between CAPRIN1 and MKNK2. However, this pattern does not hold when mean isoform abundances are compared across cell lines. Isoform levels are ∼2-fold higher in HeLa cells; yet, FIA variability remains strikingly similar. This suggests the presence of different sources of isoform ratio heterogeneity.
Sources of cell-to-cell variability in FIAs
Isoform ratio variability can originate from multiple sources. As mRNAs are typically present in low numbers, the most obvious source of isoform ratio variability is the stochasticity of individual alternative splicing events. In the absence of feedback, this stochasticity presents a lower bound, or theoretical minimum, for FIA variability. Since FIA was poorly correlated with total mRNA abundance for both genes (Figure 5C and D), this minimum variability can be established as a binomial (random) partitioning of isoforms about the mean FIA (see Materials and methods).
In comparison with this theoretical minimum, we found that FIA variability in HeLa cells was much larger than in Rpe1 cells (4.2-fold for CAPRIN1 and 3.1-fold for MKNK2) (Figure 5E). Remarkably, FIA variability in Rpe1 cells was close to the minimum possible (Figure 5E), with only a ∼9% increase above the minimum for CAPRIN1 and ∼20% for MKNK2.
The extremely low level of splicing heterogeneity in Rpe1 cells was striking, but it left open the question as to why isoform variability is increased in HeLa cells. Beyond stochasticity in the alternative splicing event itself, cell-to-cell variability in isoform ratios may also arise from (1) fluctuations in mRNA synthesis rate, (2) fluctuations in regulatory splicing factors, (3) fluctuations in mean isoform lifetimes relative to each other, and (4) variability arising from cell-cycle effects (Figure 6A). We, therefore, investigated these potential origins of variability.
Figure 6.
Sources of cell-to-cell variability in fractional isoform abundance. (A) Schematic of sources of cell-to-cell variability in FIA. (B–D) Fluctuations in synthesis rate are a source of FIA variability, particularly for MKNK2, but cannot explain the increased variability in HeLa cells compared with Rpe1 cells. (B) Schematic demonstrating how synthesis rate fluctuations, in this case transcriptional bursting, together with differential isoform lifetimes can lead to FIA fluctuations and thus increase FIA variability. (C) Measurements of isoform lifetimes show differential isoform stability primarily for MKNK2. Data represent values from a fitted curve±s.e.m. (D) Measured total cytoplasmic mRNA abundance variability is greater than that predicted in the absence of synthesis rate fluctuations (see Materials and methods and Supplementary Theory). (E) Total cytoplasmic mRNA, but not FIA, is correlated with DAPI intensity. (F–H) SRSF1 knockdown causes a large increase in FIA variability beyond the theoretical minimum (binomial isoform partitioning). Efficient knockdown of SRSF1 was confirmed by western blotting (F), and led to decreased isoform 1 abundance and increased isoform 2 abundance (G). (H) FIA variability compared with binomial isoform partitioning. Bars in (D, E, G, and H) represent mean±s.d. (n=3). Source data is available for this figure at www.nature.com/msb.

In the presence of isoforms with different mRNA stabilities, transcription rate fluctuations can lead to FIA fluctuations over time (shown schematically in Figure 6B), thus increasing FIA variability. mRNA lifetime measurements showed large differences between the two isoforms of MKNK2, but less so in CAPRIN1 (Figure 6C; Supplementary Figure S1). This suggests that synthesis rate fluctuations may explain the higher increase in FIA variability for MKNK2 compared with CAPRIN1 (Figure 5E). Indeed, quantification of the abundance of active transcription sites (Figure 4C; see also Materials and methods and Figure 3) is low enough to suggest that MKNK2 is not transcribed constitutively but rather in bursts (Levsky et al, 2002; Raj et al, 2006). Further, the variability in total cytoplasmic mRNA levels was larger than would be predicted if the rate of transcription was uniform (Figure 6D; see Materials and methods and Supplementary Theory), particularly for MKNK2, consistent with the presence of synthesis rate fluctuations (Raj et al, 2006). Since FIA variability in Rpe1 cells is close to the minimum possible, these fluctuations may account for much of the remaining variability beyond the minimum in these cells. However, the increased variability seen in HeLa cells requires further explanation as both the isoform lifetimes and the total mRNA abundance variability were similar to Rpe1 cells for both genes (Figure 6C and D).
What then are the origins of increased isoform variability in HeLa cells? Cell-cycle effects cannot explain the differences between the two cell lines as isoform ratios are poorly correlated with total mRNA and DAPI signal (Figures 5C, D and 6E). Similarly, if present, fluctuations in mean isoform lifetimes would only have an effect if they were uncorrelated between isoforms. Finally, intrinsic noise in degradation cannot increase FIA variability in the absence of feedback (Supplementary Theory). Taken together, our findings suggest that it is the tight control of the regulatory splicing machinery that is compromised in HeLa cells.
To test the effect of fluctuations in splicing factor activity on isoform ratios, we measured the effect of RNAi knockdown of SRSF1, an RNA-binding protein that regulates MKNK2 splicing (Figure 6F–H; Karni et al, 2007). RNAi-mediated knockdown of SRSF1 should increase variation in the splicing machinery by disrupting the autoregulation of SRSF1 abundance (Lareau et al, 2007; Ni et al, 2007). Indeed, this treatment dramatically increased FIA variability to ∼250% above the theoretical minimum set by binomial partitioning (Figure 6H). Immunofluorescence of SRSF1 showed efficient knockdown across all siRNA transfected cells (Supplementary Figure S2), indicating that the increased FIA variability was likely caused by fluctuations in the regulatory splicing machinery. Nonetheless, although knockdown was apparent across all cells, it is possible that variability in the residual abundance of SRSF1 contributed to the observed effect as well.
Decreased isoform covariance in HeLa cells confirms fluctuations in the regulatory splicing machinery
Finally, we asked whether the presence of splicing factor fluctuations is quantitatively consistent with the measured isoform statistics. We developed a stochastic model of gene expression that includes the effect of fluctuations in the regulatory alternative splicing machinery, specifically splicing factor fluctuations, and used the model to identify empirical relationships predicted to exist in the data.
Our approach is based on a canonical model of stochastic gene expression, whereby both mRNA synthesis and degradation are assumed to be stochastic events that can be formulated in terms of a chemical master equation (Paulsson, 2005). In the canonical model, mRNA synthesis is a Poisson process with a transcription initiation rate ν(t) that is independent of mRNA levels and characterized by fluctuations with a coefficient of variation CVsyn and a correlation time τsyn. mRNA degradation is similarly modeled as a Poisson process with an average mRNA lifetime τ. Our model builds on these assumptions, but with several generalizations (see Supplementary Theory for the complete model). Foremost, we incorporate into the model the effects of a time-varying alternative splicing probability P(t), defined as the probability of generating isoform 1 from pre-mRNA in a given cell at some time t of the experiment. As with synthesis rate fluctuations, we characterize P(t) by its coefficient of variation CV(1)sp and its correlation time τsp. For simplicity, we do not include the effects of mRNA partitioning upon cell division in the model (Huh and Paulsson, 2011). Simulations of the model that include the full effects of cell division and binomial mRNA partitioning resulted in only a minor increase in FIA variability for both genes (<10% increase) (see Materials and methods).
We analyzed the complete model to obtain expressions for the isoform CVs and covariance in terms of the variation in transcription initiation rate and in splicing factor activity. Referring to the Supplementary Theory for details of the calculation, we identified a simple empirical relationship in the data, viz.
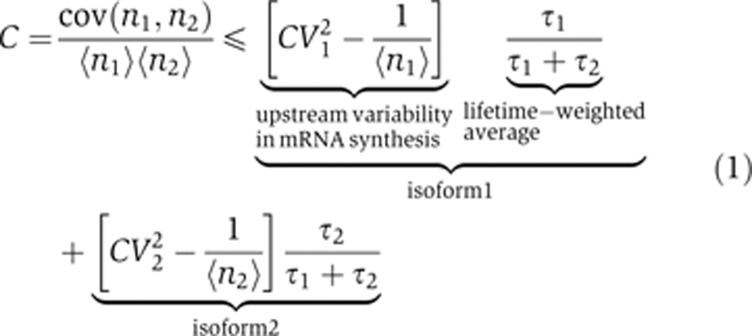 |
with equality holding only in the condition that fluctuations in the probability of generating a specific isoform are small. Note that when the isoform lifetimes are equal (τ1=τ2), Equation (1) becomes analogous to the dual reporter method used to determine the magnitude of intrinsic and extrinsic noise sources in protein abundance in living cells (Elowitz et al, 2002). Importantly, even if τ1≠τ2, Equation (1) represents a simple test for the tightness of control over splicing factor activity within the cell; when splicing factor fluctuations are present, isoform CVs increase while their covariance decreases, leading to the stated inequality in Equation (1). This prediction is parameter independent and therefore constitutes a powerful test for splicing factor fluctuations in the empirical data.
Based on the current evidence for splicing factor fluctuations in HeLa cells but not in Rpe1 cells, we predicted that the normalized covariance for CAPRIN1 and MKNK2 (left-hand side of Equation (1)) should be consistently lower than the lifetime-weighted average isoform CVs (right-hand side of Equation (1)) in HeLa cells. In contrast, the two sides of Equation (1) should be similar for Rpe1 cells. The isoform abundance data indeed confirmed these predictions. By defining Z as the ratio of CVs to the normalized covariance C (more precisely, the ratio of the two sides of Equation (1)), for CAPRIN1 one finds near equality in Rpe1 cells (Z=1.14), and a larger deviation in HeLa cells (Z=1.49). Similarly, although the ratio is high for MKNK2 in Rpe1 cells (Z=1.52), it is significantly higher in HeLa cells (Z=2.18). Finally, perturbation of alternative splicing regulation by knockdown of SRSF1 was predicted to induce significantly higher fluctuations, which was again confirmed by a dramatic drop in isoform covariance (Z>3).
Discussion
In this study, we acquired single-molecule images of the alternative splicing of two endogenous genes and found that isoform ratio variability in Rpe1 cells was close to the minimum possible resulting from the probabilistic chance of individual alternative splicing events. We also found that isoform ratio variability is increased in HeLa cells. Perturbation of splicing regulation by knockdown of a key splicing further enhanced this phenotype. Interestingly, the small differences in isoform ratio heterogeneity between CAPRIN1 and MKNK2 could be explained by a separate mechanism unrelated to the splicing machinery, namely synthesis rate fluctuations coupled to the presence of isoforms with differential mRNA stability. Finally, we used the visual nature of our assay to show that not all nascent CAPRIN1 mRNA transcripts are alternatively spliced co-transcriptionally.
Our finding that cell-to-cell variability in isoform ratios is close to the minimum possible in Rpe1 cells demonstrates the efficacy of alternative splicing regulation as measured by its end result, that is, minimizing fluctuations in isoform ratios for CAPRIN1 and MKNK2. This suggests that the splicing machinery has evolved to effectively minimize isoform ratio fluctuations. In support of this, it was observed that many individual proteins within the splicing machinery autoregulate their own abundance through an evolutionarily conserved negative feedback loop (Lareau et al, 2007; Ni et al, 2007; Saltzman et al, 2008). As other factors such as histone modifications or polymerase elongation rate also regulate isoform ratios (de la Mata et al, 2003; Luco et al, 2010), our findings suggest that these mechanisms may also be controlled in a manner that minimizes isoform ratio variability, or alternatively that their role in regulating isoform ratios may be less significant than that of splicing factors.
In the presence of feedback, the minimum possible variability in isoform ratios can theoretically be lower than a binomial partitioning. However, although CAPRIN1 and MKNK2 could in principle autoregulate their own isoform ratios, this is unlikely as autoregulation of isoform ratios has not been widely observed beyond proteins that are involved in splicing (McGlincy and Smith, 2008). For CAPRIN1, the very low levels of isoform 2 would make autoregulation difficult due to stochastic noise (Lestas et al, 2010). Thus, it is not likely that mammalian cells have evolved a specific regulatory mechanism for the alternative splicing of this gene. For MKNK2, although the two protein isoforms have different cellular behaviors, the kinase does not bind RNA and is not thought to act on RNA-binding proteins (Buxade et al, 2008). Therefore, it is unlikely that feedback has a role; rather it is the strong regulation of alternative splicing that limits variability in isoform ratios.
One important aspect to consider when discussing the impact of fluctuations in the regulatory splicing machinery on isoform ratio variability is the timescale of these fluctuations (Paulsson, 2005). For fluctuations to have an impact on isoform ratio variability, they must occur on a timescale that is comparable to, or longer than, the mRNA isoform lifetimes. Thus, our findings rule against the possibility of slow fluctuations in splicing factor activity for Rpe1 cells. While there may be rapid fluctuations in the activity of regulatory splicing factors on the course of minutes, these would be biologically irrelevant as most mammalian mRNAs are typically stable for several hours (Yang et al, 2003; Sharova et al, 2009). Similarly, synthesis rate fluctuations must also occur on timescales that are similar to, or larger than, the isoform lifetimes if they are to increase isoform ratio variability.
The observation that the alternative splicing of the terminal exon of CAPRIN1 is not necessarily co-transcriptional may have implications regarding isoform ratio variability. If the observed unspliced mRNAs are not misprocessed transcripts but rather functional pre-mRNAs, it is possible that the spatial localization of alternative splicing affects cell-to-cell variability in isoform ratios as the concentration of regulatory splicing factors may not be uniform within the nucleus. Conceptually, this source of variability would fall under the category of fluctuations in the regulatory splicing machinery.
Our results also have implications for stochastic modeling of gene expression. The rate of mRNA synthesis for an active promoter is typically modeled as a Poisson process in stochastic models of gene expression (Paulsson, 2005). For an mRNA transcript that undergoes alternative splicing, this assumption is accurate in the presence of minimal fluctuations in the regulation of its alternative splicing. However, in the case that there are fluctuations, one must consider their effect on variability in synthesis rate. Thus, our findings indicate that alternative splicing needs to be incorporated when constructing stochastic models of transcription, depending on the gene and cell type.
There are many cases in which alternative splicing of genes has functional significance (Nilsen and Graveley, 2010), and it is likely that many more examples are yet to be discovered. Interestingly, several alternative splicing events give rise to isoforms that even have opposing functions (Schwerk and Schulze-Osthoff, 2005). As such, variability in spliced isoform ratios of genes may have consequences, just as variability in gene expression levels can impact various cellular behaviors (Raj and van Oudenaarden, 2008b).
Heterogeneity in gene expression arises from diverse sources and is impacted by variability in alternative splicing. Our finding that FIA variability in Rpe1 cells is close to the predicted minimum indicates that alternative splicing is tightly regulated to strongly minimize fluctuations in splicing factor activity and isoform ratios. This control is compromised in HeLa cells. Since fluctuations in the alternative splicing machinery effectively increase variability in mRNA synthesis rates, our results demonstrate the importance of mRNA processing in gene expression heterogeneity. Finally, given that alternative splicing can create isoforms with different, and antagonistic, cellular roles, increased variability in this process may have functional consequences.
Materials and methods
Screening for candidate genes for smFISH imaging of alternative splicing
We retrieved the exact genome positions of every exon for all known mRNA isoforms within the Ensembl database (http://www.ensembl.org). Genes were sorted by the number of isoforms, and only those with two isoforms were selected (5111 genes). We wrote code in MATLAB (Mathworks) to align the two isoforms of the selected genes, quantify differences in sequence length, and sort genes according to their respective alternative mRNA processing event: splicing, polyadenylation, or both.
qRT–PCR
RNA was extracted using RNeasy spin columns (Qiagen). cDNA was synthesized using Superscript III reverse transcriptase (Invitrogen) with oligo(dT) primers. Amplification reactions were prepared with Sybr-Green PCR master mix (Applied Biosystems) and run on the BioRad iCycler iQ detection system. Primer sets were designed using Primer3 software (http://frodo.wi.mit.edu/primer3). Many primers were designed to span or to be complementary to exon junctions to distinguish between alternatively spliced isoforms. Products were tested by agarose gel electrophoresis to verify the presence of a single, correctly sized, amplification product.
Cell culture
Rpe1 and HeLa cells were purchased from American Type Culture Collection. The cells used in this study were each expanded from a single cell to minimize genetic and epigenetic heterogeneity. Cells were maintained and passaged using standard conditions and media.
HeLa cells were transfected with siRNAs targeting SRSF1 (Dharmacon) or non-targeting siRNAs (Dharmacon) using HiPerfect transfection reagent (Qiagen) and 40 nM total siRNA concentration. Cells were plated onto pre-formed siRNA complexes for 36 h, and afterwards re-plated on 6-well, No. 1.5 thickness, glass-bottom plates (MatTek), and fixed 72 h after transfection for imaging.
mRNA lifetimes were assayed by quantifying the decrease in isoform abundance at multiple time points following transcription inhibition. Transcription was blocked using actinomycin D (Sigma) at a final concentration of 5 μg/ml. We blocked transcription for 4 h since we noticed morphological changes beyond 5 h inhibition. mRNA lifetimes were derived using a linear regression fit which is suitable for both linear and exponential decay when mRNA levels are considerably longer than the experiment time, as is the case here.
Immunofluorescence
Immunofluurescent staining of SRSF1 was done using standard protocol with a monoclonal anti-SRSF1 antibody (Invitrogen #32–4600, 1:500 dilution). Fixation was performed by treating cells with paraformaldehyde for 10 min followed by cold methanol (−20°C) for 10 min.
Western blotting
Western blotting was performed using standard protocol. Briefly, proteins were extracted using RIPA buffer (1% Triton X-100, 0.5% sodium deoxycholate, 0.1% SDS, and 1 × PBS) with protease inhibitors (Roche) and quantified by a Bradford Assay (BioRad). Samples were run on a 4–12% Bis-Tris polyacrylamide gel (Invitrogen) and probed with a monoclonal anti-SRSF1 antibody (Invitrogen #32–4600, 1:500 dilution) and a monoclonal, HRP conjugated anti-GAPDH antibody (Sigma #G9295, 1:1500 dilution).
smFISH probe design and synthesis
smFISH probe sets were designed using online software (http://www.singlemoleculefish.com) with the following considerations: maximize probe number up to 96, minimize deviations from 45% GC content, and minimize %GC content differences between the two probe sets of a given gene. Probes were ordered with 3′ amine groups (Biosearch Technologies) and coupled to Alexa555 (Invitrogen #A20009) or Cy5 (GE Healthcare #PA15101) succinimidyl esters via HPLC. Probe sequences are listed in Supplementary Tables S3–S6. Probe lengths and mean GC content are as such: CAPRIN1-A555 (40.1% GC, 96 probes), CAPRIN1-Cy5 (36.4% GC, 50 probes), MKNK2-A555 (53.5% GC, 60 probes), and MKNK2-Cy5 (54.9% GC, 71 probes).
smFISH microscopy
Cells were plated on 6-well, No. 1.5 thickness, glass-bottom plates (MatTek P24G-1.5-13-F) and fixed after 24 h using 10% formaldehyde for 10 min followed by treatment with 75% ethanol at 4°C for ⩾20 h. Fixed cells were typically 10–30% confluent to enable accurate cell boundary segmentation. smFISH was performed using a previously described protocol with the following changes (Raj et al, 2008a). Hybridization and washing conditions were 32°C, 10% formamide for CAPRIN1 and 37°C, 16% formamide for MKNK2. The mounting buffer was created as previously described (Raj et al, 2008a), but also contained 50% glycerol (final concentration) and 75 μg/ml glucose oxidase (Sigma #G2133), 520 μg/ml catalase (Sigma #C3515), and 0.5 mg/ml Trolox (Sigma #238813) to prevent photobleaching (Vogelsang et al, 2008; Cordes et al, 2009). We typically acquired 100–150 stage positions per experiment. Stage positions were selected without bias. A standard inverted fluorescence microscope (Nikon TE2000) was used with a × 60 (NA=1.4) objective and a Hamumatsu Orca-ER camera. We acquired 36–40 focal planes at 0.25 μM intervals using Metamorph acquisition software (Molecular Devices). Typical exposure times per individual focal plane: CAPRIN1(Cy5) 2.8 s, CAPRIN1(Alexa555) 850 ms, MKNK2(Cy5) 3 s, and MKNK2(Alexa555) 1.6 s.
Image analysis
Quantitative image analysis was done using custom written code in MATLAB. Cells were segmented manually in MATLAB based on maximum intensity projections in the fluorescent channels. mRNA spots were detected as previously described using the algorithm supplied within that study which includes spot enhancement by a Laplacian of a Gaussian filter followed by manual thresholding (Raj et al, 2008a). Cells which were difficult to segment or in which thresholding errors could lead to an error of greater than ∼5% in spots counted were discarded. We typically analyzed ∼120–200 cells per condition (Table I; Supplementary Table S2). The maximal intensity and centroid position of each spot was assessed. Nuclei were segmented by global thresholding of the DAPI channel following deconvolution (Huygens) using a previously described algorithm (http://www.mathworks.com/products/demos/image/ipexcell/ipexcell.html). Transcription sites were identified as colocalized spots within the nucleus whose signal was either beyond the linear range of detection or at least 1.5 times brighter than the mean spot intensity in both channels. The same detection method was used for CAPRIN1 and MKNK2.
Simulations of binomial isoform partitioning
Simulations were performed separately for each experiment. For each individual cell in an experiment, we used a random number generator (MATLAB) to simulate binomial partitioning of isoforms given N total mRNAs (N=total cytoplasmic mRNA abundance of that cell) and P probability of an mRNA being isoform 1 (P=mean FIA1 for the entire experiment). We performed 100 iterations for each cell in the experiment to minimize errors in distribution statistics.
Simulations of total mRNA variability given a constant, fixed rate of transcription
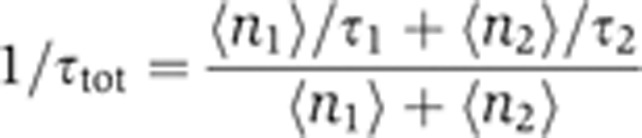
Simulations were performed assuming Poisson statistics for transcription initiation with a mean rate  , with mRNA degraded following a near-uniform lifetime τtot, and assuming cell division with a near-uniform cell cycle Tc. The weighted average mRNA lifetime, τtot, was calculated using the measured lifetimes of both isoforms (τ1 and τ2) and their average abundance in a particular experiment (〈n1〉 and 〈n2〉),
 |
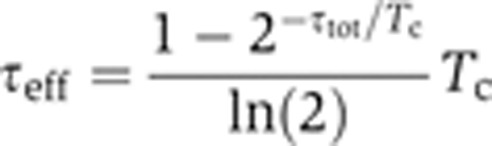
This formula is derived using the mean isoform abundances (see Supplementary Theory Equation (6)). The mean mRNA synthesis rate,  , was calculated from the total mRNA abundance using the relation
  τeff=(〈n1〉+〈n2〉), where τeff is the effective mRNA lifetime that includes the effect of binomial partitioning of the mRNA population upon cell division. With a fixed cell-cycle length (Tc) and a fixed mRNA lifetime (τtot), one may show that the effective mRNA lifetime is,
 |
Simulations were implemented using a hybrid Gillespie/queue-based algorithm (Gillespie, 1977), and consisted of 1000 cells sampled at random intervals. Figure 6D presents results using doubling times of Tc=24 and 18 h for HeLa and Rpe1 cells, as previously reported (Zocchi et al, 1998; Uetake and Sluder, 2004). Simulations using cell-cycle durations ranging from 16 to 24 h had minimal effect on the CV, at most 5%. mRNA was binomially partitioned between the two daughter cells upon cell division. To simulate natural variability in mRNA lifetimes and in cell-cycle length, the parameters τtot and Tc were allowed to vary at random with ±10% variability about their mean, although this had a negligible effect on the CV.
Simulating FIA variability with binomial partitioning of mRNA upon cell division
Simulations based on a Gillespie/queue-based algorithm were carried out to calculate FIA variability (defined as the standard deviation of the FIA), as described above. The simulations implemented the alternative splicing model defined in Supplementary Theory (Supplementary Equations (2)–(5)) with the additional effect of cell division every time period Tc. The effect of binomial partitioning on FIA variability was assessed by comparing the simulation results with those obtained assuming that mRNA abundance is precisely halved (to the nearest integer) upon cell division. Simulations were repeated with a range of parameter values consistent with the measured mean mRNA abundances and mRNA lifetimes.
Supplementary Material
Supplementary Figures S1–2, Supplementary Tables S1–5, Supplementary Theory
Acknowledgments
We thank Buz Barstow, Michael Moore, Qingqing Wang, Joseph Shih, Shay Tal, Andreas Hilfinger, Johan Paulsson, Jason Lohmueller, and Rebecca Ward for helpful discussions and critical reading of the manuscript. We thank William Senapedis, Michael Moore, and Qingqing Wang for advice regarding cell culture, siRNA transfections, and qRT–PCR. AMK is supported by an EPSRC LSI Fellowship EP/F043325/1. This work was supported by NIH grants GM057476 and GM36373 to PAS.
Author contributions: ZW and PAS conceived the study. ZW, AMK, and PAS designed the experiments. ZW performed all experiments. ZW and AMK analyzed the data and conducted simulations. AMK developed the stochastic theory (supplementary). PAS supervised the entire study. All authors discussed results and commented on the manuscript.
Footnotes
The authors declare that they have no conflict of interest.
References
- Allemand E, Batsche E, Muchardt C (2008) Splicing, transcription, and chromatin: a menage a trois. Curr Opin Genet Dev 18: 145–151 [DOI] [PubMed] [Google Scholar]
- Barash Y, Calarco JA, Gao W, Pan Q, Wang X, Shai O, Blencowe BJ, Frey BJ (2010) Deciphering the splicing code. Nature 465: 53–59 [DOI] [PubMed] [Google Scholar]
- Bengtsson M, Stahlberg A, Rorsman P, Kubista M (2005) Gene expression profiling in single cells from the pancreatic islets of Langerhans reveals lognormal distribution of mRNA levels. Genome Res 15: 1388–1392 [DOI] [PMC free article] [PubMed] [Google Scholar]
- Buxade M, Parra-Palau JL, Proud CG (2008) The Mnks: MAP kinase-interacting kinases (MAP kinase signal-integrating kinases). Front Biosci 13: 5359–5373 [DOI] [PubMed] [Google Scholar]
- Chang HH, Hemberg M, Barahona M, Ingber DE, Huang S (2008) Transcriptome-wide noise controls lineage choice in mammalian progenitor cells. Nature 453: 544–547 [DOI] [PMC free article] [PubMed] [Google Scholar]
- Chen M, Manley JL (2009) Mechanisms of alternative splicing regulation: insights from molecular and genomics approaches. Nat Rev Mol Cell Biol 10: 741–754 [DOI] [PMC free article] [PubMed] [Google Scholar]
- Cordes T, Vogelsang J, Tinnefeld P (2009) On the mechanism of Trolox as antiblinking and antibleaching reagent. J Am Chem Soc 131: 5018–5019 [DOI] [PubMed] [Google Scholar]
- de la Mata M, Alonso CR, Kadener S, Fededa JP, Blaustein M, Pelisch F, Cramer P, Bentley D, Kornblihtt AR (2003) A slow RNA polymerase II affects alternative splicing in vivo. Mol Cell 12: 525–532 [DOI] [PubMed] [Google Scholar]
- Elowitz MB, Levine AJ, Siggia ED, Swain PS (2002) Stochastic gene expression in a single cell. Science 297: 1183–1186 [DOI] [PubMed] [Google Scholar]
- Feinerman O, Veiga J, Dorfman JR, Germain RN, Altan-Bonnet G (2008) Variability and robustness in T cell activation from regulated heterogeneity in protein levels. Science 321: 1081–1084 [DOI] [PMC free article] [PubMed] [Google Scholar]
- Femino AM, Fay FS, Fogarty K, Singer RH (1998) Visualization of single RNA transcripts in situ. Science 280: 585–590 [DOI] [PubMed] [Google Scholar]
- Gandhi SJ, Zenklusen D, Lionnet T, Singer RH (2011) Transcription of functionally related constitutive genes is not coordinated. Nat Struct Mol Biol 18: 27–34 [DOI] [PMC free article] [PubMed] [Google Scholar]
- Gillespie DT (1977) Exact stochastic simulation of coupled chemical-reactions. J Phys Chem 81: 2340–2361 [Google Scholar]
- Huh D, Paulsson J (2011) Non-genetic heterogeneity from stochastic partitioning at cell division. Nat Genet 43: 95–100 [DOI] [PMC free article] [PubMed] [Google Scholar]
- Karni R, de Stanchina E, Lowe SW, Sinha R, Mu D, Krainer AR (2007) The gene encoding the splicing factor SF2/ASF is a proto-oncogene. Nat Struct Mol Biol 14: 185–193 [DOI] [PMC free article] [PubMed] [Google Scholar]
- Lareau LF, Inada M, Green RE, Wengrod JC, Brenner SE (2007) Unproductive splicing of SR genes associated with highly conserved and ultraconserved DNA elements. Nature 446: 926–929 [DOI] [PubMed] [Google Scholar]
- Lestas I, Vinnicombe G, Paulsson J (2010) Fundamental limits on the suppression of molecular fluctuations. Nature 467: 174–178 [DOI] [PMC free article] [PubMed] [Google Scholar]
- Levsky JM, Shenoy SM, Pezo RC, Singer RH (2002) Single-cell gene expression profiling. Science 297: 836–840 [DOI] [PubMed] [Google Scholar]
- Luco RF, Pan Q, Tominaga K, Blencowe BJ, Pereira-Smith OM, Misteli T (2010) Regulation of alternative splicing by histone modifications. Science 327: 996–1000 [DOI] [PMC free article] [PubMed] [Google Scholar]
- Lutz CS (2008) Alternative polyadenylation: a twist on mRNA 3′ end formation. ACS Chem Biol 3: 609–617 [DOI] [PubMed] [Google Scholar]
- McGlincy NJ, Smith CW (2008) Alternative splicing resulting in nonsense-mediated mRNA decay: what is the meaning of nonsense? Trends Biochem Sci 33: 385–393 [DOI] [PubMed] [Google Scholar]
- Mor A, Suliman S, Ben-Yishay R, Yunger S, Brody Y, Shav-Tal Y (2010) Dynamics of single mRNP nucleocytoplasmic transport and export through the nuclear pore in living cells. Nat Cell Biol 12: 543–552 [DOI] [PubMed] [Google Scholar]
- Ni JZ, Grate L, Donohue JP, Preston C, Nobida N, O'Brien G, Shiue L, Clark TA, Blume JE, Ares M Jr (2007) Ultraconserved elements are associated with homeostatic control of splicing regulators by alternative splicing and nonsense-mediated decay. Genes Dev 21: 708–718 [DOI] [PMC free article] [PubMed] [Google Scholar]
- Nilsen TW, Graveley BR (2010) Expansion of the eukaryotic proteome by alternative splicing. Nature 463: 457–463 [DOI] [PMC free article] [PubMed] [Google Scholar]
- Pandya-Jones A, Black DL (2009) Co-transcriptional splicing of constitutive and alternative exons. RNA 15: 1896–1908 [DOI] [PMC free article] [PubMed] [Google Scholar]
- Paulsson J (2005) Models of stochastic gene expression. Phys Life Rev 2: 157–175 [Google Scholar]
- Raj A, Peskin CS, Tranchina D, Vargas DY, Tyagi S (2006) Stochastic mRNA synthesis in mammalian cells. PLoS Biol 4: e309. [DOI] [PMC free article] [PubMed] [Google Scholar]
- Raj A, Rifkin SA, Andersen E, van Oudenaarden A (2010) Variability in gene expression underlies incomplete penetrance. Nature 463: 913–918 [DOI] [PMC free article] [PubMed] [Google Scholar]
- Raj A, van den Bogaard P, Rifkin SA, van Oudenaarden A, Tyagi S (2008a) Imaging individual mRNA molecules using multiple singly labeled probes. Nat Methods 5: 877–879 [DOI] [PMC free article] [PubMed] [Google Scholar]
- Raj A, van Oudenaarden A (2008b) Nature, nurture, or chance: stochastic gene expression and its consequences. Cell 135: 216–226 [DOI] [PMC free article] [PubMed] [Google Scholar]
- Saltzman AL, Kim YK, Pan Q, Fagnani MM, Maquat LE, Blencowe BJ (2008) Regulation of multiple core spliceosomal proteins by alternative splicing-coupled nonsense-mediated mRNA decay. Mol Cell Biol 28: 4320–4330 [DOI] [PMC free article] [PubMed] [Google Scholar]
- Scheper GC, Parra JL, Wilson M, Van Kollenburg B, Vertegaal AC, Han ZG, Proud CG (2003) The N and C termini of the splice variants of the human mitogen-activated protein kinase-interacting kinase Mnk2 determine activity and localization. Mol Cell Biol 23: 5692–5705 [DOI] [PMC free article] [PubMed] [Google Scholar]
- Schwerk C, Schulze-Osthoff K (2005) Regulation of apoptosis by alternative pre-mRNA splicing. Mol Cell 19: 1–13 [DOI] [PubMed] [Google Scholar]
- Sharova LV, Sharov AA, Nedorezov T, Piao Y, Shaik N, Ko MS (2009) Database for mRNA half-life of 19 977 genes obtained by DNA microarray analysis of pluripotent and differentiating mouse embryonic stem cells. DNA Res 16: 45–58 [DOI] [PMC free article] [PubMed] [Google Scholar]
- Shav-Tal Y, Darzacq X, Shenoy SM, Fusco D, Janicki SM, Spector DL, Singer RH (2004) Dynamics of single mRNPs in nuclei of living cells. Science 304: 1797–1800 [DOI] [PMC free article] [PubMed] [Google Scholar]
- Shav-Tal Y, Gruenbaum Y (2009) Single-molecule dynamics of nuclear mRNA. F1000 Biol Rep 1: pii: 29. [DOI] [PMC free article] [PubMed] [Google Scholar]
- Solomon S, Xu Y, Wang B, David MD, Schubert P, Kennedy D, Schrader JW (2007) Distinct structural features of caprin-1 mediate its interaction with G3BP-1 and its induction of phosphorylation of eukaryotic translation initiation factor 2alpha, entry to cytoplasmic stress granules, and selective interaction with a subset of mRNAs. Mol Cell Biol 27: 2324–2342 [DOI] [PMC free article] [PubMed] [Google Scholar]
- Spencer SL, Gaudet S, Albeck JG, Burke JM, Sorger PK (2009) Non-genetic origins of cell-to-cell variability in TRAIL-induced apoptosis. Nature 459: 428–432 [DOI] [PMC free article] [PubMed] [Google Scholar]
- Topisirovic I, Ruiz-Gutierrez M, Borden KL (2004) Phosphorylation of the eukaryotic translation initiation factor eIF4E contributes to its transformation and mRNA transport activities. Cancer Res 64: 8639–8642 [DOI] [PubMed] [Google Scholar]
- Uetake Y, Sluder G (2004) Cell cycle progression after cleavage failure: mammalian somatic cells do not possess a ‘tetraploidy checkpoint’. J Cell Biol 165: 609–615 [DOI] [PMC free article] [PubMed] [Google Scholar]
- Vargas DY, Raj A, Marras SA, Kramer FR, Tyagi S (2005) Mechanism of mRNA transport in the nucleus. Proc Natl Acad Sci USA 102: 17008–17013 [DOI] [PMC free article] [PubMed] [Google Scholar]
- Vogelsang J, Kasper R, Steinhauer C, Person B, Heilemann M, Sauer M, Tinnefeld P (2008) A reducing and oxidizing system minimizes photobleaching and blinking of fluorescent dyes. Angew Chem Int Ed Engl 47: 5465–5469 [DOI] [PubMed] [Google Scholar]
- Wang B, David MD, Schrader JW (2005) Absence of caprin-1 results in defects in cellular proliferation. J Immunol 175: 4274–4282 [DOI] [PubMed] [Google Scholar]
- Wang ET, Sandberg R, Luo S, Khrebtukova I, Zhang L, Mayr C, Kingsmore SF, Schroth GP, Burge CB (2008a) Alternative isoform regulation in human tissue transcriptomes. Nature 456: 470–476 [DOI] [PMC free article] [PubMed] [Google Scholar]
- Wang Z, Burge CB (2008b) Splicing regulation: from a parts list of regulatory elements to an integrated splicing code. RNA 14: 802–813 [DOI] [PMC free article] [PubMed] [Google Scholar]
- Weinberger LS, Burnett JC, Toettcher JE, Arkin AP, Schaffer DV (2005) Stochastic gene expression in a lentiviral positive-feedback loop: HIV-1 Tat fluctuations drive phenotypic diversity. Cell 122: 169–182 [DOI] [PubMed] [Google Scholar]
- Weinberger LS, Dar RD, Simpson ML (2008) Transient-mediated fate determination in a transcriptional circuit of HIV. Nat Genet 40: 466–470 [DOI] [PubMed] [Google Scholar]
- Wendel HG, Silva RL, Malina A, Mills JR, Zhu H, Ueda T, Watanabe-Fukunaga R, Fukunaga R, Teruya-Feldstein J, Pelletier J, Lowe SW (2007) Dissecting eIF4E action in tumorigenesis. Genes Dev 21: 3232–3237 [DOI] [PMC free article] [PubMed] [Google Scholar]
- Yang E, van Nimwegen E, Zavolan M, Rajewsky N, Schroeder M, Magnasco M, Darnell JE Jr (2003) Decay rates of human mRNAs: correlation with functional characteristics and sequence attributes. Genome Res 13: 1863–1872 [DOI] [PMC free article] [PubMed] [Google Scholar]
- Zenklusen D, Larson DR, Singer RH (2008) Single-RNA counting reveals alternative modes of gene expression in yeast. Nat Struct Mol Biol 15: 1263–1271 [DOI] [PMC free article] [PubMed] [Google Scholar]
- Zocchi E, Daga A, Usai C, Franco L, Guida L, Bruzzone S, Costa A, Marchetti C, De Flora A (1998) Expression of CD38 increases intracellular calcium concentration and reduces doubling time in HeLa and 3T3 cells. J Biol Chem 273: 8017–8024 [DOI] [PubMed] [Google Scholar]
Associated Data
This section collects any data citations, data availability statements, or supplementary materials included in this article.
Supplementary Materials
Supplementary Figures S1–2, Supplementary Tables S1–5, Supplementary Theory