

Abstract
The corticospinal tract (CST) is extensively used as a model system for assessing potential therapies to enhance neuronal regeneration and functional recovery following spinal cord injury (SCI). However, efficient transduction of the CST is challenging and remains to be optimised. Recombinant adeno-associated viral (AAV) vectors and integration-deficient lentiviral vectors are promising therapeutic delivery systems for gene therapy to the central nervous system (CNS). In the present study the cellular tropism and transduction efficiency of seven AAV vector serotypes (AAV1, 2, 3, 4, 5, 6, 8) and an integration-deficient lentiviral vector were assessed for their ability to transduce corticospinal neurons (CSNs) following intracortical injection. AAV1 was identified as the optimal serotype for transducing cortical and CSNs with green fluorescent protein (GFP) expression detectable in fibres projecting through the dorsal corticospinal tract (dCST) of the cervical spinal cord. In contrast, AAV3 and AAV4 demonstrated a low efficacy for transducing CNS cells and AAV8 presented a potential tropism for oligodendrocytes. Furthermore, it was shown that neither AAV nor lentiviral vectors generate a significant microglial response. The identification of AAV1 as the optimal serotype for transducing CSNs should facilitate the design of future gene therapy strategies targeting the CST for the treatment of SCI.
Keywords: AAV, Integration-deficient lentiviral vector, Corticospinal tract, Gene therapy, Transduction, Spinal cord Injury
Introduction
The CST is present in all mammals and originates from the pyramidal CSNs in layer V of the cerebral cortex that project through the brainstem to the spinal cord. The CST fibres descend through the ventral brainstem in the medullary pyramids where the main component of the CST decussates at the spinomedullary junction to form the dorsal CST (dCST) which runs in the ventral portion of the contralateral dorsal funiculus 1. There are also two minor components of the CST; the ventral CST (vCST) that does not decussate and runs through the ipsilateral ventromedial funiculus 2,3 and the dorsolateral CST (dlCST) that is comprised of decussated fibres that run in the contralateral dorsolateral white matter 3,4. The CST is primarily a descending motor pathway that controls locomotion, posture and voluntary skilled movements especially in the distal component of the limbs 5. Following injury to the rodent CST, persistent deficits in sensorimotor control are observed and restorative strategies are often assessed using behavioural tests of sensorimotor and skilled motor function 5-8. The rodent CST provides an invaluable model for studying the biological and plastic processes that occur following SCI and to assess the regenerative capacity of potential therapeutic strategies.
Recombinant AAV vectors and integration-deficient lentiviral vectors are among the most promising therapeutic delivery systems for gene therapy to the CNS. Lentiviral vectors can provide long-term gene expression via integration into the host cells' genome. However, integration into active gene loci 9 can result in insertional mutagenesis, the activation of proto-oncogenes 10,11 and the formation of cancers in both mouse models and human clinical trials 12-14. To circumvent this, integration-deficient lentiviral vectors have been generated by mutating the integrase coding sequence, resulting in the expression of the transgene at the episomal level 15. Integration-deficient lentiviral vectors can be produced at high titres and express a transgene at a level comparable to vectors incorporating the wild-type integrase 15. Robust and stable expression of GFP has been observed for at least nine months in post-mitotic cells including striatal and hippocampal neurons in vivo 15. Recently a study by Rahim et al., (2009) has shown the efficient transduction of corticospinal and rubrospinal neurons and their fibres in the spinal cord 16. Integration-deficient lentiviral vectors show great potential as a safe and efficient means of transducing neurons in vivo. AAV vectors represent one of the most attractive gene delivery systems for the CNS due to their ability to efficiently transduce neurons and to provide long-term gene expression in post-mitotic cells with only a minimal immune response 17,18. AAV vectors have one of the best characterised safety profiles and have been taken to clinical trial for a number neurodegenerative diseases 19,20. AAV serotypes express different capsid proteins that determine which receptors the AAV vector can bind to for cell entry and therefore establishes the AAV vector's tropism 21. Pseudotyping AAV2 with the capsid from different AAV serotypes can generate vectors with different tissue and cellular tropisms, which can improve the efficiency and pattern of transduction in specific regions of the CNS 22-24.
Optimising the transduction of supraspinal neurons that project to the spinal cord could facilitate the design of future gene therapy strategies to treat SCI. The overexpression of pro-regenerative genes including RARbeta2 and NCS1 have been shown to enhance the intrinsic growth state of CSNs and facilitate axonal regeneration following a SCI in vivo 25,26. In addition, knocking out genes that suppress axon growth such as KLF-4 and PTEN can also augment the regenerative response of injured optic nerve and CSN axons in vivo 27-29. Alternatively, another application of viral vectors could be the overexpression of neurotrophic factors, which have also been shown to increase axon regeneration. Two studies have previously demonstrated that AAV2-mediated expression of brain-derived neurotrophic (BDNF) factor in rubrospinal tract (RST) neurons can reverse the atrophy of injured neurons and promote the expression of regeneration associated genes following SCI 30,31. Furthermore, a recent study has demonstrated that transduction of rubrospinal or corticospinal neurons with AAV5 can result in the anterograde axonal transport of the therapeutic gene product glial cell derived neurotrophic factor (GDNF) to the injury site 32. This indicates that AAV transduction of the CST could promote sprouting and regeneration from the surrounding intact and injured neuronal tracts following a SCI. Lentiviral vectors have also been used to evaluate potential treatments to enhance regeneration of the RST or CST following SCI 25,26,31,33,34.
Until recently the transduction properties of different AAV serotypes had not been investigated for the supraspinal neurons that project to the spinal cord via the RST and CST. AAV2 and AAV5 had previously been shown to transduce neurons in the red nucleus30-32. However, it wasn't until recently that a comprehensive analysis of the cellular tropism and transduction properties of seven AAV serotypes in the adult rat red nucleus was completed 35. In addition two studies have recently reported that AAV1 and AAV5 can transduce CSNs in the sensorimotor cortex that project axons that form the CST in the spinal cord, however neither of these studies systematically compared the transduction properties of different AAV serotypes or retrogradely traced the CST to specifically label the CSNs 32,36. To date there has not been a comprehensive assessment of the transduction properties of AAV serotypes in the sensorimotor cortex, or evaluation of AAV vector tropism for the CSNs which form the CST.
Therefore in the present study we compared the transduction properties of seven AAV vectors and an integration-deficient lentiviral vector with the primary aim of identifying which viral vector most efficiently transduces CSNs following injection into the rat sensorimotor cortex.
Results
Tropism and efficiency of seven AAV serotypes and a lentiviral vector at transducing cortical neurons
Viral vectors were injected unilaterally into the sensorimotor cortex (Figure 1A). The mean number of transduced cortical neurons was determined eight weeks post-injection. Quantification revealed a statistically significant difference in the number of transduced neurons between the viral vectors (df = 7(16), F = 26.61, P < 0.001, one-way ANOVA, n = 3/group). AAV1 transduced the highest number of neurons (9650±570 transduced neurons) (Figure 2A, B and C) and Tukey post-hoc tests revealed that AAV1 transduced a significantly higher number of neurons compared to the other AAV serotypes or the lentiviral vector (* P < 0.05) (Figure 2A). AAV5 transduced the second highest number of neurons (5750±1080 transduced neurons) (Figure 2A and C), which was significantly higher than the other AAV serotypes (* P < 0.05) except for AAV1 and the lentiviral vector (P > 0.05). AAV2, 6, 8 and the lentiviral vector all demonstrated moderate levels of neuronal transduction and AAV3 and 4 showed low levels of neuronal transduction (Figure 2A, C). Tukey post-hoc tests showed that compared to each other these viral vectors did not have statistically different levels of neuronal transduction (P > 0.05).
Figure 1.
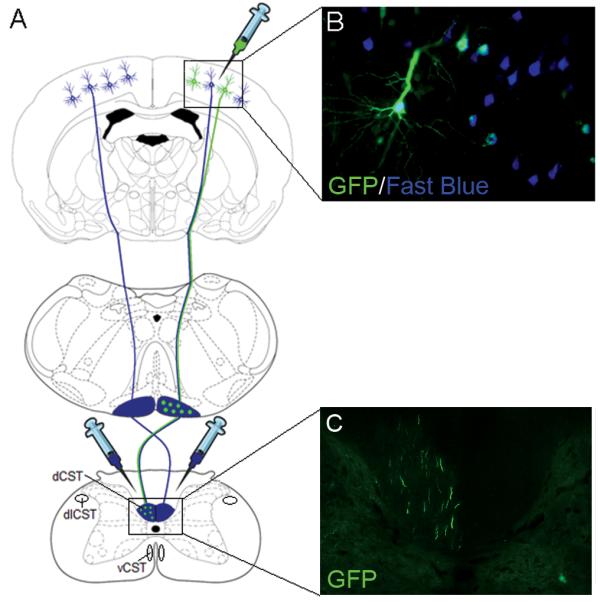
Overview of the experiment. (A) Schematic showing the rodent CST originating from the pyramidal CSNs in layer V of the sensorimotor cortex, decussating at the spinomedullary junction, forming the main dCST and the dlCST and vCST minor components. Rats received six unilateral viral vector injections into the sensorimotor cortex to transduce the CSNs and bilateral C1/C2 intraspinal injections of the retrograde tracer Fast Blue to label the CSNs. (B) Image showing transduced, retrogradely labelled CSNs. (C) Image showing GFP-positive CST fibres in the contralateral dCST of the cervical spinal cord.
Figure 2.

Transduction of cortical neurons by seven AAV serotypes and an integration-deficient lentiviral vector. (A) Quantification of transduced cortical neurons; GFP and Nissl positive neurons were counted and the mean number of transduced neurons plotted for each viral vector. Values represent mean and SEM, analysis was performed using one way ANOVA with Tukey post-hoc tests * P < 0.05, n = 3/group. Asterisk indicates a key significant comparison; the complete set of significant comparisons is described in Results. (B) GFP and Nissl stained cortical hemisphere of an AAV1 injected rat, exhibiting extensive transduction of the cortical layers. Scale bar: 600 μm. (C) Higher-magnification images of the GFP and Nissl stained injection sites from rats transduced with the AAV serotypes or lentiviral vector. All the viral vectors transduced cortical neurons. Scale bar: 100 μm.
Mean area of transduction per section
The mean area of transduction per section in the injected cortex was measured for each viral vector by outlining the area containing GFP-positive cells, in one series of stained tissue per rat. Quantification demonstrated a significant difference in the mean area of transduction per section between the viral vectors (df = 7(16), F = 15.64, P < 0.001, one-way ANOVA, n = 3/group). AAV1 transduced the largest area (1.36±0.1 mm2) and Tukey post-hoc tests demonstrated that AAV1 transduced a significantly larger area of cortex per section compared to all the other viral vectors (* P < 0.05) (Figure 3A). AAV5 transduced the second largest area of cortex per section (0.76±0.1 mm2), which was significantly larger than the area per section transduced by AAV2, 3 and 4 (* P < 0.05) (Figure 3A). There was no statistically significant difference in the mean area of transduction per section between any of the other viral vectors (P > 0.05).
Figure 3.

The mean area of transduction per section and the mean GFP intensity per neuron for each viral vector. (A) Quantification of the mean area of transduction per section was determined for each viral vector. AAV1 transduced a significantly larger area of cortex per section than the other viral vectors. Values represent mean and SEM, analysis was performed using one way ANOVA with Tukey post-hoc tests * P < 0.05, n = 3/group. Asterisk indicates a key significant comparison; the complete set of significant comparisons is described in Results. (B) The mean GFP intensity per neuron was measured by outlining the soma of 20 randomly selected neurons per section for each rat. The mean GFP intensity per neuron was not significantly different between the viral vectors. Values represent mean and SEM, analysis was performed using one way ANOVA, P > 0.05, n = 3/group.
Mean GFP intensity per transduced neuron
The mean GFP intensity per transduced neuron was calculated by measuring the GFP intensity in the cell soma of twenty randomly selected, transduced cells per section, in one series of stained tissue per rat. Quantification revealed there was no significant difference in the mean GFP intensity per transduced cell between the different viral vectors (df = 7(16), F = 2.44, P > 0.05, one-way ANOVA, n = 3/group) (Figure 3B).
Efficiency of seven AAV serotypes and a lentiviral vector at transducing CST projecting corticospinal neurons
Following completion of the intracortical vector injections, rats received bilateral injections of the retrograde tracer Fast Blue between the C1/C2 spinal segments to label the CSNs (Figure 1A and B). Eight weeks post-injection the mean number of transduced CSNs was determined (Figure 4A and C). Quantification revealed a significant difference in the number of transduced CSNs between the viral vectors (df = 7(16), F = 33.47, P < 0.001, one-way ANOVA, n = 3/group). AAV1 transduced the highest number of CSNs (180±10 transduced CSNs) and Tukey post-hoc tests revealed that AAV1 transduced a significantly higher number of CSNs than the other viral vectors (*** P < 0.001) (Figure 4A). AAV2 and AAV8 transduced moderate numbers of CSNs (AAV2, 60±10; AAV8 60±15 transduced CSNs), Tukey post-hoc analysis showed that AAV2 and 8 transduced significantly higher numbers of CSNs than AAV3, 4 and the lentiviral vector (* P < 0.05) (Figure 4A). There was no statistical significance between any of the other viral vectors. The percentage transduction efficiency for CSNs was then calculated for each viral vector relative to the total number of retrogradely labelled CSNs in the injected cortex. Quantification revealed a significant difference between the viral vectors (df = 7(16), F = 8.92, P < 0.001, one-way ANOVA, n = 3/group). AAV1 had the highest transduction efficiency for CSNs (4.8±0.6 % of the total retrogradely labelled CSNs) and transduced a significantly higher percentage of CSNs compared to all the other viral vectors (* P < 0.05) (Figure 4B). There was no statistically significant difference between any of the other viral vectors (P > 0.05). The percentage transduction for CSNs within the region of transduction was also calculated for each viral vector. Again a significant difference between the groups was observed (df = 7(16), F = 19.58, P < 0.001, one-way ANOVA, n = 3/group). AAV1 transduced a significantly higher percentage of CSNs (28±2 % of the CSNs within the area of transduction) compared to the other viral vectors (*** P < 0.001) (Figure 4B). AAV2 and AAV8 transduced a significantly higher percentage of CSNs compared to AAV3, 4 and the lentiviral vector (* P < 0.05) and AAV5 transduced a significantly higher percentage compared to AAV3 (* P < 0.05) (Figure 4B).
Figure 4.

Transduction of CSNs by seven AAV serotypes and an integration-deficient lentiviral vector. (A) Quantification of transduced CSNs. The CSNs were labelled using the retrograde tracer Fast Blue. The number of GFP and Fast Blue positive neurons was counted and the mean number of transduced CSNs plotted for each viral vector. AAV1 transduced a significantly higher number CSNs than the other viral vectors. Values represent mean and SEM, analysis was performed using one way ANOVA with Tukey post-hoc tests *** P < 0.001, * P < 0.05, n = 3/group. (B) Quantification of the percentage of CSNs transduced relative to both the total number of retrogradely traced CSNs and the number of retrogradely traced CSNs in the area of transduction. Compared to the other viral vectors AAV1 transduced a significantly higher percentage of CSNs relative to the total number of CSNs or the number of CSNs within the area of transduction. Values represent mean and SEM, analysis was performed using one way ANOVA with Tukey post-hoc tests *** P < 0.001, * P < 0.05, n = 3/group. Asterisks show a subset of key significant comparisons; the complete set of significant comparisons is described in Results. (C) High magnification images of AAV1 transduced CST projecting pyramidal CSNs from different animals. Scale bars: 50 μm.
GFP-positive fibres were observed in the dorsal CST of the cervical spinal cord
The mean number of GFP-positive fibres was calculated by counting the number of GFP positive fibres in the dCST contralateral to the injected hemisphere for each viral vector (Figures 1C and 5A, B and C). Quantification revealed that there was a significant difference in the number of GFP-positive fibres between the different viral vectors (df = 7(16), F = 6.74, P < 0.001, one-way ANOVA, n = 3/group). Rats injected with AAV1 had the highest number of GFP-positive fibres in the dCST (38±6 GFP-positive fibres) (Figure 5A and C). Tukey post-hoc tests showed that AAV1 injected rats had significantly higher numbers of GFP expressing fibres in the dCST compared to the other viral vectors (* P < 0.05) (Figure 5A). A transverse section at the spinomedullary junction of an AAV1 injected rat shows a GFP-positive fibre decussating from the ipsilateral ventral medullary pyramid across the midline and dorsally to the contralateral dCST (Figure 6A, B). Transduced fibres can also be observed running through the dCST when the cervical cord was cut in a horizontal plane (Figure 6C and D). However, no GFP-positive fibres were observed in the dCST of the thoracic or lumbar spinal cord (Figure 6E, F). Rats injected with AAV serotypes 2, 5, 6 and 8 had moderate numbers of GFP-positive fibres in the dCST, while rats that were injected with lentiviral vector had low numbers (Figure 5A, C) and rats transduced with AAV serotypes 3 and 4 did not exhibit any GFP-positive CST fibres in the spinal cord (Figure 5A, C). There was no statistically significant difference in the number of GFP-positive fibres between any of the other viral vectors (P > 0.05). GFP-positive axonal collaterals from the dCST could also be observed projecting into the grey matter (see Figure 5C AAV5 and AAV6 and Figure 6D for examples). When the viral vectors were compared a significant, positive correlation (P < 0.001, R2 = 0.88) was observed between the number of transduced CSNs and the number of GFP positive CST fibres (Figure 5B).
Figure 5.

GFP-positive fibres in the dCST of the cervical spinal cord. (A) Quantification of transduced fibres in the dCST at spinal level C1. GFP-positive fibres were counted and the mean number plotted for each viral vector. Values represent mean and SEM, analysis was performed using one way ANOVA with Tukey post-hoc tests * P < 0.05, n = 3/group. (B) When the viral vectors were compared using the Pearson correlation coefficient a significant, positive correlation (R2 = 0.88) was observed between the number of transduced CSNs and the number of GFP-positive CST fibres. (C) Images of GFP-positive fibres in the contralateral dCST at C1 from rats transduced with the AAV serotypes or lentiviral vector. GFP-positive axon collaterals can be seen entering the grey matter in the images of AAV5 and 6. Scale bar: 150 μm.
Figure 6.

GFP-positive fibres in the dCST of the cervical spinal cord. (A) The spinomedullary junction of an AAV1 injected rat showing a GFP-positive fibre decussating from the ipsilateral ventral medullary pyramid across the midline and dorsally to the contralateral dCST. Scale bar: 500 μm. Inset shows a higher-magnification image of the decussating GFP-positive fibre. Scale bar: 100 μm. (B) Numerous GFP-positive fibres are observed in the contralateral dCST at spinal level C1 of an AAV1 injected rat. Scale bar: 500 μm. Inset shows a higher-magnification image of the GFP-positive fibres in the dCST. Scale bar: 150 μm. (C) Cervical spinal cord from an AAV1 injected rat, sectioned in the horizontal axis at the level of the dCST, reveals GFP-positive fibres running the length of the section in the contralateral dCST. WM: White matter; GM: Gray matter. Scale bar: 500 μm. (D) Higher-magnification image of box in (C) shows GFP-positive fibres running through the dCST and collaterals entering the grey matter. Scale bar: 100 μm. (E) No GFP-positive fibres were observed in the dCST of the thoracic spinal cord. Scale bar: 150 μm. (F) No GFP-positive fibres were seen in the dCST of the lumbar spinal cord. Scale bar: 150 μm.
Tropism and efficiency of seven AAV serotypes and a lentiviral vector at transducing astrocytes
The number of transduced astrocytes was quantified by counting the number of GFP expressing, GFAP immunopositive cells in the cerebral cortex of the viral injected hemisphere (Figure 7D arrow). AAV serotypes 1, 2, 5, 6, 8 and the lentiviral vector demonstrated low levels of astrocyte transduction, while AAV3 and 4 did not transduce any astrocytes (Figure 7A). Statistical analysis showed that there was a significant difference in the number of transduced astrocytes between the viral vectors (df = 7(16), F = 4.0, P < 0.01, one-way ANOVA, n = 3/group). Tukey post-hoc tests revealed that AAV1 and the lentivirus transduced significantly higher numbers of astrocytes compared to AAV3 or AAV4 (* P < 0.05) (Figure 7A), however there was no significant difference between any of the other viral serotypes (P > 0.05) (Figure 7A). Enhanced GFAP staining, representing astrogliosis was observed along the needle track (Figure 7B and C arrows).
Figure 7.

Viral vectors did not exhibit a strong astrocytic tropism. (A) Quantification of transduced astrocytes in the injected cortical hemisphere. GFP and GFAP positive cells were counted and the mean number of transduced astrocytes plotted for each viral vector. Values represent mean and SEM, analysis was performed using one way ANOVA with Tukey post-hoc tests * P < 0.05, n = 3/group. (B) A GFP and GFAP stained cortical hemisphere from an AAV1 transduced rat. Enhanced GFAP staining can be observed along the needle track (arrow). Scale bar: 500 μm. (C) Higher-magnification image of box in (B) showing the viral injection site and the enhanced GFAP staining around the needle track (arrow). Scale bar: 150 μm. (D) Higher-magnification image of box in (C) showing a transduced, GFAP positive astrocyte (arrow). Scale bar: 25 μm.
Microglial response following cortical transduction with AAV and lentiviral vectors
The microglial response was determined by calculating the number of Iba1 immunoreactive cells in an area of transduction relative to the same location in the uninjected contralateral hemisphere. Iba1 is a protein specifically expressed by microglia and is upregulated following the activation of these cells 37. There was no observable difference in the Iba1 staining between the injected or uninjected hemispheres (Figure 8A, B and C). Quantification revealed that there was no statistically significant difference in the relative number of microglia between any of the viral vectors (df = 7(16), F = 1.07, P > 0.05, one-way ANOVA, n = 3/group) (Figure 8E). However, enhanced Iba1 staining indicating microglial activation was observed along the needle track (Figure 8A arrow, D).
Figure 8.

The viral vectors did not generate a microglial response. (A) An Iba1 stained cortex from an AAV1 transduced rat. No observable difference in Iba1 immunoreactivity was seen between the two hemispheres. The 800 μm × 900 μm boxes used to quantification the number of microglia are shown. Scale bar: 500 μm. (B) Higher-magnification image of the 800 μm × 900 μm box from the uninjected hemisphere in (A). Scale bar: 200 μm. (C) Higher-magnification image of the 800 μm × 900 μm box from the injected hemisphere in (A). (D) Higher-magnification image of the needle track in (A, arrow) showing enhanced Iba1 staining along the needle track as indicated by the arrow. (E) Quantification of the relative number of microglia within the area of transduction. The number of Iba1 positive cells in an 800 μm × 900 μm box placed over each hemisphere was counted, the relative number of microglia, expressed as a percentage of the contralateral hemisphere was then calculated and plotted for each viral vector. Values represent mean and SEM, analysis was performed using one way ANOVA P > 0.05, n = 3/group.
Cellular tropism of AAV8
AAV8 transduced a number of unidentified cells in the white matter of the corpus callosum (Figure 9A). These cells were not neurons, astrocytes or microglia as they were negative for any of the staining previously performed. Their location in the white matter tract, size and morphology was consistent with an oligodendrocyte phenotype. Subsequently, tissue sections transduced with AAV8 were stained for oligodendrocytes using an APC antibody, which stains the oligodendrocyte cell body. We observed dual reactive cells (arrows Figure 9B) indicating that some of the GFP-positive cells are oligodendrocytes. However, the relatively high background staining of the APC antibody unfortunately precluded reliable quantification of the number of transduced oligodendrocytes.
Figure 9.

AAV8 exhibits a potential oligodendrocyte tropism. (A) Cortical hemisphere of an AAV8 transduced rat stained with APC to detect oligodendrocytes. Transduced oligodendrocytes were observed in the white matter tract, although high background staining made quantification unfeasible. Scale bar: 500 μm. (B) Higher-magnification image of box in (A). The left box shows APC positive oligodendrocytes, the middle box shows transduced GFP-positive cells and the right box is a merged image, yellow cells represent transduced APC positive oligodendrocytes (arrows). Scale bar: 50 μm.
Discussion
AAV serotypes possess different cellular tropisms in the CNS 22. Characterising the tropism of different AAV serotypes is a key step to targeting gene therapy and the analysis of gene function in specific cell populations and regions of the CNS. In the present study the cellular tropism and transduction efficiency of seven AAV serotypes and an integration-deficient lentiviral vector was investigated, following injection into the rat sensorimotor cortex.
AAV1 and AAV5 transduced the largest number of neurons, which could be due to a greater tropism for cortical neurons and/or a wider diffusion of these AAV serotypes. We measured the mean area of transduction per section and found that AAV1 and AAV5 transduced the largest and second largest area of cortex respectively. We also measured the mean GFP intensity per cell and found no significant difference between any of the viral vectors. Together, these results suggest that AAV1 and AAV5 are able to diffuse further than the other viral vectors. However, this is based on the assumption that the area of tissue containing GFP-positive cells is an indication of vector diffusion, whereas it might be argued that this is confounded by the tropism of the vector. Overall, the area of transduction per section appeared visually similar to a previous study that had injected an AAV5 into the adult rat cortex 32. The number of transduced cells might be enhanced further by increasing the viral titre, the volume of vector injected, or the use of a pressure-assisted injection procedure such as convection-enhanced delivery 38. Our findings are consistent with previous reports that have demonstrated that AAV1 and 5 have a higher transduction efficiency over a larger volume in the rodent brain when compared to AAV2 39-41. In the present study AAV8 transduced significantly fewer neurons than AAV1 and 5, however at high titres AAV8 has been previously shown to transduce large brain volumes equal to AAV5 in the mouse striatum 42 and high numbers of neurons in the red nucleus 35. The possible reasons for this disparity could be that AAV8 has a reduced tropism for cortical neurons or due to differences in viral titre. AAV3 and 4 transduced the lowest numbers of cortical neurons, which is consistent with their transduction properties in the red nucleus 35. The integration-deficient lentiviral vector transduced a moderate number of cortical neurons. However, the level of GFP expression looked less than reported by a recent study by Rahim et al., (2009), unfortunately this study did not quantify the number of transduced neurons in the adult sensorimotor cortex making a direct comparison difficult 16.
Following the viral vector injections into the sensorimotor cortex, rats received intraspinal injections of the retrograde tracer Fast Blue into the cervical spinal cord to label the CSNs that project to the CST. AAV1 was the most effective vector at transducing CSNs; AAV1 transduced 4.8 % of all the retrogradely labelled CSNs in the injected cortex and 28 % of the CSNs within the area of transduction. This result is consistent with a recent study, which used AAV1 to effectively transduce layer V neurons, although this study did not specifically label the CSNs 36. In the present study only low to moderate transduction was observed with AAV5, even though large numbers of cortical neurons were transduced. Conversely a previous study reported a high level of CSN transduction using AAV5 32. However, unlike the present study, the level of transduction was not quantified and the CSNs were not specifically labelled making a comprehensive comparison difficult. Here the lentiviral vector transduced a low number of CSNs, however a recent study that also used integration-deficient, VSV-G pseudotyped lentiviral vectors to transduce CSNs combined with specifically labelling the CSNs with the retrograde tracer FluoroGold reported a higher level of CSNs transduction (approximately 20 % of the retrogradely labelled CSNs in the region of transduction) 16. In addition, a recent study by Yip et al., (2010) that used integration-proficient lentiviral vectors has also reported extensive transduction of the CSNs with high numbers of GFP-positive fibres in the dCST 26. Potential reasons for the differences between these studies and our own include the promoter used; both studies used the spleen focus-forming virus (SFFV) promoter to drive GFP expression whereas in the present study a CMV promoter was used, viral titre, injection location, post-injection incubation time, the vector's ability to integrate or the retrograde tracer.
We then investigated whether the CSN axons that project through the dCST of the spinal cord were GFP-positive. AAV1 transduced rats had the highest number of GFP-positive fibres in the dCST compared to the other AAV serotypes or the lentiviral vector. GFP-positive fibres were observed running through the dCST of the cervical spinal cord, but not in the dCST of the thoracic or lumbar spinal cord. This was expected as the viral injections were targeted to the forelimb area of the sensorimotor cortex, resulting in the GFP-positive fibres leaving the spinal cord as collaterals before reaching the thoracic or lumber spinal cord. In the present study rats transduced with AAV2, 5, 6 and 8 showed only moderate numbers of GFP-positive fibres in the dCST of the cervical spinal cord. However, Foust et al., (2008) reported extensive GFP expression in the cervical dCST following injection of AAV5 into the sensorimotor cortex. The disparity between these results could be due to differences in viral titre, injection location or the promoter used to drive GFP expression. Furthermore Foust et al., (2008) did not quantify the number of GFP-positive fibres in the dCST making a direct comparison difficult. The integration-deficient lentiviral vector demonstrated low numbers of GFP-positive fibres in the dCST. This is in disparity with the study by Rahim et al., (2009), which showed numerous GFP-positive fibres in the dCST 16. Although Rahim et al., (2009) did not quantify the number of GFP-positive fibres, this visual discrepancy could be due to differences in the promoter, viral titre, injection location, or post injection incubation time. In the present study rats transduced with AAV3 and 4 did not show any GFP-positive fibres in the dCST, which is probably the result of low numbers of transduced CSNs in the sensorimotor cortex. As one might expect, a significant positive correlation was observed between the number of transduced CSNs and the number of GFP-positive CST fibres. A similar correlation was observed between transduced neurons in the red nucleus and transduced fibres of the rubrospinal tract using the same AAV serotypes 35.
We also assessed the extent of glial transduction. Although it has been shown that AAV serotypes 1, 2, 5, 6 and 8 have a neuronal tropism, recent studies have discovered two AAV serotypes with a glial cell tropism 43,44. Lentiviral vectors have also been shown to transduce both neurons and glia 31,35. Compared to the number of transduced neurons the number of transduced glial cells was low, suggesting that the viral vectors assessed in our study do not possess a marked glial cell tropism. The lentiviral vector transduced the highest number of astrocytes, which is consistent with previous studies using VSV-G pseudotyped lentiviral vectors as VSV-G has been demonstrated to facilitate entry into practically all cell types tested 31,35,45,46. However, the number of transduced astrocytes was very small compared to the number of cortical neurons, which is consistent with a recent study that identified a strong neuronal tropism for VSV-G pseudotyped lentiviral vectors 16. AAV1 also transduced a higher number of astrocytes compared to the other AAV vectors; however this was also a very small number in comparison to the number of neurons that AAV1 transduced. AAV3 and 4 failed to transduce any astrocytes and continued to demonstrate a low transduction efficacy for all CNS cell types.
Even though AAV and lentiviral vectors have been reported to induce a minimal immune response 16,47-49, we investigated whether any of the viral vectors generated a microglial response. Analysis of the results determined that beyond the needle track, there was no significant difference in the relative number of microglia between any of the viral vectors.
AAV8 consistently transduced a number of cells in the corpus callosum. Following staining for oligodendrocytes a number of dual reactive cells were observed, although the high level of background staining meant it was not feasible to quantify the number of transduced cells. The high background staining may be due to unspecific staining by the antibody or potentially due to issues with the perfusion and fixation process. Nevertheless, this result demonstrates that AAV8 has a potential oligodendrocyte tropism, which is consistent with a recent study, which revealed the capacity of AAV8 to transduce oligodendrocytes when using a myelin basic protein (MBP) promoter 43.
Differences in tropism and transduction efficiency between viral serotypes are a result of differences in viral capsid proteins and their receptor binding properties. The VSV-G pseudotyped lentiviral vector has been demonstrated to have an extremely broad tropism although the identity of the cell receptor recognised by the VSV-G glycoprotein still remains controversial 50. Alpha2,3 and alpha2,6 sialic acids present on N-linked glycoproteins have been demonstrated to facilitate transduction and are the primary receptors for AAV1, 5 and 6 51-53. Alpha2,3 sialic acids have been shown to be expressed by embryonic rat cortical neurons 54, which may in part explain why AAV1 and 5 were the best at transducing cortical neurons. However, the fact that the transduction properties of these vectors still differed significantly may be explained because in addition to receptor binding, the intracellular trafficking and processing of the vector following cell entry may also affect tropism and transduction efficiency 55,56.
In conclusion, the findings presented here should facilitate the design of future gene therapy studies targeting the CST. This is important as the CST is extensively used as a model system for assessing potential therapies following SCI. Engineering targeted viral vectors with cell specific promoters should further improve specificity, potentially allowing the generation of viral vectors capable of cell type specific gene therapy and providing an alternative to transgenic animals when studying gene function.
Materials and methods
Viral vector production and titring
AAV vectors encoding GFP under the control of the cytomegalovirus (CMV) promoter, combined with a woodchuck posttranscriptional regulatory element (WPRE) to enhance transgene expression, were generated using the pTRCGW AAV vector backbone. The AAV vector transgene cassette was flanked by non-coding ITRs, which were the only wild-type viral sequences present. The AAV vectors were pseudotyped with AAV capsid serotype 1, 2, 3, 4, 5, 6 or 8. Following production, the AAV vectors were titred using quantitative PCR to determine the number of genomic copies (GCs) and an infection assay on 293T cells was conducted to verify infectivity. Prior to stereotactic injection all the AAV vector serotypes were titre matched to 6.6×10¹¹ GC/ml using PBS (Invitrogen, UK) containing 5% sucrose (Sigma, UK). See the following references for details on AAV vector composition and production 35,57-59.
The integration-deficient lentiviral vectors pseudotyped with the VSV-G envelope glycoprotein were produced as previously described 15,60. Briefly lentiviral vectors were generated by transient transfection of HEK293T cells with the pMD2.VSV-G, pRSV.REV and pMDLg/pRREintD64V packaging plasmids and the shLENTImax transfer plasmid, which contains two expression cassettes. The first encoding GFP under the control of a CMV promoter and a WPRE and the second containing a H1 promoter and an empty multiple cloning site. The harvested HEK293T cell medium was centrifuged at 690 × g for 10 minutes at room temperature and then filtered through a 0.22 μm filter (Nalgene, Rochester, NY, USA) to remove cell debris. The filtered medium was then harvested and transferred to high speed polyallomer centrifuge tubes (Beckman, Brea, CA, USA) and centrifuged at 50 000 × g in a SW32Ti rotor (Beckman, USA) for 2 hours at 4°C. The vector was then resuspended in DMEM, centrifuged at 1400 × g for 10 minutes and incubated with 5 u/ml DNaseI (Promega, Madison, WI, USA) and 10 mM MgCl2 (Sigma, Gillingham, Dorset, UK) for 30 minutes. The vector was then aliquoted and stored at −80°C. The lentiviral titre, determined by serial dilution and transduction of HeLa cells followed by flow cytometry as previously described 15, was 1×10⁸ transducing units/ml.
Intracortical injections
All procedures were carried out in accordance with the UK Animals (Scientific Procedures) Act 1986 and approved by the local veterinarian and ethical committee. Surgery was done using a random block design and 3 rats per viral vector. The viral vector injections were carried out by an experimenter blinded to the vector being administered. Adult Sprague Dawley rats (Harlan, UK) weighing between 180-200 g were anesthetised with an intraperitoneal injection of 0.5 mg/kg Domitor (medetomidine hydrochloride) and 100 mg/kg Vetalar (ketamine hydrochloride). Once anesthetised, 0.05 mg/kg atropine sulphate was administered subcutaneously, the head was shaved, sterilised and then placed into a stereotaxic frame (David Kopf Instruments, Tujunga, CA, USA). The incisor bar was lowered 2 mm below the horizontal plane so that the heights of Lambda and Bregma were equal and the surface of the skull was flat 61. Following a midline incision, the skin and periosteum were retracted to expose Bregma. Six holes were drilled through the skull above the left sensorimotor cortex using coordinates reported in a microstimulation mapping study relative to Bregma, midline and the brain surface 62,63 defined as anterior–posterior (AP), medial–lateral (ML), dorsal–ventral (DV):
1st: 3.5 mm ML, − 0.5 mm AP, DV − 2 mm
2nd: 3.5 mm ML, + 0.5 mm AP, DV − 2 mm
3rd: 3.5 mm ML, + 2 mm AP, DV − 2 mm
4th: 2.5 mm ML, + 1.5 mm AP, DV − 2 mm
5th: 2.5 mm ML, + 0.5 mm AP, DV − 2 mm
6th: 1.5 mm ML, + 1 mm AP, DV − 2 mm
A glass micropipette was placed onto a 1 μl Hamilton syringe (Hamilton, Reno, NV, USA) and loaded with 1 μl of viral vector. Taking measurements from the skull surface the tip of the micropipette was lowered 1 mm into the hole and then lowered a further 2 mm into the sensorimotor cortex and 0.5 μl of viral vector injected without the use of a perfusion pump. Successful vector expulsion was confirmed by monitoring the volume left in the micropipette. Occasionally, for successful viral expulsion the micropipette tip would be required to be raised fractionally. Once a successful expulsion was visually confirmed the micropipette was left in place for 1 minute to allow the viral vector to diffuse from the injection site. The micropipette was then removed, positioned over the second hole and the second 0.5 μl of viral vector injected. Using the same micropipette tip, the process was then repeated until the 6 injections were complete.
Intraspinal injections
To label CSNs intraspinal injections of a retrograde tracer was administered immediately following completion of the intracranial viral injections. The cervical spinal cord was exposed by laminectomy and 0.25 μl of the fluorescent retrograde tracer Fast Blue (Sigma, UK) diluted to 2% in PBS (Invitrogen, Paisley, Renfrewshire, UK) was injected into the spinal cord, bi-laterally between spinal levels C1 and C2. The micropipette was left in place for 1 minute following each injection to allow for diffusion. Following surgery, rats were placed into an incubator at 37°C and 1 mg/kg Antisedan (atipamezole hydrochloride) was administered intramuscularly. Once awake, 0.01 mg/kg buprenorphine was administered subcutaneously for post-operative analgesia.
Histology
8 weeks post-injection, animals were terminally anaesthetised by intraperitoneal injection of 400 mg/kg Lethabarb (sodium pentobarbital) and transcardially perfused with PBS (pH 7.4) followed by 4% paraformaldehyde in PBS. The brain and spinal cord were dissected, post-fixed in 4% paraformaldehyde for 2 hours at 4°C and cryoprotected in 30% sucrose for 5 days at 4°C. Brain and spinal cord tissue was then blocked in gelatin and placed in 4% paraformaldehyde in PBS overnight to harden. To allow tissue from each brain to be stained for several different cell types, the brains were cut rostro-caudally into 50 μm coronal serial sections using a freezing microtome (Leitz, Wetzlar, Germany) and collected into ten series in a 24-well plate containing PBS and 0.1% sodium azide (Sigma, UK). The spinal cords were cut rostro-caudally into 40 μm transverse or horizontal serial sections and stored in the same manner.
Immunohistochemistry
Brain sections were washed 3 times for 5 minutes in PBS and double stained with a monoclonal mouse antibody against GFP (1:500, UC Davis/NIH NeuroMab Facility, USA) and one of the following cell specific antibodies: A red fluorescent Nissl stain (1:200, Neurotrace, Invitrogen, UK) to label neurons, a polyclonal rabbit antibody against glial fibrillary acidic protein (GFAP) (1:500, Dako, Ely, Cambridgeshire, UK) to label astrocytes, a polyclonal rabbit antibody against ionized calcium binding adaptor molecule 1 (Iba1) (1:1000, Wako, Neuss, Germany) to label microglia or a monoclonal rabbit anti-adenomatous polyposis coli (APC) (1:250 Ab-7, EMD chemicals, Gibbstown, NJ, USA) to label oligodendrocytes. Sections were incubated with the primary antibodies diluted in PBS with 10% normal goat serum (NGS) (Invitrogen, UK) and 0.3% Triton X-100 (Sigma, UK) for 24 hours on a shaker at room temperature. The primary antibodies were removed and the sections washed 3 times for 5 minutes in PBS and incubated with goat anti-mouse Alexa Fluor 488 and goat anti-rabbit Alexa Fluor 546 secondary antibodies (1:1000, Invitrogen, UK) for 2 hours on a shaker at room temperature. The sections were then washed 3 times for 5 minutes in PBS, mounted and coverslipped. Spinal cord sections were stained using the same procedure except they were stained using only the monoclonal mouse antibody against GFP (1:500, UC Davis/NIH NeuroMab Facility, USA) followed by the goat anti-mouse Alexa Fluor 488 secondary antibodies (1:1000, Invitrogen, UK).
Imaging and quantification
Analysis was carried out by an experimenter blinded to the viral vector being analysed. Mosaic images were captured using a Zeiss Axio Imager.Z1 fluorescent microscope (Carl Zeiss, Welwyn Garden City, Hertfordshire, UK) using a ×10 or ×20 objective. The images were converted to a Zeiss Viewer Image (.ZVI) file format and analysed using AxioVision v4.8 image analysis software (Carl Zeiss, UK). Each brain was cut into ten series, thus the number of cells counted from one series only represents approximately a tenth of the whole brain. Therefore each number was then multiplied by ten to adjust for the number of series that were cut and to give an estimate for the number in the whole brain.
The number of transduced cortical neurons or astrocytes was determined by manually counting the number of Nissl and GFP or GFAP and GFP-positive cells in the injected cortex of each section, in one series of stained tissue, for each rat. The mean number of transduced cortical neurons or astrocytes for each viral vector was calculated by averaging the total number of transduced cortical neurons or astrocytes counted from the three rats that were injected with the same viral vector.
The mean area of transduction per section for each viral vector was measured using Axiovision v4.8 by manually outlining the area that contained GFP-positive cells in the injected cortex of each section in one series of stained tissue for each rat.
The mean GFP intensity per transduced neuron was measured for each viral vector using Axiovision v4.8. The soma of 20 randomly selected, transduced neurons was manually outlined in the injected cortex of each section in one series of stained tissue for each rat. To minimise variability between images the capture setting were fixed throughout the study.
The number of transduced CSNs was determined by manually counting the number of GFP and Fast Blue positive neurons in the injected cortex of each section in one series of stained tissue for each rat. The mean number of transduced CSNs for each viral vector was calculated by averaging the total number of transduced CSNs counted from the three rats that were injected with the same viral vector. The percentage of CSNs transduced relative to the total number of retrogradely traced CSNs in the injected cortex was calculated by dividing the total number of GFP and Fast Blue positive cells by the total number of Fast Blue positive cells in the injected cortex, multiplied by one hundred. The percentage of CSNs transduced relative to the number of retrogradely traced CSNs in area of transduction was calculated by dividing the total number of GFP and Fast Blue positive cells by the number of Fast Blue positive cells in the region of transduction, multiplied by one hundred.
The number of transduced CST fibres at the C1 spinal cord level was determine by manually counting the number of GFP positive fibres in the dCST of each rat. The mean number of transduced CST fibres for each viral vector was determined by averaging the section containing the highest number of transduced neurons from the three animals that were injected with the same viral vector.
The relative number of microglia within the area of transduction was determined by manually counting the number of Iba1 positive cells in an 800 μm × 900 μm box placed over the area of transduction and in an 800 μm × 900 μm box placed over the same location in the uninjected cortex of each section, in one series of stained tissue, for each rat. We then calculated as a percentage, the number of microglia in the area of transduction relative to the contralateral cortex. The mean for each series of stained tissue was then calculated followed by the mean for the three rats that were injected with the same viral vector. We observed enhanced Iba1 immunoreactivity along the needle track, which was consequently avoided for quantification. We also observed some variability in the Iba1 staining between animals. However, using the uninjected cortex as an internal control and calculating the relative number of microglia between the two hemispheres should control for this variability.
Statistical analysis
Statistical analysis was carried out using SPSS 17.0 (SPSS Inc, Chicago, IL, USA). A threshold level of significance (α) of 0.05 was selected. Graphs and values represent means ± standard errors of the mean, n = 3/group. The Kolmogorov-Smirnov and Levene's tests were used to test for normality and the equality of variances. A one-way ANOVA was used to test for differences among the groups followed by Tukey post-hoc testing to analyse the effects between groups. The Pearson product-moment correlation coefficient was used to measure the correlation between the number of transduced CSNs and number of GFP-positive CST fibres.
Acknowledgements
This study was supported by a Research Councils UK Academic Fellowship (L.M.), the British Pharmacological Society's Integrative Pharmacology Fund (L.M), Friends of Guy's Hospital Research Grants (L.M. and R.J.Y.-M.), a Biotechnology and Biological Sciences Research Council's Doctoral Training Grant (T.H.), financial support from the 7th EU Framework Programme (PERSIST project, grant agreement n°222878, to R.J.Y-M.) and a grant from Genoma España (R.J.Y.-M.). We would also like to acknowledge Bas Blits and Erich Ehlert for their help with the production of the AAV vectors.
Footnotes
Conflict of interest
The authors declare no conflict of interest.
References
- 1.Tracey DJ. Ascending and Descending Pathways in the Spinal Cord. The Rat Nervous System. (Second Edition) 1995:67–77. [Google Scholar]
- 2.Brosamle C, Schwab ME. Cells of origin, course, and termination patterns of the ventral, uncrossed component of the mature rat corticospinal tract. The Journal of comparative neurology. 1997;386:293–303. doi: 10.1002/(sici)1096-9861(19970922)386:2<293::aid-cne9>3.0.co;2-x. [DOI] [PubMed] [Google Scholar]
- 3.Bareyre FM, Kerschensteiner M, Misgeld T, Sanes JR. Transgenic labeling of the corticospinal tract for monitoring axonal responses to spinal cord injury. Nature medicine. 2005;11:1355–1360. doi: 10.1038/nm1331. [DOI] [PubMed] [Google Scholar]
- 4.Steward O, Zheng B, Ho C, Anderson K, Tessier-Lavigne M. The dorsolateral corticospinal tract in mice: an alternative route for corticospinal input to caudal segments following dorsal column lesions. The Journal of comparative neurology. 2004;472:463–477. doi: 10.1002/cne.20090. [DOI] [PubMed] [Google Scholar]
- 5.Lemon RN. Descending pathways in motor control. Annual review of neuroscience. 2008;31:195–218. doi: 10.1146/annurev.neuro.31.060407.125547. [DOI] [PubMed] [Google Scholar]
- 6.Whishaw IQ, Metz GA. Absence of impairments or recovery mediated by the uncrossed pyramidal tract in the rat versus enduring deficits produced by the crossed pyramidal tract. Behavioural brain research. 2002;134:323–336. doi: 10.1016/s0166-4328(02)00051-7. [DOI] [PubMed] [Google Scholar]
- 7.Whishaw IQ, Gorny B, Sarna J. Paw and limb use in skilled and spontaneous reaching after pyramidal tract, red nucleus and combined lesions in the rat: behavioral and anatomical dissociations. Behavioural brain research. 1998;93:167–183. doi: 10.1016/s0166-4328(97)00152-6. [DOI] [PubMed] [Google Scholar]
- 8.Starkey ML, Barritt AW, Yip PK, Davies M, Hamers FP, McMahon SB, et al. Assessing behavioural function following a pyramidotomy lesion of the corticospinal tract in adult mice. Exp Neurol. 2005;195:524–539. doi: 10.1016/j.expneurol.2005.06.017. [DOI] [PubMed] [Google Scholar]
- 9.Schroder AR, Shinn P, Chen H, Berry C, Ecker JR, Bushman F. HIV-1 integration in the human genome favors active genes and local hotspots. Cell. 2002;110:521–529. doi: 10.1016/s0092-8674(02)00864-4. [DOI] [PubMed] [Google Scholar]
- 10.Baum C, Fehse B. Mutagenesis by retroviral transgene insertion: risk assessment and potential alternatives. Current opinion in molecular therapeutics. 2003;5:458–462. [PubMed] [Google Scholar]
- 11.Baum C, Kustikova O, Modlich U, Li Z, Fehse B. Mutagenesis and oncogenesis by chromosomal insertion of gene transfer vectors. Human gene therapy. 2006;17:253–263. doi: 10.1089/hum.2006.17.253. [DOI] [PubMed] [Google Scholar]
- 12.Li Z, Dullmann J, Schiedlmeier B, Schmidt M, von Kalle C, Meyer J, et al. Murine leukemia induced by retroviral gene marking. Science. 2002;296:497. doi: 10.1126/science.1068893. New York, NY. [DOI] [PubMed] [Google Scholar]
- 13.Hacein-Bey-Abina S, Von Kalle C, Schmidt M, McCormack MP, Wulffraat N, Leboulch P, et al. LMO2-associated clonal T cell proliferation in two patients after gene therapy for SCID-X1. Science. 2003;302:415–419. doi: 10.1126/science.1088547. New York, NY. [DOI] [PubMed] [Google Scholar]
- 14.Themis M, Waddington SN, Schmidt M, von Kalle C, Wang Y, Al-Allaf F, et al. Oncogenesis Following Delivery of a Nonprimate Lentiviral Gene Therapy Vector to Fetal and Neonatal Mice. Mol Ther. 2005;12:763–771. doi: 10.1016/j.ymthe.2005.07.358. [DOI] [PubMed] [Google Scholar]
- 15.Yanez-Munoz RJ, Balaggan KS, MacNeil A, Howe SJ, Schmidt M, Smith AJ, et al. Effective gene therapy with nonintegrating lentiviral vectors. Nature medicine. 2006;12:348–353. doi: 10.1038/nm1365. [DOI] [PubMed] [Google Scholar]
- 16.Rahim AA, Wong AMS, Howe SJ, Buckley SMK, Acosta-Saltos AD, Elston KE, et al. Efficient gene delivery to the adult and fetal CNS using pseudotyped non-integrating lentiviral vectors. Gene Ther. 2009;16:509–520. doi: 10.1038/gt.2008.186. [DOI] [PubMed] [Google Scholar]
- 17.McCown TJ. Adeno-associated virus (AAV) vectors in the CNS. Current gene therapy. 2005;5:333–338. doi: 10.2174/1566523054064995. [DOI] [PubMed] [Google Scholar]
- 18.Papale A, Cerovic M, Brambilla R. Viral vector approaches to modify gene expression in the brain. Journal of neuroscience methods. 2009;185:1–14. doi: 10.1016/j.jneumeth.2009.08.013. [DOI] [PubMed] [Google Scholar]
- 19.Kaplitt MG, Feigin A, Tang C, Fitzsimons HL, Mattis P, Lawlor PA, et al. Safety and tolerability of gene therapy with an adeno-associated virus (AAV) borne GAD gene for Parkinson's disease: an open label, phase I trial. Lancet. 2007;369:2097–2105. doi: 10.1016/S0140-6736(07)60982-9. [DOI] [PubMed] [Google Scholar]
- 20.Lim ST, Airavaara M, Harvey BK. Viral vectors for neurotrophic factor delivery: a gene therapy approach for neurodegenerative diseases of the CNS. Pharmacol Res. 2009;61:14–26. doi: 10.1016/j.phrs.2009.10.002. [DOI] [PMC free article] [PubMed] [Google Scholar]
- 21.Vandenberghe LH, Wilson JM, Gao G. Tailoring the AAV vector capsid for gene therapy. Gene Ther. 2009;16:311–319. doi: 10.1038/gt.2008.170. [DOI] [PubMed] [Google Scholar]
- 22.Burger C, Nash K, Mandel RJ. Recombinant adeno-associated viral vectors in the nervous system. Human gene therapy. 2005;16:781–791. doi: 10.1089/hum.2005.16.781. [DOI] [PubMed] [Google Scholar]
- 23.Cearley CN, Wolfe JH. Transduction characteristics of adeno-associated virus vectors expressing cap serotypes 7, 8, 9, and Rh10 in the mouse brain. Mol Ther. 2006;13:528–537. doi: 10.1016/j.ymthe.2005.11.015. [DOI] [PubMed] [Google Scholar]
- 24.Rabinowitz JE, Rolling F, Li C, Conrath H, Xiao W, Xiao X, et al. Cross-packaging of a single adeno-associated virus (AAV) type 2 vector genome into multiple AAV serotypes enables transduction with broad specificity. Journal of virology. 2002;76:791–801. doi: 10.1128/JVI.76.2.791-801.2002. [DOI] [PMC free article] [PubMed] [Google Scholar]
- 25.Yip PK, Wong LF, Pattinson D, Battaglia A, Grist J, Bradbury EJ, et al. Lentiviral vector expressing retinoic acid receptor {beta}2 promotes recovery of function after corticospinal tract injury in the adult rat spinal cord. Human molecular genetics. 2006;15:3107–3118. doi: 10.1093/hmg/ddl251. [DOI] [PubMed] [Google Scholar]
- 26.Yip PK, Wong LF, Sears TA, Yanez-Munoz RJ, McMahon SB. Cortical overexpression of neuronal calcium sensor-1 induces functional plasticity in spinal cord following unilateral pyramidal tract injury in rat. PLoS biology. 2010;8:e1000399. doi: 10.1371/journal.pbio.1000399. [DOI] [PMC free article] [PubMed] [Google Scholar]
- 27.Moore DL, Blackmore MG, Hu Y, Kaestner KH, Bixby JL, Lemmon VP, et al. KLF family members regulate intrinsic axon regeneration ability. Science. 2009;326:298–301. doi: 10.1126/science.1175737. New York, NY. [DOI] [PMC free article] [PubMed] [Google Scholar]
- 28.Liu K, Lu Y, Lee JK, Samara R, Willenberg R, Sears-Kraxberger I, et al. PTEN deletion enhances the regenerative ability of adult corticospinal neurons. Nat Neurosci. 2010;13:1075–1081. doi: 10.1038/nn.2603. [DOI] [PMC free article] [PubMed] [Google Scholar]
- 29.Park KK, Liu K, Hu Y, Smith PD, Wang C, Cai B, et al. Promoting axon regeneration in the adult CNS by modulation of the PTEN/mTOR pathway. Science. 2008;322:963–966. doi: 10.1126/science.1161566. New York, NY. [DOI] [PMC free article] [PubMed] [Google Scholar]
- 30.Ruitenberg MJ, Blits B, Dijkhuizen PA, te Beek ET, Bakker A, van Heerikhuize JJ, et al. Adeno-associated viral vector-mediated gene transfer of brain-derived neurotrophic factor reverses atrophy of rubrospinal neurons following both acute and chronic spinal cord injury. Neurobiology of disease. 2004;15:394–406. doi: 10.1016/j.nbd.2003.11.018. [DOI] [PubMed] [Google Scholar]
- 31.Kwon BK, Liu J, Lam C, Plunet W, Oschipok LW, Hauswirth W, et al. Brain-derived neurotrophic factor gene transfer with adeno-associated viral and lentiviral vectors prevents rubrospinal neuronal atrophy and stimulates regeneration-associated gene expression after acute cervical spinal cord injury. Spine. 2007;32:1164–1173. doi: 10.1097/BRS.0b013e318053ec35. [DOI] [PubMed] [Google Scholar]
- 32.Foust KD, Flotte TR, Reier PJ, Mandel RJ. Recombinant adeno-associated virus-mediated global anterograde delivery of glial cell line-derived neurotrophic factor to the spinal cord: comparison of rubrospinal and corticospinal tracts in the rat. Human gene therapy. 2008;19:71–82. doi: 10.1089/hum.2007.104. [DOI] [PubMed] [Google Scholar]
- 33.Hollis ER, 2nd, Jamshidi P, Low K, Blesch A, Tuszynski MH. Induction of corticospinal regeneration by lentiviral trkB-induced Erk activation. Proceedings of the National Academy of Sciences of the United States of America. 2009;106:7215–7220. doi: 10.1073/pnas.0810624106. [DOI] [PMC free article] [PubMed] [Google Scholar]
- 34.Low K, Blesch A, Herrmann J, Tuszynski MH. A dual promoter lentiviral vector for the in vivo evaluation of gene therapeutic approaches to axon regeneration after spinal cord injury. Gene Ther. 2010;17:577–591. doi: 10.1038/gt.2010.14. [DOI] [PubMed] [Google Scholar]
- 35.Blits B, Derks S, Twisk J, Ehlert E, Prins J, Verhaagen J. Adeno-associated viral vector (AAV)-mediated gene transfer in the red nucleus of the adult rat brain: comparative analysis of the transduction properties of seven AAV serotypes and lentiviral vectors. Journal of neuroscience methods. 2010;185:257–263. doi: 10.1016/j.jneumeth.2009.10.009. [DOI] [PubMed] [Google Scholar]
- 36.Nathanson JL, Yanagawa Y, Obata K, Callaway EM. Preferential labeling of inhibitory and excitatory cortical neurons by endogenous tropism of adeno-associated virus and lentivirus vectors. Neuroscience. 2009;161:441–450. doi: 10.1016/j.neuroscience.2009.03.032. [DOI] [PMC free article] [PubMed] [Google Scholar]
- 37.Ito D, Imai Y, Ohsawa K, Nakajima K, Fukuuchi Y, Kohsaka S. Microglia-specific localisation of a novel calcium binding protein, Iba1. Brain Res Mol Brain Res. 1998;57:1–9. doi: 10.1016/s0169-328x(98)00040-0. [DOI] [PubMed] [Google Scholar]
- 38.Cunningham J, Oiwa Y, Nagy D, Podsakoff G, Colosi P, Bankiewicz KS. Distribution of AAV-TK following intracranial convection-enhanced delivery into rats. Cell transplantation. 2000;9:585–594. doi: 10.1177/096368970000900504. [DOI] [PubMed] [Google Scholar]
- 39.Burger C, Gorbatyuk OS, Velardo MJ, Peden CS, Williams P, Zolotukhin S, et al. Recombinant AAV viral vectors pseudotyped with viral capsids from serotypes 1, 2, and 5 display differential efficiency and cell tropism after delivery to different regions of the central nervous system. Mol Ther. 2004;10:302–317. doi: 10.1016/j.ymthe.2004.05.024. [DOI] [PubMed] [Google Scholar]
- 40.Davidson BL, Stein CS, Heth JA, Martins I, Kotin RM, Derksen TA, et al. Recombinant adeno-associated virus type 2, 4, and 5 vectors: transduction of variant cell types and regions in the mammalian central nervous system. Proceedings of the National Academy of Sciences of the United States of America. 2000;97:3428–3432. doi: 10.1073/pnas.050581197. [DOI] [PMC free article] [PubMed] [Google Scholar]
- 41.Wang C, Wang CM, Clark KR, Sferra TJ. Recombinant AAV serotype 1 transduction efficiency and tropism in the murine brain. Gene Ther. 2003;10:1528–1534. doi: 10.1038/sj.gt.3302011. [DOI] [PubMed] [Google Scholar]
- 42.Taymans JM, Vandenberghe LH, Haute CV, Thiry I, Deroose CM, Mortelmans L, et al. Comparative analysis of adeno-associated viral vector serotypes 1, 2, 5, 7, and 8 in mouse brain. Human gene therapy. 2007;18:195–206. doi: 10.1089/hum.2006.178. [DOI] [PubMed] [Google Scholar]
- 43.Lawlor PA, Bland RJ, Mouravlev A, Young D, During MJ. Efficient gene delivery and selective transduction of glial cells in the mammalian brain by AAV serotypes isolated from nonhuman primates. Mol Ther. 2009;17:1692–1702. doi: 10.1038/mt.2009.170. [DOI] [PMC free article] [PubMed] [Google Scholar]
- 44.Cearley CN, Vandenberghe LH, Parente MK, Carnish ER, Wilson JM, Wolfe JH. Expanded repertoire of AAV vector serotypes mediate unique patterns of transduction in mouse brain. Mol Ther. 2008;16:1710–1718. doi: 10.1038/mt.2008.166. [DOI] [PMC free article] [PubMed] [Google Scholar]
- 45.Burns JC, Friedmann T, Driever W, Burrascano M, Yee JK. Vesicular stomatitis virus G glycoprotein pseudotyped retroviral vectors: concentration to very high titer and efficient gene transfer into mammalian and nonmammalian cells. Proceedings of the National Academy of Sciences of the United States of America. 1993;90:8033–8037. doi: 10.1073/pnas.90.17.8033. [DOI] [PMC free article] [PubMed] [Google Scholar]
- 46.Naldini L, Blomer U, Gallay P, Ory D, Mulligan R, Gage FH, et al. In vivo gene delivery and stable transduction of nondividing cells by a lentiviral vector. Science. 1996;272:263–267. doi: 10.1126/science.272.5259.263. New York, NY. [DOI] [PubMed] [Google Scholar]
- 47.Kordower JH, Emborg ME, Bloch J, Ma SY, Chu Y, Leventhal L, et al. Neurodegeneration prevented by lentiviral vector delivery of GDNF in primate models of Parkinson's disease. Science. 2000;290:767–773. doi: 10.1126/science.290.5492.767. New York, NY. [DOI] [PubMed] [Google Scholar]
- 48.Kay MA, Glorioso JC, Naldini L. Viral vectors for gene therapy: the art of turning infectious agents into vehicles of therapeutics. Nature medicine. 2001;7:33–40. doi: 10.1038/83324. [DOI] [PubMed] [Google Scholar]
- 49.Lowenstein PR, Mandel RJ, Xiong WD, Kroeger K, Castro MG. Immune responses to adenovirus and adeno-associated vectors used for gene therapy of brain diseases: the role of immunological synapses in understanding the cell biology of neuroimmune interactions. Current gene therapy. 2007;7:347–360. doi: 10.2174/156652307782151498. [DOI] [PMC free article] [PubMed] [Google Scholar]
- 50.Coil DA, Miller AD. Phosphatidylserine is not the cell surface receptor for vesicular stomatitis virus. Journal of virology. 2004;78:10920–10926. doi: 10.1128/JVI.78.20.10920-10926.2004. [DOI] [PMC free article] [PubMed] [Google Scholar]
- 51.Kaludov N, Brown KE, Walters RW, Zabner J, Chiorini JA. Adeno-associated virus serotype 4 (AAV4) and AAV5 both require sialic acid binding for hemagglutination and efficient transduction but differ in sialic acid linkage specificity. Journal of virology. 2001;75:6884–6893. doi: 10.1128/JVI.75.15.6884-6893.2001. [DOI] [PMC free article] [PubMed] [Google Scholar]
- 52.Walters RW, Yi SM, Keshavjee S, Brown KE, Welsh MJ, Chiorini JA, et al. Binding of adeno-associated virus type 5 to 2,3-linked sialic acid is required for gene transfer. The Journal of biological chemistry. 2001;276:20610–20616. doi: 10.1074/jbc.M101559200. [DOI] [PubMed] [Google Scholar]
- 53.Wu Z, Miller E, Agbandje-McKenna M, Samulski RJ. Alpha2,3 and alpha2,6 N-linked sialic acids facilitate efficient binding and transduction by adeno-associated virus types 1 and 6. Journal of virology. 2006;80:9093–9103. doi: 10.1128/JVI.00895-06. [DOI] [PMC free article] [PubMed] [Google Scholar]
- 54.Kim SM, Lee JS, Lee YH, Kim WJ, Do SI, Choo YK, et al. Increased alpha2,3-sialylation and hyperglycosylation of N-glycans in embryonic rat cortical neurons during camptothecin-induced apoptosis. Molecules and cells. 2007;24:416–423. [PubMed] [Google Scholar]
- 55.Sanlioglu S, Monick MM, Luleci G, Hunninghake GW, Engelhardt JF. Rate limiting steps of AAV transduction and implications for human gene therapy. Current gene therapy. 2001;1:137–147. doi: 10.2174/1566523013348788. [DOI] [PubMed] [Google Scholar]
- 56.Thomas CE, Storm TA, Huang Z, Kay MA. Rapid uncoating of vector genomes is the key to efficient liver transduction with pseudotyped adeno-associated virus vectors. Journal of virology. 2004;78:3110–3122. doi: 10.1128/JVI.78.6.3110-3122.2004. [DOI] [PMC free article] [PubMed] [Google Scholar]
- 57.Hellstrom M, Ruitenberg MJ, Pollett MA, Ehlert EME, Twisk J, Verhaagen J, et al. Cellular tropism and transduction properties of seven adeno-associated viral vector serotypes in adult retina after intravitreal injection. Gene Ther. 2008;16:521–532. doi: 10.1038/gt.2008.178. [DOI] [PubMed] [Google Scholar]
- 58.Blits B, Carlstedt TP, Ruitenberg MJ, de Winter F, Hermens WT, Dijkhuizen PA, et al. Rescue and sprouting of motoneurons following ventral root avulsion and reimplantation combined with intraspinal adeno-associated viral vector-mediated expression of glial cell line-derived neurotrophic factor or brain-derived neurotrophic factor. Exp Neurol. 2004;189:303–316. doi: 10.1016/j.expneurol.2004.05.014. [DOI] [PubMed] [Google Scholar]
- 59.Hermens WT, ter Brake O, Dijkhuizen PA, Sonnemans MA, Grimm D, Kleinschmidt JA, et al. Purification of recombinant adeno-associated virus by iodixanol gradient ultracentrifugation allows rapid and reproducible preparation of vector stocks for gene transfer in the nervous system. Human gene therapy. 1999;10:1885–1891. doi: 10.1089/10430349950017563. [DOI] [PubMed] [Google Scholar]
- 60.Demaison C, Parsley K, Brouns G, Scherr M, Battmer K, Kinnon C, et al. High-level transduction and gene expression in hematopoietic repopulating cells using a human immunodeficiency [correction of imunodeficiency] virus type 1-based lentiviral vector containing an internal spleen focus forming virus promoter. Human gene therapy. 2002;13:803–813. doi: 10.1089/10430340252898984. [DOI] [PubMed] [Google Scholar]
- 61.Paxinos G, Watson C, Pennisi M, Topple A. Bregma, lambda and the interaural midpoint in stereotaxic surgery with rats of different sex, strain and weight. Journal of neuroscience methods. 1985;13:139–143. doi: 10.1016/0165-0270(85)90026-3. [DOI] [PubMed] [Google Scholar]
- 62.Paxinos G, Watson C. The Rat Brain in Stereotaxic Coordinates. Atlas. 1982 doi: 10.1016/0165-0270(80)90021-7. [DOI] [PubMed] [Google Scholar]
- 63.Neafsey EJ, Bold EL, Haas G, Hurley-Gius KM, Quirk G, Sievert CF, et al. The organization of the rat motor cortex: a microstimulation mapping study. Brain Res. 1986;396:77–96. doi: 10.1016/s0006-8993(86)80191-3. [DOI] [PubMed] [Google Scholar]