

Abstract
Ex vivo expanded erythroblasts (EBs) may serve as advanced transfusion products provided that lodgment occurs in the macrophage-niche of the marrow permitting maturation. EBs expanded from adult and cord blood expressed the receptors (CXCR4, VLA-4, and P-selectin ligand 1) necessary for interaction with macrophages. However, 4-days following transfusion to intact NOD/SCID/IL2Rγnull mice, CD235apos EBs were observed inside CD235aneg splenic cells suggesting that they underwent phagocytosis. When splenectomized and intact NOD/SCID/IL2Rγnull mice were transfused using retrovirally labeled human EBs, human cells were visualized by bioluminescence imaging only in splenectomized animals. Four days after injection, human CD235apos cells were detected in marrow and liver of splenectomized mice but only in spleen of controls. Human CD235apos erythrocytes in blood remained low in all cases. These studies establish splenectomized NOD/SCID/IL2Rγnull mice as a suitable model for tracking and quantification of human EBs in vivo.
1. Introduction
Culture conditions capable of generating ex vivo human erythroblasts (EBs) in numbers sufficient for transfusion have been established by several investigators (reviewed in [1]) increasing the likelihood that these cells could serve as alternative transfusion products [2]. The preclinical evaluation of these products includes testing the in vivo potency of ex vivo generated cells in animal models [3]. The development of animal models to assess the potency of human EBs generated ex vivo requires a better understanding of the interactions between human EBs and the murine microenvironment and identification of animal manipulations which may favor lodgment of these cells in the marrow.
In vivo, EBs mature in specialized areas of the marrow in close proximity to macrophages which favors both hemoglobinization, by facilitating iron uptake, and enucleation [4, 5]. Following enucleation, reticulocytes lose their association with the macrophage and egress into the blood stream. EBs interact with the macrophages through the surface adhesion receptors CXCR4 (CD184), P-selectin ligand1 (PSGL1, CD162), and VLA-4 (CD49d, α4 integrin) which recognize CXCL12 (also known as SDF1), P-selectin and VCAM1, respectively, on the surface of the macrophage [4]. Under steady-state conditions, few EBs egress from the marrow and these are usually cleared by macrophages in the spleen [6]. Smears of cultured human EBs often contain macrophages surrounded by clusters of EBs indicating that cultured EBs are capable of interacting with human macrophages derived from blood. However, the adhesion receptor profile of ex vivo generated EBs and the efficiency of the interaction of these cells with murine macrophages are presently unknown.
Neildez-Nguyen et al. have reported that human carboxyfluorescein diacetate succinimidyl ester- (CFSE-) labeled EBs expanded ex vivo from CD34pos cells isolated from cord blood differentiate into red blood cells when transfused to NOD/SCID mice [7]. The transfusion protocol included coadministration of exogenous human erythropoietin (EPO) and intraperitoneal administration of packed human red cells to block the reticuloendothelial system (leading to transient functional splenectomy). Initially, human CFSEpos cells were detected in bone marrow, liver, spleen and lung of the transfused animals and, beginning at day 4, also in peripheral blood. However, these experiments have been viewed with skepticism because human CD34pos cells engrafted in immunodeficient mice typically generate robust levels of lymphoid and myeloid cells but barely detectable numbers of erythroid cells [8]. These data have been interpreted as evidence that the murine microenvironment is not permissive for maturation of EBs. Although the molecular structures of human and murine EPO are very similar, it has been suggested that murine EPO may fail to support optimal maturation of human EBs because it does not induce dimerization after binding to the human receptor [9]. This hypothesis was indirectly supported by Nicolini et al who reported that treatment with human EPO after transplantation greatly increases the generation of human erythroid cells when human CD34pos cells are injected into immunodeficient mice [10]. However, the relative contribution of administration of human EPO and packed human red cells to the success of the animal model for human transfusion developed by Neildez-Nguyen et al. [7] has not been clarified as yet.
The aim of our study was to test whether ex vivo generated EBs express the adhesion receptor profile necessary to complete their maturation in vivo and whether inhibition of the interaction between ex vivo generated EBs and splenic macrophages will permit establishment of an in vivo model for functional evaluation of ex vivo expanded human EBs.
2. Materials and Methods
2.1. Human Subjects
Low volume cord blood units (CB) were obtained from the New York Blood Center (New York, NY, USA). Peripheral blood (PB) was collected from normal adult donors at the transfusion center of “La Sapienza” University (Rome, Italy). Both specimens were collected according to guidelines established by institutional ethical committees and provided as deidentified samples.
2.2. Mice
12-week-old female NOD/SCID/IL2Rγnull mice were purchased from Jackson laboratory and housed in the animal facility of Memorial Sloan-Kettering Cancer Center. All murine studies were performed according to institutional animal care and use committee approved protocols.
2.3. Cell Preparation
Mononuclear cells (MNCs) from CB and AB were obtained by centrifugation over Ficoll-Hypaque (Amersham Pharmacia Biotec, Uppsala, Sweden). CD34pos cells from CB were separated using the Human Cord Blood CD34 Selection Kit (STEMCELL Technologies Inc, Vancouver, BC, Canada), as described by the manufacturer.
2.4. Expansion of Human Erythroblasts
CD34pos cells and MNC (5 × 10⁴ and 106 cells/mL, resp.) were cultured under human erythroid massive amplification (HEMA) conditions in a proliferative phase stimulated with stem cell factor (SCF, 10 ng/mL, R&D System, Minneapolis, MN, USA), erythropoietin (EPO, 5 U/mL, Epogen, Amgen, Thousand Oaks, CA, USA) and interleukin 3 (IL-3, 1 ng/mL, Biosource, San Jose, CA, USA), dexamethasone and estradiol (both at 10−6 M, Sigma, St. Louis, MO, USA) up to 10 days and subsequently in a differentiative phase stimulated with EPO (5 U/mL), insulin (10 ng/mL, Calbiochem, La Jolla, CA, USA), and FeSO4 (10−6 M, Sigma) up to 4 days, as previously described [11, 12].
2.5. Colony Forming Assay
The colony forming ability of sorted cells was evaluated in standard semisolid methylcellulose cultures (40%, Fluka Biochemika) stimulated with SCF (10 ng/mL), IL-3 (10 ng/mL), granulocyte-macrophage colony-stimulating factor (GM-CSF, 10 ng/mL), granulocyte colony-stimulating factor (G-CSF, 100 ng/mL) and EPO (5 U/mL). The cultures were incubated at 37°C in a fully humidified 5% pCO2 atmosphere and scored after 2 days for colony forming unit erythroid (CFU-E) and after 8 days for burst forming unit erythroid (BFU-E) and colony forming unit granulocyte-macrophages (CFU-GM) colonies.
2.6. Cell Viability and Phenotypic Analysis
Cell numbers and viability were assessed by microscopic evaluation after trypan blue (Boston Bioproducts, Ashland, MA, USA) staining. Erythroid cells were identified using standard morphological criteria by visual examination of cytocentrifuged cell preparations (Cytospin 3, Shandon, Astmoor, England) stained with May-Grünwald-Giemsa (Fisher Scientific, Pittsburg, PA, USA) using the Axioscope light microscope equipped with a Coolsnap video camera (Zeiss, Oberkochen, Germany). For flow cytometric analyses, cells were suspended in Ca2+/Mg2+-free phosphate-buffered saline, supplemented with 1% BSA, stained with either phycoerythrin- (PE-) conjugated CD36 (antithrombospondin receptor) [13], -CD184 (CXCR4), -CD162 (PSLG1), -CD49d (VLA-4), or allophycocyanin- (APC-) conjugated CD235a (anti-glycophorin A), pan hematopoietic human- (FITC-) conjugated CD45 or appropriate isotype controls (all from Becton Dickinson Biosciences, Franklin Lakes, NJ, USA). For GFP determinations, autofluorescence of untreated cells was analysed as negative control. Fluorescence was analyzed with the FACS Canto (Becton Dickinson Biosciences) equipped with three air-cooled and solid-state lasers (488 nm, 633 nm and 407 nm). Dead cells were excluded by propidium iodide (PI, 5 μg/mL, Sigma) staining.
2.7. Fluorescence Labelling of Human EBs. CFSE Labeling
EBs obtained at day 11 of HEMA cultures were stained with CFSE (10 μM, Invitrogen, Carlsbad, CA, USA) as described [14] and cultured for 24 additional hrs under HEMA conditions. Retrovirally mediated labeling. CB CD34pos cells were cultured for 3 days in X-VIVO 10 media (Lonza Walkersville, Walkersville, MD, USA) containing thrombopoietin (TPO, 100 ng/mL), SCF (100 ng/mL), Flt3 Ligand (Flt3L, 100 ng/mL), IL-3 (20 ng/mL), and the PG-13 retroviral producer supernatant [15, 16] which contains the membrane anchored form of the Gaussia luciferase enzyme (extGLuc) [16] was added twice 24 hrs apart. The transfected CD34pos cells were then cultured under HEMA conditions for 6 additional days. An aliquot of nontransduced CD34pos cells from the same isolation was cultured in parallel under HEMA condition as control.
2.8. Transfusion Protocol
Two protocols were investigated. In the first experiment (See Supplementary Figure 1 in Supplementary Material available online at doi: 10.4061/2011/673752), 2 NOD/SCID/IL2Rγnull mice were injected via the tail vein with 25 × 106 CFSE-labeled EBs. Twenty-four hrs prior to injection, mice were bled (500 μL) to increase endogenous EPO levels. In the second experiment (Supplementalry Figure 2), intact and splenectomized NOD/SCID/IL2Rγnull mice (4 mice per group) were used. NOD/SCID/IL2Rγnull mice were anaesthetized with isoflurane (Baxter, Deerfield, USA) and splenectomized after double ligation of the splenic artery and vein [17]. The muscle, peritoneum, and skin were closed in separate layers using sterile 5–0 absorbable suture. Intact and splenectomised mice were transfused via the tail vein with 25 × 106 retrovirally labeled EBs together with human EPO (20 U/mouse). Twenty four hours earlier, mice had been bled (500 μL). In both experiments, mice receiving culture media only served as negative controls and all the mice were sacrificed 4-5 days following transfusion for further analyses.
2.9. Immunocytochemistry
Smears of single cell suspensions from femur, spleen, and liver and cultured EBs prepared by cytocentrifugation (Shandon, Astmoor, England) were fixed with paraformaldehyde (3.7%, Electron Microscopy ScienceHatfield, PA, USA) for 30 min and rinsed 2 times with double distilled water. Smears were incubated with an antihuman glycophorin A antibody (CD235a, Abcam, Cambridge, MA, USA) and the immunoreaction detected with the avidin-biotin immunoperoxidase system (Vectastain Elite ABC Kit; Vector Laboratories, Burlingame, CA) on slides counterstained with hematoxylin-eosin, as described by the manufacturer. Aliquots of injected EBs and smears from media-treated mice were used as positive and negative controls, respectively. Histological observations were carried out using a ZEISS AXIOSKOPE light microscope (Jena, Germany) equipped with a Coolsnap Videocamera. Enumeration of human CD235apos cells was performed by two separate investigators in a blinded fashion.
2.10. Bioluminescence Imaging
Bioluminescence was detected using a Xenogen IVIS Imaging System (Xenogen) as previously described [18]. Imaging was performed 24–48 hrs following intravenous injection of coelenterazine (250 μg) (Nanolight Technology) via the tail vein. Dorsal and ventral images of the animals were acquired with acquisition times in the range of 1 to 3 min. Field of view of 15, 20, or 25 cm with low, medium, or high binning in an open filter was utilized to maximize signal intensity and sensitivity. We obtained acquisition of image datasets and measurements of signal intensity through region of interest (ROI) analysis using Living Image software (Xenogen). Normalized images are displayed on each dataset according to color intensity.
2.11. Statistical Analyses
Results are expressed as mean (±SD) of at least three replicate experiments unless stated otherwise. Statistical analysis was performed by Anova using the computer software Origin 5.0 for Windows (Microcal Software, Inc., Northampton, MA, USA).
3. Results
3.1. Cord Blood MNC Generate Greater Numbers of Less Mature Erythroid Cells Than Adult Blood MNC under HEMA Conditions
Our group has previously identified a culture strategy for massive production of EBs ex vivo from both CB and AB MNC defined as human erythroid massive amplification (HEMA) culture [11]. Under these culture conditions, in the experiments included in this paper, AB MNC generated EBs with an FI = 15 while the number of EBs generated by CB MNC was 3-times greater (FI = 40Figure 1).
Figure 1.
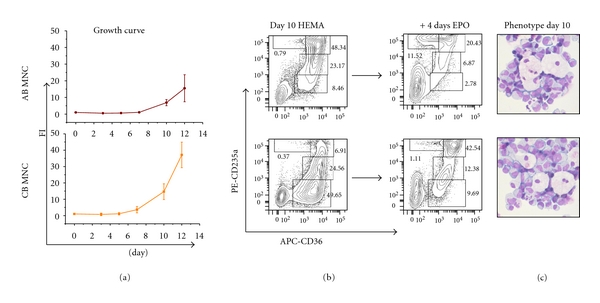
MNC from AB and CB generate great numbers of EBs under HEMA conditions. (a) Cell number (as Fold Increase, FI, with respect to day 0), (b) maturation profile (cytofluorimetric analysis on the basis of the expression of CD36 and CD235a), and (c) representative morphology (by May-Grunwald staining) of EBs generated in HEMA culture seeded with MNC from either CB or AB. The ability of CB and AB EBs obtained at day 10 to proceed along the maturation pathway after 4 days of culture in the presence of EPO only is also compared (b). The flow cytometric profile used to define EBs maturation is presented in Supplemental Figure 3. The flow charts are representative of those obtained in at least three independent experiments with MNC from different CB or AB donors. The numbers in the quadrants present the frequency of EBs in the gates R1 to R4. Frequencies obtained in multiple experiments are presented as mean (±SD) in Table 1.
By CD36/CD235a profiling, EBs generated under HEMA conditions may be separated into 4 classes of progressively more mature cells represented by CD36high/CD235aneg (class I, gate R1) and CD36highCD235alow (class II, gate R2) cells, which contain colony-forming unit-erythroid (CFU-E) and pro-EBs, and CD36highCD235ahigh (class III, gate R3) and CD36lowCD235ahigh cells (class IV, gate R4), which contain basophilic-polychromatic and orthochromatic EBs, respectively (Supplemental Figure 3). BFU-E- and CFU-GM-derived colonies are not detectable in cells generated in HEMA culture from day 8 on (data not shown). At day 10 of HEMA culture, a significant proportion of EBs generated in cultures of AB and CB MNC are represented by immature class I and class II EBs (38 and 78%, resp.) (Figure 1 and Table 1). Exposure of Day 10 EBs derived from both AB and CB to EPO alone for 4 days increased the proportion of mature class III and IV EBs up to 52–70%. CB-derived EBs contained a lower fraction of mature cells than AB-derived EBs both in HEMA culture and when cultured with EPO alone (Figure 1 and Table 1).
Table 1.
Frequency of EBs divided according to their maturation profile at day 10 of HEMA culture seeded with AB and CB MNC and after 4 days of additional culture in EPO alone to induce maturation. The gates used to define the 4 maturation classes used in this study are described in Supplemental Figure 3.
| Maturation classes | AB MNC | CB MNC | ||
|---|---|---|---|---|
| Day 10 (%)* | Day 4 + EPO (%) | Day 10 (%) | Day 4 + EPO (%) | |
| Class I (CD36highCD235aneg) | 17.0 ± 6.2 | 1.6 ± 0.6 | 53.8 ± 8.9 | 11.9 ± 4.8 |
| Class II (CD36highCD235alow) | 21.7 ± 4.1 | 9.7 ± 1.1 | 21.5 ± 6.5 | 10.6 ± 4.5 |
| Class III (CD36highCD235ahigh) | 49.2 ± 2.4 | 55.1 ± 7.4 | 9.1 ± 4.6 | 49.5 ± 6.4 |
| Class IV (CD36lowCD235ahigh) | 1.2 ± 1.1 | 15.8 ± 4.4 | 0.2 ± 0.6 | 1.7 ± 1.1 |
*Percentages were calculated with respect to the total cell population present in culture (EBs and non EBs).
Macrophage islands surrounded by 6–9 EBs were commonly detected in smears of both AB and CB derived EBs beginning at day 7 and up to day 10 of HEMA culture (Figure 1(c)). The frequency of these islands on the smears was correlated with the frequency of nonerythroid cells which had survived in culture (data not shown). The random nature the macrophages in HEMA culture prevented quantification of this phenomenon. Further studies in which cultured EBs will be exposed to monocytes purified from human blood, marrow, and spleen are required to define the interaction between these cell populations in vitro.
3.2. Dynamic Pattern of Adhesion Receptor Profiling during the Maturation of AB- and CB-Derived EBs in Culture
The expression patterns of CXCR4, PSLG1, and VLA-4 on EBs obtained from AB and CB at day 10 of HEMA and induced to mature for 4 days in cultures containing EPO alone is presented in Figures 2, 3, and Supplemental Figure 4.
Figure 2.

Adhesion receptor profiling during in vitro maturation of EBs expanded from AB (a) and CB (b). Three color flow cytometry analysis for CD36 and CD235a in combination with either CXCR4 (CD184), PSGL-1 (CD162), or VLA-4 (CD49d) of EBs obtained at day 10 of HEMA culture from AB and CB MNC (Prol 10) and at day 1 (Diff Day 1) and 4 (Diff Day 4) of maturation with EPO alone, as indicated. EBs were divided into 4 maturation classes defined by the levels of CD36 and CD235a expression identified by the gates R1 to R4 and corresponding to Class 1 to 4 (see Supplemental Figure 3 for further details).
Figure 3.
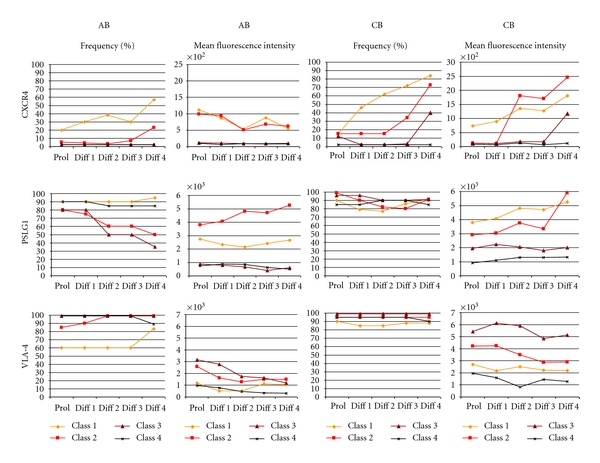
Time course of the frequency and MFI of CXCR4, PSL1, and VLA4 expression during in vitro maturation of EBs expanded from adult and cord blood, as indicated. Values observed with EBs at different stages of maturation are color coded: Class 1 (gate R1): light orange, Class 2 (gate R2): red, Class 3 (gate R3): brown, and Class 4 (gate R4): black (see also Supplemental Figure 1). The results correspond to the flow charts presented in Figure 2.
Expression of CXCR4 was barely detectable either in AB- or CB-derived EBs at day 10 of culture, irrespective of the stage of maturation (Figures 2 and 3). Exposure of these cells to EPO alone rapidly (within 1 day) activated CXCR4 expression first on immature cells (Class 1, R1) and then by day 4 also on cells expressing a more mature phenotype (Class 2 for AB EBs and Class 2 + 3 for CB EBs). The most mature Class 4 EBs (both from AB and CB) never expressed CXCR4 (Figures 2 and 3). The dynamic pattern of CXCR4 expression is visualized by the direct comparison of CD184 (CXCR4) and CD235a (glycophorin A) expression as AB and CB EBs matured in EPO alone culture presented in Supplemental Figure 4. Although similar patterns of CXCR4 expression were observed in EBs derived from AB and CB, a greater percentage (30–80% versus 15–40%) of CB-derived EBs expressed CXCR4 than AB EBs and the mean fluorescence intensity (MFI) was also greater for CB (range 1000–2500 versus 500–1000).
At day 10, both AB and CB derived EBs expressed high levels of PSLG1 regardless of their maturation stage (80–90% PSLG1pos cells with MFI in the range of 1000–4000) (Figures 2 and 3). The expression of PSLG1 was conserved when EBs were induced to mature with EPO alone for 4 days (Figures 2 and 3) although direct comparison of PSLG1 expression against CD235a indicated an association between reduced expression of this receptor and maturation which was particularly evident in the case of AB-derived EBs (Supplemental Figure 4).
A great percentage (60–100%) of day 10 EBs expressed robust levels of VLA-4 (MFI in the range of 1000–3000 for AB EBs and 2000–6000 for CB EBs) regardless of their maturation status. The frequency of VLA4pos EBs remained high when the cells were induced to mature with EPO for 4 days, although in the case of AB EBs the levels of VLA4 expression per cell decreased with time in culture when stimulated with TPO alone (Figures 2 and 4). The apparently high maturation-independent pattern of VLA4 expression in AB and CB EB was also observed by direct analyses of VLA4/CD235a expression patterns (Supplemental Figure 4).
Figure 4.
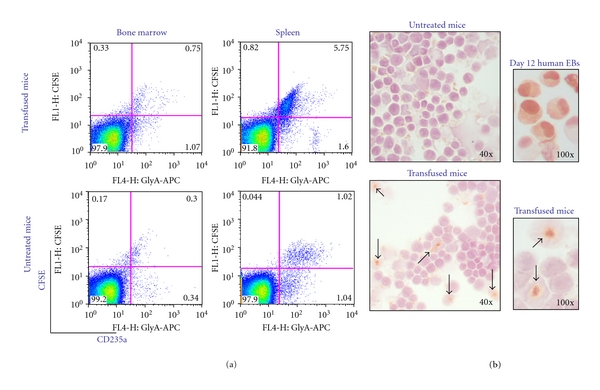
At day 4 after transfusion, human EBs are mostly detectable in spleen of NOD/SCID/IL2Rγnull mice. (a) Flow cytometric analysis for human CD235a and CFSE expression of bone marrow and spleen cells from transfused and nontransfused (negative control) NOD/SCID/IL2Rγnull mice. The results are representative of those obtained with 2 mice per group (see Table 2 for further details) and are representative of those observed in three separate experiments. (b) Immunocytochemistry for human CD235a of cells from the spleen of untransfused (top left panel) and transfused (lower panels) mice sacrificed 4 days after the human EBs transfusion, as indicated. Cells from control mice (top left panel) are negative while cultured human EBs (top right panel) are all positive. In transfused mice, human CD235apos cells (arrows) represented up to 18.2 ± 5.6% of total splenic cells. However, they were trapped inside larger CD235aneg cells, probably macrophages of murine origin. Magnifications 40x and 100x, as indicated.
In conclusion day 10 EBs express low levels of CXCR4 but robust levels of PSLG1 and VLA4. Induction of these cells to mature by exposure to EPO alone rapidly activates CXCR4 expression but has modest or no effect on the expression of PSLG1 and VLA4, with the exception of a reduction in the number of PSLG1pos class 2 and class 3 EBs observed in culture of AB-derived cells.
3.3. Cell Fate of Ex Vivo Expanded CB EBs in NOD/SCID/IL2Rγnull Mice
The greater levels of adhesion receptor expression of CB EBs suggested that these cells might be more able than AB EBs to establish the cellular interactions necessary for maturation in vivo and therefore more suitable for use in animal models to analyze cell fate following transfusion. We chose the NOD/SCID/IL2Rγnull mouse as the animal model for these experiments because it has been shown to readily support engraftment of human CD34pos hematopoietic stem cells and represents a superior, long-lived model suitable for studies employing xenotransplantation strategies [20, 21].
In preliminary experiments, the fate of murine RFP-labeled EBs derived from liver and transfused into syngeneic thalassemic mice was determined. Murine RFP-labeled EBs (30–150 × 106) transfused in unbled thalassemic mice generated undetectable or barely detectable levels of red cells. By contrast, when mice were bled 150 to 600 μL 24 hrs before transfusion, the same numbers of murine RFP-labeled EBs generated as many as 5 × 10⁹-5 × 10¹⁰ red cells (A.R. Migliaccio and P. Frenette, unpublished observations). These results indicate that bleeding facilitates in vivo maturation of transfused murine EBs, probably by increasing endogenous EPO levels. On the basis of these data we decided to bleed animals 24 hr prior to transfusion with human EBs.
In the initial three experiments, CFSE-labeled EBs derived from CD34pos CB cells after 11 days in HEMA culture were transfused via the tail vein (25 × 106 EBs per mouse) into NOD/SCID/IL2Rγnull mice that were bled (500 μL) the day before (Supplemental Figure 3). Mice were sacrificed at day 4 after transfusion for detection of human CD235apos EBs and at day 21 for the presence of human hematopoietic cells of all lineages (CD45pos).
At day 4, FACS analyses revealed the presence of 0.99–1.18% and 2.57–5.29% of CD235apos cells (both CFSEpos and CFSEneg) in bone marrow and spleen, respectively, of the transfused mice (Figure 4(a) and Table 2). The presence of CFSEnegCD235apos cells indicated that some of the human EBs had undergone proliferation in vivo during the 4 days after transfusion. Assuming that the total number of cells in bone marrow and spleen of a mouse is 300 × 106 cells and ∼108 cells, respectively [19], it is calculated that the bone marrow and spleen of the transfused animals contained ~3.5 × 10⁶ (1.7% of 3 × 10⁸ cells) and 7 × 10⁶ (6.8% of 108 cells) human EBs, respectively (Table 2). Therefore, the majority of human EBs lodged in the spleen. Immunocytochemical analyses for the expression of the human erythroid CD235a marker confirmed the presence of numerous (18% of the total cell population) human CD235apos cells in the spleen of the transfused animals (Figure 4(b)). However, the CD235apos cells were trapped inside larger CD235aneg cells, probably macrophages of murine origin. By day 18, very few (0.01–0.06%) human CD235apos cells were detectable in the blood. By day 21, human CD45pos cells were undetectable in marrow, spleen, and liver of the transfused NOD/SCID/IL2Rγnull mice, confirming the colony forming data, which indicated that CB EBs expanded for 10 days under HEMA conditions no longer contain hematopoietic progenitor cells. These results suggest that human EBs lodged preferentially in the spleen where they were engulfed and probably destroyed by macrophages.
Table 2.
Frequency and total number of cells expressing the human CD235a in bone marrow and spleen of NOD/SCID/IL2Rγnull mice transfused 4 days earlier with CFSE-labeled EBs. Both CFSE-positive and CFSE-negative human CD235apos cells were detected in the organs of the animals after transfusion, an indication that some of the human Ebs had proliferated in vivo.
| CSFE+CD235a+ (%) | CSFE−CD235a + (%) | CSFE++CSFE−CD235a+−control (%) | Total no. of CD235+ cells/organ* | |
|---|---|---|---|---|
| BM | ||||
| Control | 0.3 | 0.34 | 0 | |
| Transfused mice (2 mice) | 0.53–0.75 | 1.1–1.07 | 0.99–1.18 | 3.0–3.5 × 10⁶ |
| Spleen | ||||
| Control | 1.02 | 1.04 | 0 | |
| Transfused mice (2 mice) | 3.34–5.75 | 1.3–1.6 | 2.57–5.29 | 2.6–5.3 × 10⁶ |
The frequency of human CD235a+ cells was obtained after subtracting the background signal observed in untreated controls.
*The total number of cells per organ was calculated assuming that a mouse contain 300 × 106 BM and 100 × 106 spleen cells [19].
To determine if splenectomy would facilitate lodgment in the marrow, the fate of ex vivo expanded EBs transfused to splenectomized and intact NOD/SCID/IL2Rγnull mice was compared. Cell biodistribution was analyzed by retroviral-mediated labeling with the external Gaussia luciferase genes (extGLuc), using bioluminescence imaging, and e green fluorescent protein (eGFP) was used for flow cytometry determinations of CD34pos CB cells which were then expanded under HEMA conditions (see [16] and Supplemental Figure 2). The extGLuc enzyme is a newly engineered Gaussia luciferase which contains the CD8 transmembrane domain at its carboxy terminus. The presence of this domain allows membrane anchoring and cell surface retention of extGLuc, significantly enhancing the bioluminescent signal [16].
The expansion potential of retrovirally transduced and control CD34pos CB cells is compared in Figure 5. By day 9, 5 × 10⁴ unmanipulated CD34pos CB cells generated 16 × 106 EBs (FI = 325-fold) while 5 × 10⁶ CD34pos CB cells which had been cultured for 3 days under conditions permissive for retroviral transduction (see Supplemental Figure 2) generated 240 × 106 EBs (FI = 48), the great majority of which (80%) expressed robust levels of eGFP (MFI >5 × 10⁴). The difference in FI between HEMA culture of unmanipulated and retrovirally transduced CD34pos CB cells was not associated with changes in death rates, as evaluated by propidium iodide staining (data not shown) and may be related to the likelihood of underestimations of the low number of cells (5 × 10⁴) used to initiate the cultures of un-manipulated cells. By FACS analysis, the majority of CD36pos EBs derived from retrovirally transduced CD34pos CB cells did not express CD235a. However, by morphological analysis the maturation stage of these cells was comparable to that of EBs derived from un-manipulated CB cells (Figure 5). We believe that lower expression of CD235a by the retrovirally transduced EBs was a consequence of interference between the fluorescence signal of this antibody and that of eGFP.
Figure 5.
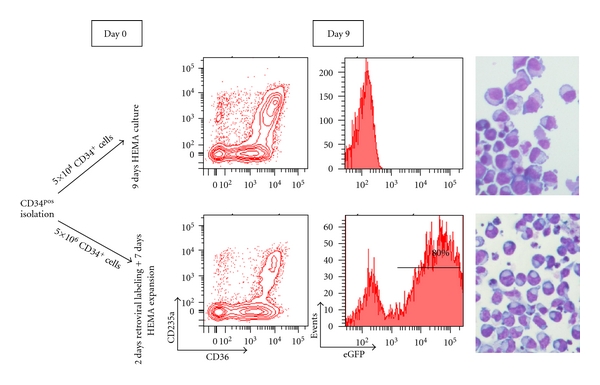
Ex vivo expanded extGLuc+ EBs express high level of eGFP by FACS analyses. Maturation profile and transfection efficiency of nontransfected (as control, top panels) and transfected (bottom panels) EBs at day 9 of HEMA culture identified on the basis of CD36/CD235a and eGFP expression (on the left) and on the basis of morphology (May-Grunwald staining, on the right), magnification 40x. The transfected EBs express great levels of eGFP. The transfection did not alter the morphology of the cells but slightly reduced the expression of the CD235a probably due to interference with the GFP signal. At day 9, in transfected and control cultures the fold increase was 48-fold and 325-fold, respectively, and the viability was 98% in both cases.
Aliquots (25 × 106) of retrovirally transduced EBs were injected via the tail vein together with 20 U of human EPO in splenectomized and control NOD/SCID/IL2Rγnull mice which had been bled (500 μL) the day before. Bioluminescent imaging was performed 24 and 48 hrs after transfusion. Twenty-four hrs after transfusion, the extGLuc bioluminescent signal was virtually undetectable, other than at the site of injection in intact mice (Figure 6). In contrast, significant levels of extGLuc signal were observed in legs and skull of splenectomized mice, an indication that human EBs may have homed to the BM. In these mice, significant levels of bioluminescent signal were also detected in the abdomen (Figure 6). These data demonstrate that in the absence of the spleen CB EBs lodge in marrow and liver.
Figure 6.
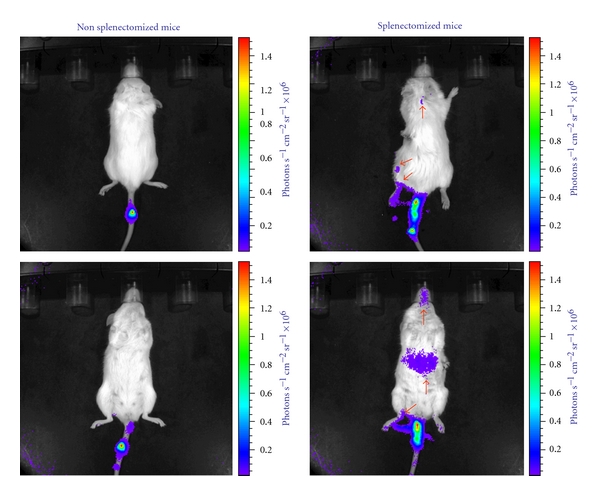
Significant level of extGLuc signal is detectable in splenectomized mice 24 hrs after transfusion. Bioluminescent imaging of nonsplenectomized (left panels) and splenectomized (right panels) mice 24 hrs after injection with extGLuc+EBs, as indicated. Dorsal and ventral imaging is presented in the top and bottom panels, respectively. In intact mice, the bioluminescent signal was virtually undetectable other than at the site of injection (the tail). In the splenectomized mice, significant signal levels were observed in limbs (lower extremity), skull (indicating marrow localization), and abdomen (indicating liver localization because the spleen had been removed). Arrows indicate the positive signal. Data are representative of those observed with 4 mice per experimental point.
Four days after transfusion, mice were sacrificed and the presence of human CD235apos cells in bone marrow and liver of the transfused NOD/SCID/IL2Rγnull mice was analyzed by FACS. In the case of intact mice, great numbers (∼15% of the total cell population) of human CD235apos cells were detected in spleen while human CD235pos cells in marrow and liver were barely detectable. By contrast, in splenectomized animals, great numbers of human CD235apos cells were detectable in bone marrow (25%) and liver (7%) (Figure 7). Interestingly these cells did not express CD36, an indication that they had matured in vivo. However, red cells in the blood remained low both in intact and splenectomized mice (data not shown).
Figure 7.
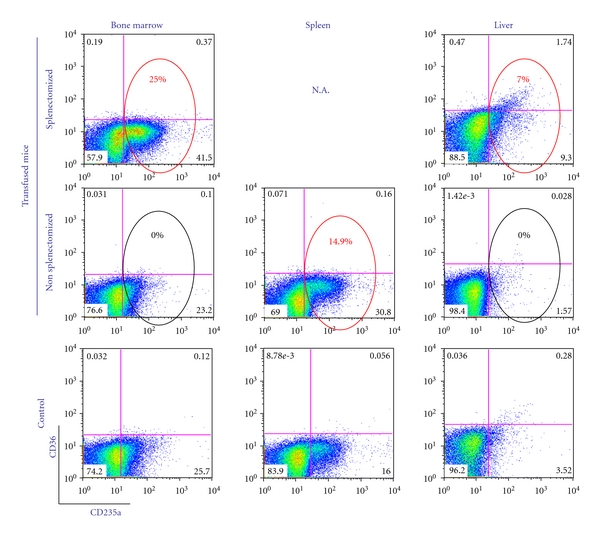
By flow cytometry of human CD36/CD235a expression, human CD235apos cells were detectable in marrow and liver of splenectomized mice 4 days after transfusion. Flow cytometry analysis of bone marrow (left panels), spleen (middle panels) and liver (right panels) from splenectomized (top panels), non splenectomized (middle panels), and nontransfused controls (bottom panels) of representative mice are shown. The small numbers indicate the frequency of the cells detected within the respective quadrant. Values within circles correspond to the percentage of human cells calculated by subtracting the frequency detected in the negative controls in the corresponding bottom panels. The red circles indicate the frequency of human cells. Of note, the majority of the human CD235a positive cells were negative for CD36, an indication that the human EBs had matured in vivo. Similar results were obtained by analyzing the cells for eGFP expression. Data are representative of those obtained with 3 mice per experimental point.
These results indicate that the removal of the spleen favors homing of human EBs to the bone marrow of NOD/SCID/IL2Rγnull mice.
4. Discussion
An important issue for the quality and safety of cellular products lies in the development of a surrogate assay for a cell product that is as close as possible to the final product intended for therapeutic use. Short of a phase I clinical study, the optimal evaluation of human cell products is represented by preclinical studies performed in immuno-deficient mouse models. In our experience, such an approach can not only help validation studies and the establishment of a potency assay, but also help guide the development of the production process itself by defining optimal cell purification procedures, culture conditions, and scale-up systems. This study focused on establishing a xenogeneic model to test EBs expanded ex vivo under HEMA conditions as potential transfusion products. The availability of such a model may advance other areas of research by providing a single method to compare the functional status of EBs derived from primary hematopoietic stem/progenitor cells with those derived from other stem cells sources such as human embryonic stem cells and induced pluripotent stem cells.
This study demonstrates that the maturation of ex vivo generated CB- and AB-derived EBs is associated with a dynamic pattern of adhesion receptor expression. At day 10–11 of HEMA culture, the majority of immature AB- and CB-derived EBs expressed low levels of CXCR4 and high levels of both VLA-4 and P-selectin ligand 1 (Figures 2 and 3). Once induced to mature by exposure to EPO alone, these EBs rapidly (within 24 hrs) activated expression of CXCR4 while retaining expression of VLA-4 and down-modulating expression of PSGL-1. By day 4 of maturation culture, the majority of EBs had progressed to the mature CD235ahighCD36high phenotype (Figure 1 and Table 1) and had reduced expression of all the adhesion receptors. Minor ontogenetic differences where observed since CB EBs expressed greater levels of CXCR4, PSGL-1, and VLA4 and activated CXCR4 expression upon EPO exposure more readily than AB EBs. While the adhesion receptor pattern expressed by human erythroblasts maturing in vivo is not known, these data are available in mice. Immature murine EBs obtained from both fetal liver and adult bone marrow express robust levels of CXCR4, PSGL-1 and α4 integrins. These cells lose PSGL-1 expression and retain CXCR4 and VLA-4 expression with maturation [22, 23]. These high levels of CXCR4 represent the major difference between the pattern of adhesion receptors expressed by murine cells and those expressed by ex vivo expanded human EBs. The low levels of CXCR4 expression in human EBs generated in HEMA and the fact that these cells rapidly, within 24 hrs, acquire CXCR4 expression upon exposure to EPO alone are consistent with reports that CXCR4 expression is suppressed by dexamethasone [24], one of the components of HEMA culture [11]. On the other hand, the low levels of CXCR4 expression observed when human EBs mature (Class 4) is expected since these cells are supposed to downregulate expression of CXCR4, the major receptor involved in cell retention in the marrow [25], as part of the process which allows them to egress from the marrow [6].
A separate set of experiments evaluated the fate of CFSE- or retrovirally-labeled CB-derived human EBs when transfused in NOD/SCID/IL2Rγnull mice. Bleeding and/or infusing the animals with human EPO to increase EPO levels greatly increased the detection of human EBs in the animals. By day 4 after transfusion, 1.5–5% of the cells in BM and spleen, respectively, of the animals were positive for human CD235pos by flow cytometry (Figure 4(a)). However, by immunohistochemistry, high numbers (18%) of cells positive for human CD235a by immunohistochemistry were detectable in the spleen (Figure 4(b)). The human CD235apos cells, however, appeared trapped inside larger CD235a cells suggesting that they had probably undergone phagocytosis by murine macrophages. These results indicated that preferential splenic lodgment and clearance of human EBs may represent a barrier to the use of mouse models for functional evaluation of human transfusion products.
CXCR4 plays a major role in cell lodgment and retention in bone marrow [25] but is dispensable for cell homing in spleen [17, 19]. We hypothesized that failure of human CB EBs to lodge in bone marrow may be determined by unbalanced expression of CXCR4 with respect to the expression of other adhesion receptors, such as PSGL1, VLA-4, and CD36 (CD36 specifically guide cell interaction with the endothelial system [26]). Therefore, removal of the spleen, by reducing cell interactions mediated by these receptors, may favor lodgment in the marrow of EBs expressing low levels of CXCR4. This hypothesis was tested by comparing lodgment of human EBs in the bone marrow of intact and splenectomized NOD/SCID/IL2Rγnull mice. Bioimaging, followed by flow cytometry analyses, indicated that in the absence of the spleen retrovirally-labeled human EBs lodge in greater numbers in the marrow of the transfused animals (Figure 6). These results indicate that removal of the spleen greatly improves the survival of human EBs in mice. However, although signs of in vivo maturation were detected (detection in the marrow of cells positive for human CD235a but negative for CD36), the numbers of human erythrocyte detected in the blood of the transfused animals remained low.
Since CXCR4 expression was likely upregulation when human EBs were transfused in vivo (the cells were no longer exposed to DXM but exposed to human EPO), it is possible that, in addition to splenectomy, lodgment of human EBs in the marrow of the transfused animals may be improved by experimental approaches designed to increase CXCR4 expression, such as short pretransfusion exposure to EPO in vitro (Figures 2 and 3). Since cycling cells are known to have inferior homing [27, 28], in addition to increasing CXCR4 expression, these pretreatments may also improve homing by reducing the number of proliferating EBs. Indirect proof that CXCR4 over-expression may facilitate homing of human EBs in the marrow was recently obtained. Although treatments with many chromatin modifying agents decreases CXCR4 expression [29] the HDAC inhibitor valproic acid (VPA) is well known for its ability to upregulate CXCR4 expression while downmodulating expression of α-integrins and other adhesion receptors in several cell types [30, 31]. Recently Chaurasia et al. [32] have demonstrated that ex vivo expanded EBs obtained from VPA-treated CB CD34pos cells colonize, in addition to the spleen, the bone marrow when transfused into NOD/SCID and NOD/SCID/IL2Rγnull mice which had been functionally splenectomized by blocking the reticuloendothelium system with intraperitoneal injection of human type O+ red cells, as first reported by Neildez-Nguyen et al. [7]. However, since Chaurasia et al. [32] did not measure the levels of adhesion receptors expressed by VPA-treated EBs, it is not possible to assess the relative contribution of functional splenectomy and/or upregulation of CXCR4 (and/or down regulation of VLA-4 and PSGL-1 expression) to the improved lodgment of these cells in the marrow. Further studies are necessary to clarify this issue in order to establish the optimal pre-treatment (splenectomy versus functional reticulo-endotheium blockade) of the mouse model for functional evaluation of transfusion products generated by different stem cell sources.
A major difference between this study and the report by Chaurasia et al. [32] is represented by the levels of human erythrocytes detected in the blood of the transfused animals. In our study, human erythrocytes were barely detectable in the blood at any time point after transfusion while in the study of Chaurasia et al. discrete numbers of mature erythrocytes were detectable in the circulation starting from day 7 after transfusion (15% in NOD/SCID mice and 30% in the improved NOD/SCID/IL2Rγnull model). However, progenitor cells were no longer detectable among the human EBs expanded under HEMA conditions in this study (CD45pos cells were undetected in the transfused mice) while representing a significant proportion (7%) of the VPA-treated cells transfused by Chaurasia et al. [32]. It is therefore possible that in this case release of human erythrocytes in the blood was favored by the presence of human macrophages generated by human hematopoietic progenitors in the animal model. Another possibility, however, is that in our experiments, the erythrocytes released in the blood were cleared by the immune system.
Immunological responses have represented a barrier to the development of mouse models for functional assessment of human red cell products [33]. These barriers include cell-mediated and humoral immune responses triggered by antigens specifically expressed on red cells. Since some of the epitopes present on red cell antigens are expressed also by proteins on the membrane of bacteria presents in gut flora [34], red blood cells may trigger immune reactions leading to red cell lyses even in the absence of any prior sensitization. NOD/SCID, and the improved NOD/SCID/IL2Rγnull mice, lack cell mediated and immunoglobulin-mediated humoral responses (these mice do not have B cells). In addition, a great proportion of the immune-response against red blood cell antigens are often initiated in the spleen [35] which was transiently inactivated in [7, 32] and permanently removed in our study. The complement system plays a significant role in the humoral mediated red cell clearance in vivo. Since NOD/SCID/IL2Rγnull mice lack C5 [21], they have reduced activation levels of the alternative complement pathway. However, these mice express C3 [21] and may activate the classical complement pathway responsible for lysis of the human CD55 and CD59 deficient red cells observed in paroxysmal nocturnal hemoglobinuria (PNH) [36], preventing the use of NOD/SCID/IL2Rγnull mice for development of animal models for PNH studies. Human CB EBs expanded ex vivo under HEMA conditions express CD55 (53–87% positive EBs, MFI = 110–330) and CD49 (54–70%, MFI = 1,900–2500). However, the expression of these antigens greatly decreased when the cells were induced to mature with EPO for 5 days ex vivo (CD55: 17–27% EBs, MFI = 30–32; CD59: 28–56%, MFI = 20–76, data from 2 separate cultures) (A.R.Migliaccio and C.Whitsett, unpublished data). It is therefore possible that ex vivo expanded human EBs also lost CD55/CD59 expression during their maturation in the marrow of NOD/SCID/IL2Rγnull mice making their progeny susceptible to C3-mediated lysis. Since C3 deficient mice have been recently developed [37], we predict that C3-deficient NOD/SCID/IL2Rγnull mice will represent a better read-out animal model for the presence of human erythrocytes in the blood.
In conclusion, we describe data indicating that splenectomized NOD/SCID/IL2Rγnull mice represent a surrogate in vivo model to assess the potency of transfusion products generated ex vivo from different stem cell sources.
Supplementary Material
The supplemental material contains details on the experimental design of the transfusion of CFSE-labeled (Supplemental Figure 1) and ExtLuc+ (Supplemental Figure 2) human erythroblasts into NOD/SCID/IL2Rnull mice as well as the gating of CD36/CD235a labeling used to classify the maturity of human erythroblasts by flow cytometry (Supplemental Figure 3) and the analyses of the levels of CD184, CD162 and CD49d expressed by human erythroblasts generated ex vivo from adult blood and cord blood according to their maturation stage (defined by CD235a expression, Supplemental Figure 4).
Disclosure
All the authors have read the paper, concur with its content, and state that its content has not been submitted elsewhere. The authors have no conflict of interest to disclose.
Acknowledgments
This paper was supported by a grant from the NY-STAR foundation (C-06066), USA, and by institutional funds from the Mount Sinai School of Medicine and Istituto Superiore Sanità, Italy. Human recombinant SCF was provided by Amgen (Thousand Oaks, CA, USA; MTA no. 19982634-005).
References
- 1.Migliaccio AR, Whitsett C, Migliaccio G. Erythroid cells in vitro: from developmental biology to blood transfusion products. Current Opinion in Hematology. 2009;16(4):259–268. doi: 10.1097/MOH.0b013e32832bcaa2. [DOI] [PubMed] [Google Scholar]
- 2.Mohandas N. Banking on red blood cells. Nature Biotechnology. 2005;23(1):35–36. doi: 10.1038/nbt0105-35. [DOI] [PubMed] [Google Scholar]
- 3.Giarratana MC, Kobari L, Lapillonne H, et al. Ex vivo generation of fully mature human red blood cells from hematopoietic stem cells. Nature Biotechnology. 2005;23(1):69–74. doi: 10.1038/nbt1047. [DOI] [PubMed] [Google Scholar]
- 4.Chasis JA, Mohandas N. Erythroblastic islands: niches for erythropoiesis. Blood. 2008;112(3):470–478. doi: 10.1182/blood-2008-03-077883. [DOI] [PMC free article] [PubMed] [Google Scholar]
- 5.Migliaccio AR. Erythroblast enucleation. Haematologica. 2010;95(12):1985–1988. doi: 10.3324/haematol.2010.033225. [DOI] [PMC free article] [PubMed] [Google Scholar]
- 6.Papayannopoulou T, Abkowitz J, D’Andrea A, et al. Biology of erythtropoiesis, erythroid differentiation and maturation. In: Hoffman R, Benz EJ, Shattil SJ, et al., editors. Hematology: Basic Principles and Practice. 5th edition. Philadelphia, PA, USA; 2009. pp. 276–294. [Google Scholar]
- 7.Neildez-Nguyen TMA, Wajcman H, Marden MC, et al. Human erythroid cells produced ex vivo at large scale differentiate into red blood cells in vivo. Nature Biotechnology. 2002;20(5):467–472. doi: 10.1038/nbt0502-467. [DOI] [PubMed] [Google Scholar]
- 8.Tacke M, Ball CR, Schmidt M, et al. The inherent differentiation program of short-term hematopoietic repopulating cells changes during human ontogeny. Stem Cells and Development. 2010;19(5):621–628. doi: 10.1089/scd.2009.0202. [DOI] [PubMed] [Google Scholar]
- 9.Divoky V, Liu Z, Ryan TM, et al. Mouse model of congenital polycythemia: homologous replacement of murine gene by mutant human erythropoietin receptor gene. Proceedings of the National Academy of Sciences of the United States of America. 2001;98(3):986–991. doi: 10.1073/pnas.98.3.986. [DOI] [PMC free article] [PubMed] [Google Scholar]
- 10.Nicolini FE, Holyoake TL, Cashman JD, et al. Unique differentiation programs of human fetal liver stem cells shown both in vitro and in vivo in NOD/SCID mice. Blood. 1999;94(8):2686–2695. [PubMed] [Google Scholar]
- 11.Migliaccio G, Di Pietro R, di Giacomo V, et al. In Vitro mass production of human erythroid cells from the blood of normal donors and of thalassemic patients. Blood Cells, Molecules, and Diseases. 2002;28(2):169–180. doi: 10.1006/bcmd.2002.0502. [DOI] [PubMed] [Google Scholar]
- 12.Migliaccio G, Sanchez M, Masiello F, et al. Humanized culture medium for clinical expansion of human erythroblasts. Cell Transplantation. 2010;19(4):453–469. doi: 10.3727/096368909X485049. [DOI] [PMC free article] [PubMed] [Google Scholar]
- 13.Chen L, Gao Z, Zhu J, et al. Identification of CD13+CD36+ cells as a common progenitor for erythroid and myeloid lineages in human bone marrow. Experimental Hematology. 2007;35(7):1047–1055. doi: 10.1016/j.exphem.2007.04.003. [DOI] [PMC free article] [PubMed] [Google Scholar]
- 14.Hawkins ED, Hommel M, Turner ML, et al. Measuring lymphocyte proliferation, survival and differentiation using CFSE time-series data. Nature Protocols. 2007;2(9):2057–2067. doi: 10.1038/nprot.2007.297. [DOI] [PubMed] [Google Scholar]
- 15.Latouche JB, Sadelain M. Induction of human cytotoxic T lymphocytes by artificial antigen- presenting cells. Nature Biotechnology. 2000;18(4):405–409. doi: 10.1038/74455. [DOI] [PubMed] [Google Scholar]
- 16.Santos EB, Yeh R, Lee J, et al. Sensitive in vivo imaging of T cells using a membrane-bound Gaussia princeps luciferase. Nature Medicine. 2009;15(3):338–344. doi: 10.1038/nm.1930. [DOI] [PMC free article] [PubMed] [Google Scholar]
- 17.Migliaccio AR, Martelli F, Verrucci M, et al. Gata1 expression driven by the alternative HS2 enhancer in the spleen rescues the hematopoietic failure induced by the hypomorphic Gata1low mutation. Blood. 2009;114(10):2107–2120. doi: 10.1182/blood-2009-03-211680. [DOI] [PMC free article] [PubMed] [Google Scholar]
- 18.Gade TPF, Hassen W, Santos E, et al. Targeted elimination of prostate cancer by genetically directed human T lymphocytes. Cancer Research. 2005;65(19):9080–9088. doi: 10.1158/0008-5472.CAN-05-0436. [DOI] [PubMed] [Google Scholar]
- 19.Ghinassi B, Martelli F, Verrucci M, et al. Evidence for organ-specific stem cell microenvironments. Journal of Cellular Physiology. 2010;223(2):460–470. doi: 10.1002/jcp.22055. [DOI] [PMC free article] [PubMed] [Google Scholar]
- 20.Ishikawa F, Saito Y, Yoshida S. The differentiative and regenerative properties of human hematopoietic stem/progenitor cells in NOD-SCID/IL2rγnull mice. Current Topics in Microbiology and Immunology. 2008;324:87–94. doi: 10.1007/978-3-540-75647-7_5. [DOI] [PubMed] [Google Scholar]
- 21.Greiner DL, Hesselton RA, Shultz LD. SCID mouse models of human stem cell engraftment. Stem Cells. 1998;16(3):166–177. doi: 10.1002/stem.160166. [DOI] [PubMed] [Google Scholar]
- 22.Fraser ST, Isern J, Baron MH. Maturation and enucleation of primitive erythroblasts during mouse embryogenesis is accompanied by changes in cell-surface antigen expression. Blood. 2007;109(1):343–352. doi: 10.1182/blood-2006-03-006569. [DOI] [PMC free article] [PubMed] [Google Scholar]
- 23.Isern J, Fraser ST, He Z, et al. Developmental niches for embryonic erythroid cells. Blood Cells, Molecules, and Diseases. 2010;44(4):207–208. doi: 10.1016/j.bcmd.2010.02.008. [DOI] [PMC free article] [PubMed] [Google Scholar]
- 24.Kolbus A, Blázquez-Domingo M, Carotta S, et al. Cooperative signaling between cytokine receptors and the glucocorticoid receptor in the expansion of erythroid progenitors: molecular analysis by expression profiling. Blood. 2003;102(9):3136–3146. doi: 10.1182/blood-2003-03-0923. [DOI] [PubMed] [Google Scholar]
- 25.Lapidot T, Dar A, Kollet O. How do stem cells find their way home? Blood. 2005;106(6):1901–1910. doi: 10.1182/blood-2005-04-1417. [DOI] [PubMed] [Google Scholar]
- 26.Li A, Lim TS, Shi H, et al. Molecular mechanistic insights into the endothelial receptor mediated cytoadherence of plasmodium falciparum-Infected erythrocytes. PLoS One. 2011;6(3) doi: 10.1371/journal.pone.0016929. Article ID e16929. [DOI] [PMC free article] [PubMed] [Google Scholar]
- 27.Yong KL, Fahey A, Pizzey A, et al. Influence of cell cycling and cell division on transendothelial migration of CD34+ cells. British Journal of Haematology. 2002;119(2):500–509. doi: 10.1046/j.1365-2141.2002.03837.x. [DOI] [PubMed] [Google Scholar]
- 28.Sasaki Y, Jensen CT, Karlsson S. Enforced expression of cyclin D2 enhances the proliferative potential of myeloid progenitors, accelerates in vivo myeloid reconstitution, and promotes rescue of mice from lethal myeloablation. Blood. 2004;104(4):986–992. doi: 10.1182/blood-2003-07-2277. [DOI] [PubMed] [Google Scholar]
- 29.Mandawat A, Fiskus W, Buckley KM, et al. Pan-histone deacetylase inhibitor panobinostat depletes CXCR4 levels and signaling and exerts synergistic antimyeloid activity in combination with CXCR4 antagonists. Blood. 2010;116(24):5306–5315. doi: 10.1182/blood-2010-05-284414. [DOI] [PubMed] [Google Scholar]
- 30.Tsai LK, Leng Y, Wang Z, et al. The mood stabilizers valproic acid and lithium enhance mesenchymal stem cell migration via distinct mechanisms. Neuropsychopharmacology. 2010 doi: 10.1038/npp.2010.97. [DOI] [PMC free article] [PubMed] [Google Scholar]
- 31.Wang X, Zhang W, Ishii T, et al. Correction of the abnormal trafficking of primary myelofibrosis CD34+ cells by treatment with chromatin-modifying agents. Cancer Research. 2009;69(19):7612–7618. doi: 10.1158/0008-5472.CAN-09-1823. [DOI] [PMC free article] [PubMed] [Google Scholar]
- 32.Chaurasia P, Berenzon D, Hoffman R. Chromatin modifying agents promote the ex vivo production of functional human erythroid progenitor cells. doi: 10.1182/blood-2010-10-314567. Blood. In press. [DOI] [PubMed] [Google Scholar]
- 33.Hod EA, Arinsburg SA, Francis RO, et al. Use of mouse models to study the mechanisms and consequences of RBC clearance. Vox Sanguinis. 2010;99(2):99–111. doi: 10.1111/j.1423-0410.2010.01327.x. [DOI] [PMC free article] [PubMed] [Google Scholar]
- 34.Hudson KE, Lin E, Hendrickson JE. Regulation of primary alloantibody response through antecedent exposure to a microbial T-cell epitope. Blood. 2010;115(19):3989–3996. doi: 10.1182/blood-2009-08-238568. [DOI] [PMC free article] [PubMed] [Google Scholar]
- 35.Hendrickson JE, Saakadze N, Cadwell CM, et al. The spleen plays a central role in primary humoral alloimmunization to transfused mHEL red blood cells. Transfusion. 2009;49(8):1678–1684. doi: 10.1111/j.1537-2995.2009.02200.x. [DOI] [PMC free article] [PubMed] [Google Scholar]
- 36.Brodsky RA. Paroxismal nocturnal hemoglobinuria. In: Hoffman R, Benz EJ, Shattil SJ, et al., editors. Hematology: Basic Principles and Practice. 5th edition. Philadelphia, PA, USA: Elsevier; 2009. pp. 385–394. [Google Scholar]
- 37.Han R, Frett EM, Levy JR, et al. Genetic ablation of complement C3 attenuates muscle pathology in dysferlin-deficient mice. Journal of Clinical Investigation. 2010;120(12):4366–4374. doi: 10.1172/JCI42390. [DOI] [PMC free article] [PubMed] [Google Scholar]
Associated Data
This section collects any data citations, data availability statements, or supplementary materials included in this article.
Supplementary Materials
The supplemental material contains details on the experimental design of the transfusion of CFSE-labeled (Supplemental Figure 1) and ExtLuc+ (Supplemental Figure 2) human erythroblasts into NOD/SCID/IL2Rnull mice as well as the gating of CD36/CD235a labeling used to classify the maturity of human erythroblasts by flow cytometry (Supplemental Figure 3) and the analyses of the levels of CD184, CD162 and CD49d expressed by human erythroblasts generated ex vivo from adult blood and cord blood according to their maturation stage (defined by CD235a expression, Supplemental Figure 4).