

Abstract
We propose a multiscale exploration method to characterize the conformational space populated by a protein at equilibrium. The method efficiently obtains a large set of equilibrium conformations in two stages: first exploring the entire space at a coarse-grained level of detail, then narrowing a refined exploration to selected low-energy regions. The coarse-grained exploration periodically adds all-atom detail to selected conformations to ensure that the search leads to regions which maintain low energies in all-atom detail. The second stage reconstructs selected low-energy coarse-grained conformations in all-atom detail. A low-dimensional energy landscape associated with all-atom conformations allows focusing the exploration to energy minima and their conformational ensembles. The lowest energy ensembles are enriched with additional all-atom conformations through further multiscale exploration. The lowest energy ensembles obtained from the application of the method to three different proteins correctly capture the known functional states of the considered systems.
Keywords: equilibrium, conformational ensembles, multiscale, functional states
Introduction
A protein molecule can modulate its biological function and assume diverse functional states through large-scale motions at equilibrium.1,2 The relevance of different equilibrium conformations for protein function makes their characterization an important goal in experimental and computational research.3-7
Characterizing equilibrium conformations in silico is particularly challenging due to the vast high-dimensional space available to a protein chain. Recently proposed methods use experimental data to guide the search for relevant protein conformations.6 Other methods focus the search around an experimental structure.7,8
In this work we propose a multiscale approach to characterize the conformational space available to a protein at equilibrium. We refer to the proposed method as MuSE for Multiscale Space Exploration. The goal of MuSE is to complement current computational approaches to the structure prediction and the dynamics aspect of protein folding. The proposed method aims not to provide a high accuracy prediction of one single structure; rather, it focuses computational resources on obtaining a broad view of the equilibrium conformational space, with possibly multiple equilibrium states, starting solely from the amino-acid sequence. The equilibrium conformations obtained by MuSE can then serve as starting points to be further refined or employed in simulation and experiment.
To efficiently obtain a large set of equilibrium conformations, MuSE proceeds in two stages: first obtaining a broad view of the entire conformational space at a coarse-grained level of detail, then narrowing a refined exploration to selected low-energy regions in the space. In the end, this two stage exploration yields conformational ensembles associated with different minima in the energy landscape corresponding to a protein system. The lowest energy ensembles provide good candidates for a protein's functional states. The ensembles obtained when applying MuSE to three different proteins overall capture the populated functional states of these proteins at equilibrium.
The coarse-grained exploration in the first stage employs a Monte Carlo Simulated Annealing (MCSA) scheme to generate conformations. The choice of a physically-robust coarse-grained model is crucial to the success of the method, and it is the focus of much research.9-19 The coarse graining approach employed in this work is based on the Associative Memory Hamiltonian with Water (AMW) model developed in the Wolynes group12 to evaluate the energy of generated conformations. It is worth pointing out that the AMW model employed during the coarse-grained exploration contains no native structure information about the specific protein system under consideration.
Within the MC-SA scheme, conformations are generated by assembling backbone fragments from a database of protein structures. This fragment assembly approach is usually employed in structure prediction methods.20-24 The MC-SA exploration is multiscale as all-atom detail is periodically added to few generated coarse-grained conformations to ensure that the coarse-grained exploration leads to regions which maintain low energies in all-atom detail.
In the second stage, low-energy coarse-grained conformations are systematically reconstructed in all-atom detail. A nonlinear dimensionality reduction technique, Scalable Isomap (ScIMAP), is employed to obtain a few global coordinates that span the space of all-atom conformations.25 The global coordinates allow defining a low-dimensional pseudo free-energy landscape associated with all-atom conformations. The conformational ensembles corresponding to the energy minima in this landscape are enriched with additional low-energy all-atom conformations generated with the Protein Ensemble Method (PEM).7 PEM switches between coarse-grained and all-atom detail to efficiently explore the equilibrium all-atom conformational space around a given reference conformation.
The two-stage multiscale exploration is a key ingredient of the success of MuSE. The combination of the coarse-grained with the all-atom exploration boosts the exploration capability. In the end, this multiscale exploration allows MuSE to obtain several all-atom conformational ensembles with associated pseudo free energies that allow comparing the relevance of the ensembles at equilibrium.
Applications of MuSE to three different proteins show strengths and shortcomings of the proposed method. Specifically, the multiscale exploration employed in MuSE allows to efficiently generate different conformational ensembles that reproduce well the functional states in the proteins studied, namely, calbindin D9k, calmodulin, and adenylate kinase.
However, as discussed in the Materials and Methods section, some of the approximations required to efficiently obtain a broad view of the conformational space relevant for the native state have an effect on the final results; the analysis of such approximations will require further investigation in order to significantly improve this approach. For instance, as it is detailed later, the strategy employed to select coarse-grained conformations to pass from higher to lower temperature in the MC-SA scheme may introduce non-uniform bias in the sampling of the conformational space.
Other approximations – including the coarse-grained energy function, the mapping of generated conformations from coarse-grained to all-atom detail, and the clustering of the generated conformations – may introduce additional bias in the exploration of the conformational space and affect the final results. At this stage, inherent biases and approximations such as the above are difficult to disentangle and deconvolute from the final analysis. A careful investigation of these issues goes beyond the scope of the present paper and will be addressed in future work.
Because of the aforementioned biases, the statistics associated with the final ensembles generated by MuSE may significantly deviate from either the canonical or microcanonical ensemble statistics, on which one can reliably define thermodynamics functions. For this reason we refer to the final energy landscape we associate to the protein systems as “pseudo” free-energy landscape, where the “pseudo” attribute indicates that it can provide only a qualitative estimate of the possible free energy minima, and it should not be interpreted quantitatively.
In the following Materials and Methods section, we present the method and the approximations made in the multiscale exploration in more detail. The Results section shows that obtained ensembles overall capture the well-known functional states of the considered proteins. These ensembles provide robust starting points to characterize functional motions by means of further experimental or simulation techniques.26,27 We remind the reader that MuSE should be considered as a first attempt at addressing the difficult problem of extracting diverse conformational ensembles relevant for the protein native state, without using any a priori information on the native structure. It is clearly not the final solution to the problem; as discussed in the Discussion and Conclusion section, further improvements on accuracy and efficiency are the subject of ongoing and future research.
Materials and Methods
The goal of MuSE is to obtain all-atom conformational ensembles accessible to a protein at equilibrium. Exploring the conformational space in all-atom detail is a daunting task even for relatively short proteins (∼ 100 aas). MuSE proceeds in two stages to efficiently explore such a space.
In the first stage, the exploration gradually focuses from the entire conformational space to low-energy regions. An MC-SA scheme explores the space through many Monte Carlo (MC) simulations at decreasing temperatures. Conformations are generated by assembling 3-aa fragments (trimers) compiled over a non-redundant subset of the PDB. A coarse-grained level of detail is maintained, modeling only backbone heavy atoms and side-chain Cβ atoms. Bond lengths and angles are kept fixed in equilibrium values. Generated conformations are accepted or rejected with the Metropolis criterion, using a coarse-grained energy function to evaluate the energy of a conformation. The MC simulations are launched from carefully selected “seed” conformations which guide the exploration to regions of the coarse-grained space that are also low-energy in all-atom detail. The selection involves switching between coarse-grained and all-atom detail on a few conformations. This multiscale exploration yields in the end a large number of low-energy coarse-grained conformations that are suitable starting points for further refined exploration of emerging low-energy regions.
In the second stage, all-atom detail is introduced to low-energy coarse-grained conformations obtained from the first stage. Energies are minimized with an all-atom energy function and implicit solvent model. A low-dimensional energy landscape is associated with the all-atom space, revealing conformational ensembles associated with energy minima in the landscape. Regions associated with the minima are then explored in detail by employing PEM, a multiscale method that switches between different levels of detail to efficiently generate low-energy all-atom conformations. The final result is a large ensemble of all-atom conformations corresponding to the energy minima. The two stages of MuSE are described next. Implementation details follow.
Stage 1: Exploration of a Coarse-grained Conformational Space
The coarse-grained conformational space of a protein is explored by iterating over the following steps: (i) select coarse-grained conformations (seeds) from which to start the exploration; (ii) from each seed, initiate several MC simulations to generate more coarse-grained conformations; (iii) analyze generated conformations to select seeds for the next iteration. This iterative scheme is implemented as an MC-SA, where the effective MC temperature is lowered after every iteration.
The MC-SA scheme gradually lowers the MC temperature k times, from a high value T0 down to room temperature Tk = 300K. At higher temperatures, uphill movements in the underlying energy landscape are accepted with high probability, allowing crossing energy barriers and obtaining a broad view of conformational space. As temperature is lowered, downhill movements become prevalent and focus the search in local minima. The cooling schedule is detailed in Supplemental Material. At each temperature Ti (0 ≤ i ≤ k), ns seed conformations are chosen. At each temperature, several MC simulations are launched from each selected seed.
The choice of seeds is critical to the success of the MC-SA exploration. At the beginning, no information is yet available on the coarse-grained conformational space. Therefore, initial seeds for the MC simulations at the highest temperature T0 are obtained by randomly applying ≤ 2° perturbations to the ϕ = −120°, ψ= 120° backbone dihedral angles of an extended chain.
During the MC-SA exploration, low-energy coarse-grained conformations generated at the previous (higher) temperature are selected as seeds for the next (lower) temperature. In particular, for each lower temperature Ti+1, seeds are selected as follows. Conformations generated at a previous temperature Ti are collected in an ensemble ΩTi. A structural analysis is first performed over ΩTi to select nc low-energy conformations that are either obtained very often during the MC-SA or are geometrically distinct. These nc conformations represent nc “basins” in the coarse-grained space. The basins are mapped to an all-atom space by adding all-atom detail to the nc conformations with the side-chain addition method proposed in Heath et al.28 The ns resulting all-atom conformations are then energetically minimized with an all-atom energy function and implicit solvation model. In the end, ns out of the nc conformations are chosen that remain low in energy also in all-atom detail (see Supplemental Material). The all-atom detail is then stripped off the ns chosen seeds to continue the MC-SA exploration in the coarse-grained space.
Several parallel MC simulations are launched from each seed conformation selected as described above. The MC simulations launched from a particular seed differ from one another in the confinement of generated conformations around different values of the radius of gyration (Rg), that is, the average distance of atoms from the center of mass. The confinement is enforced through an energetic penalty in the coarse-grained energy function described below. Confining different MC simulations to search inside spheres of different radii allows discretizing the conformational space available to a protein and effectively expediting the exploration.
Low-energy conformations that capture a protein in different functional states may have different radii of gyration. For the proteins considered in this work, which undergo large-scale functional motions, it is not reasonable to bias the exploration to a single and prefixed confinement radius. To allow for large-scale motions, MuSE considers a large set of values for the confinement radius. These values are determined a priori through ns long MC simulations. These preliminary simulations are carried out from slightly perturbed extended conformations at the highest temperature T0 without any confinement. The distribution of Rg values of the generated conformations is discretized to determine m Rggoal values (details in Supplemental Material). These m values are then used in the MC-SA as follows: at each temperature Ti, from each of the ns seeds, m MC simulations are launched in parallel, each one confining generated conformations by one of the m Rggoal values.
Each MC simulation starts from a seed conformation and lasts for a total of NMC cycles. A cycle consists of N-4 moves, where N is the number of amino acids in a protein chain (there are at most N-2 trimers on such a chain). Each move involves choosing a trimer randomly over the chain. The local database of trimer configurations (compiled over PDB protein structures as detailed in Supplemental Material) is queried with the amino-acid sequence of the trimer. A configuration (6 backbone dihedral angles) is selected randomly over the ones available for the trimer in the database. The selected configuration that is proposed to replace the trimer configuration in the current conformation is accepted or rejected with the Metropolis criterion.
A coarse-grained energy function is used to evaluate the energy of the conformation resulting after each move. Since trimer configurations are compiled over PDB structures, local terms are not included in the energy function. The energy is a linear combination of the non-local terms ELennard–Jones, EH–Bond, Econtact, Ewater, Eburial, ERg. In particular, the ERg term implements the energetic penalty (Rg − Rggoal)2 if a conformation's radius of gyration Rg is above Rggoal.
It is important to point out that the Econtact, Ewater, and Eburial terms, implemented as in the AMW energy function,12 allow considering water-mediated interactions in coarse-grained conformations. The Cβ positions that are needed to evaluate these three terms are computed from the backbone of a conformation as in Milik et al.29 These three terms are crucial components of the coarse-grained energy function to guide the MC-SA exploration in the coarse-grained space. Description of the rest of the terms of the energy function together with further details on the length of an MC simulation and the update of the MC temperature in response to the number of accepted conformations during the simulation can be found in Supplemental Material.
Stage 2: Exploration in an All-atom Conformational Space
The first stage allows efficiently sampling a large number of coarse-grained conformations. Conformations obtained during the lowest three temperatures in the MC-SA are considered, and their energy distribution is evaluated. Among them, conformations with energy no higher than one standard deviation from the average energy are selected and used as starting points in the second stage of MuSE to explore the all-atom conformational space.
All-atom detail is added to the lowest-energy coarse-grained conformations as in Heath et al.28 Each all-atom conformation is then energetically minimized with the AMBER ff03 energy function30 and the Generalized Born (GB) implicit solvation model.31 Out of the resulting all-atom conformations, only those with energies no higher than 100 kcal/mol from the global minimum energy are retained. This cutoff discards conformations with negligible Boltzmann probabilities at equilibrium.
The all-atom conformations are projected on a low-dimensional landscape through ScIMAP, a nonlinear dimensionality reduction technique proposed25 and tested by our labs.32,33 Pseudo free-energy values are calculated as a function of the ScIMAP coordinates to yield a low-dimensional energy landscape. The “pseudo” attribute is a warning that thermodynamic quantities computed on the final ensembles obtained by MuSE can be significantly affected by the non-trivial biases introduced in the search, as detailed in the Discussion and Conclusion. The obtained pseudo free-energy landscape, however, provides a qualitative view of the relevant regions of the conformational space. Minima emerging in the pseudo free-energy landscape provide good candidates for conformational ensembles that are possibly relevant at equilibrium. The lowest-energy conformations associated with the minima are chosen as reference to further explore the conformational space around the minima. This focused exploration of the minima is implemented through PEM, a multiscale method proposed and tested in Shehu et al.7,8,34 to explore the all-atom conformational space around a given conformation (details in Supplemental Material).
Implementation Details
All simulations have been performed on 2.2 GHz AMD64 Opteron CPUs. The MC-SA lowers temperature k = 14 times. An MC simulation of 2000 cycles takes between 1-4 hours on a single CPU for the protein sequences considered in this work. At each temperature and from each of the ns = 5 seed conformations, m = 11 MC simulations are launched (1 unconfined and 10 with different Rggoal values). Implementations with ns > 5 seeds have been considered for the broader exploration that would be obtained. The number of generated conformations, however, becomes too large for storage and time demands, while the results remain consistent with those presented here.
In total 5×11 = 55 MC simulations are run (in parallel) at each temperature on different CPUs. A total of 14×55×2000 = 1, 540, 000 coarse-grained conformations are generated in 14-56 hours on 55 CPUs. For the calbindin D9k, CaM, and ADK proteins considered in this study, 45363, 54820, and 48394 conformations, respectively, are selected from the first stage and handed off to the second stage. The second stage selects 29290, 33166, and 29424 all-atom conformations, respectively, that meet the 100 kcal/mol cutoff described above. The PEM exploration around each energy minimum yields on average 2000 low-energy all-atom conformations. The all-atom energy minimizations are the most computational demanding in PEM, bringing the total time of the second stage to 2-4 weeks on 50 CPUs for the results presented here.
Results
We present results obtained from the application of MuSE to three increasingly long proteins that are known to undergo large-scale functional motions. We first briefly describe the protein systems chosen for this study and then discuss the results obtained for each of them.
Calbindin D9k
The first protein selected for our study is the 76-aa sequence of calbindin D9k, a protein that transports Ca2+, Mg2+, and Mn2+ ions.35,36 Calbindin D9k is an EF-hand protein, a four-helix bundle with two helix-loop-helix EF-hand motifs. The N-terminus EF-hand contains helix H1, metal-binding loop L1, and helix H2. The C-terminus EF-hand contains helix H3, metal-binding loop L2, and helix H4. A linker region links the EF-hands.
Fig. 1(a2) superimposes 160 experimental structures available for calbindin D9k in the PDB. There are differences among these structures in the network of Van der Waals (vdw) contacts and hydrogen bonds. In particular, contacts between helices H1 and H4 and between H2 and H3 are formed with widely varying probabilities, indicating these helices can fluctuate away from each other. A wide range of contact probabilities also indicate that the linker and loops L1 and L2 are highly mobile.
FIGURE 1.
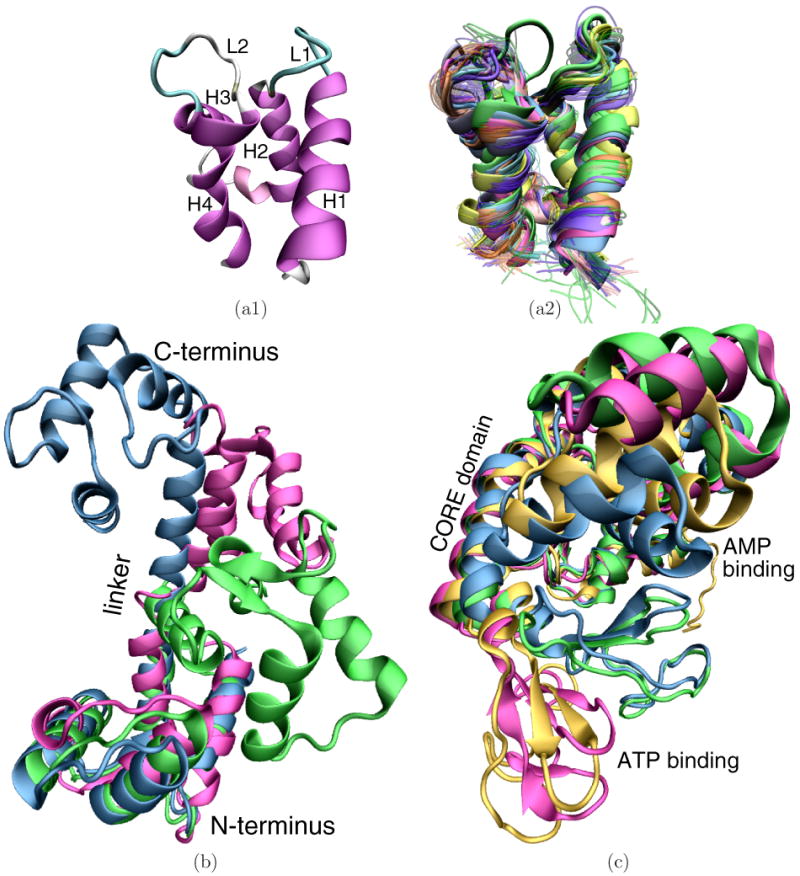
(a1) Helices H1-H4 in magenta and loops L1 and L2 are labeled over the PDB structure 4icb of calbindin D9k. (a2) 160 PDB structures are superimposed over one another. X-ray structures and first structures of NMR ensembles are in opaque. Additional structures of an NMR ensemble are in transparent. (b) CaM PDB structures are superimposed over one another: 1cfd is in magenta, 1cll in blue, and 2f3y is in green. (c) ADK PDB structures are superimposed over one another: 4ake is in magenta, 2ak3 in orange, 1dvr in green, and 2aky in blue.
These 160 structures capture calbindin D9k in different functional states. Comparison of the metal-free (apo)37, Ca2+- 38, Mg2+-, and Mn2+-binding36 states reveals that the internal structures of the helices remain largely unperturbed. On the other hand, L1, L2, and the linker act as hinges to pack the helices more tightly in the Mg2+- and the Mn2+-binding states. It is reasonable to assume that these functional states coexist at equilibrium with different probabilities depending on ion concentrations.39
Calmodulin
The second protein considered is the 144-aa sequence of calmodulin (CaM), an EF-hand protein that binds calcium and regulates over 100 target proteins, such as kinases, phosphodiesterases, calcium pumps, and motility proteins.40-42 CaM resembles a dumbbell structure where the terminal domains are linked through a flexible α-helix. The termini are in a trans orientation from each other on either side of the central linker.
At least three functional states of CaM have been observed in experiment. Differences among these states are mostly due to a partial unfolding around residue 77 in the central α-helix linker. Further bending of the linker around this point brings the terminal domains in contact with each other. Fig. 1(b) superimposes three X-ray structures that capture CaM in its main functional states. The apo state, PDB code 1cfd,43 is shown in magenta; the calcium-binding state, PDB code 1cll,44,45 is shown in blue; the collapsed peptide-binding state, PDB code 2f3y,46 is shown in green.
The terminal domains are very similar in structure (least RMSD - lRMSD - between them is 1.0 Å). The central helix is fully formed in the calcium-binding state, partially unfolds in its middle in the apo state, and bends in the collapsed state, bringing the domains in contact. Transitions between the apo and collapsed states have been observed in experiment and simulation.27,47 Collapsed states not (yet) observed in experiment have been reported in a few Molecular Dynamics (MD) studies.48,49
Adenylate Kinase
The third protein considered in this study is the 214-aa sequence of adenylate kinase (ADK), a phosphotransferase enzyme that maintains energy balance in cells by catalyzing the reversible reaction Mg2+ ◦ ATP + AMP ⇔ Mg2+ ◦ ADP + ADP50. The enzyme has a CORE domain and AMP- and ATP-binding domains. The substrate-binding domains undergo large-scale motions to independently bind substrates, giving rise to four functional states: the apo state, where both substrate-binding domains are open, the collapsed state, where both are closed, and two intermediate states, where one of the domains is open and the other closed.
Fig. 1(c) superimposes four X-ray structures of ADK. The structure drawn in magenta, PDB code 4ake,51 shows ADK in its apo state. The collapsed state, PDB code 2aky,52 is shown in blue. The two intermediate states, PDB codes 1dvr53 and 2ak3,54 are respectively shown in orange and green. The AMP-binding domain is open and the ATP-binding domain is closed in 1dvr, while the ATP-binding domain is open and the AMP-binding domain is closed in 2ak3.
Transitions of ADK between the apo and collapsed states have been observed both in experiment and simulation.55-57 While the free energy difference between the apo and collapsed states has been reported to be negligible at room temperature, the two intermediate states of ADK have been associated with higher energies.57 As such, ADK is an ideal system to test the performance of MuSE.
Generation of Conformational Ensembles
The analysis presented here focuses on 29290, 33166, and 29424 lowest-energy all-atom conformations obtained from applying MuSE on calbindin D9k, CaM, and ADK, respectively (details in Materials and Methods). These conformations are projected onto a lower-dimensional space by using the ScIMAP nonlinear dimensionality reduction technique25 (details in Supplemental Material) to extract a few global coordinates that best distinguish among conformations.
The ScIMAP analysis reveals that 2 global coordinates capture more than 70% of the structural variability in the ensemble of conformations of each protein. The low-dimensional landscapes presented below are obtained with 3000 landmarks, 50 nearest neighbors, and using lRMSD for nearest neighbor calculations (as discussed in Supplemental Material). Pseudo free-energy calculations on the low-dimensional landscapes highlight energy minima for each protein. The conformational space around these minima is further explored by using PEM,7,8,34 as described in Materials and Methods.
Three main results emerge from the analysis of the energy landscapes obtained for the three proteins: (i) on calbindin D9k, the two energy minima obtained capture well the difference in packing of EF-hand helices in the various functional states; (ii) on both CaM and ADK, the energy minima are in correspondence to known functional states; (iii) higher-energy ensembles are also observed in our study. Interestingly, these ensembles for CaM have been reported on a few MD studies and may correspond to (yet) unobserved metastable collapsed functional states.
Analysis of Generated Conformational Ensembles of Calbindin D9k
Fig. 2(a) shows the pseudo free-energy landscape of calbindin D9k as a function of the first two global coordinates revealed by ScIMAP for the ensemble of conformations obtained by MuSE. Energy values are color-coded in a red-to-blue spectrum that denotes high-to-low values.
FIGURE 2.
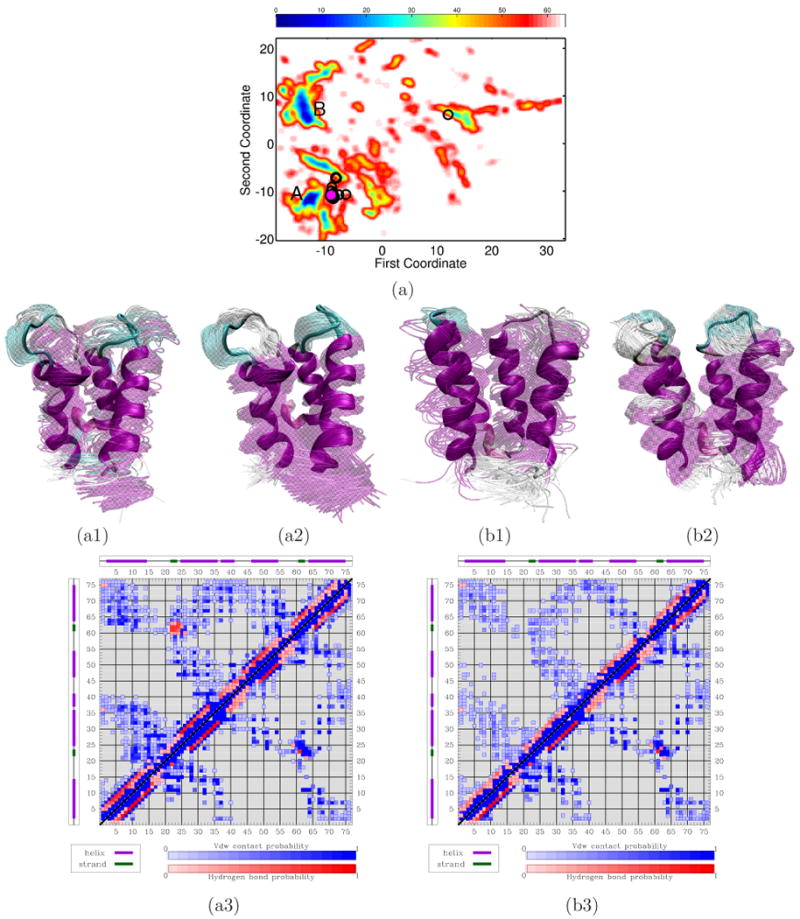
(a) Red-to-blue color spectrum in 2D landscape obtained for calbindin D9k denotes high-to-low energy values. Black circles show projections of PDB structures over the landscape. The projection of PDB structure 4icb is drawn in magenta. The lowest energy minima are labeled A and B. Conformational ensembles corresponding to A and B are shown in (a1) and (b1), respectively. Conformations are superimposed in transparent over lowest-energy one drawn in opaque. (a2) and (b2) show ensembles obtained with PEM from each lowest-energy conformation. (a3) and (b3) show contacts and hydrogen bonds measured over enriched conformational ensembles corresponding to A and B (top half) compared to contacts and hydrogen bonds averaged over the PDB structures (bottom half). Darker shades denote higher probabilities.
The experimental structures of calbindin D9k are projected on the landscape and shown as black circles. The two lowest energy minima are labeled A and B in Fig. 2(a). The experimental structures, when projected on the 2D landscape, cluster around minimum A. The energetic separation between A and B is ∼ 3 kcal/mol. Given unavoidable approximations in empirical energy functions and the approximations used in MuSE, the two minima can be considered energetically equivalent.
The conformational ensembles corresponding to minima A and B are shown in Fig. 2(a1) and 2(b1), respectively. The lowest-energy conformations within each ensemble, shown in opaque in Fig. 2(a1)-(b1), have an lRMSD of 2.36 and 5.14 Å from PDB structure 4icb (Ca2+-binding state), respectively. The lRMSD lowers down to 1.89 and 2.59 Å, respectively, when the Local-Global Alignment (LGA) tool is used.58 The lower values result from the fact that LGA localizes structural differences between two conformations (LGA is used to assess the similarity between predictions and targets in structure prediction.59).
Both ensembles in Fig. 2(a1)-(b1) capture the overall fold of calbindin D9k. The helices are well-formed, whereas the L1 and L2 loops and linker region are very mobile. The main difference between the two ensembles is in the packing of the EF-hand helices: tighter packing is observed in the ensemble in Fig. 2(a1). In particular, the distance between central residues in the L1 and L2 loops has an average of 12.69 Å in the ensemble in Fig. 2(a1) and an average of 14.33 Å in the ensemble in Fig. 2(b1). For comparison, this average is 11.33 Å in PDB structure 4icb. The tighter packing in the ensemble associated with minimum A is in good agreement with what is observed in the Mg2+- and Mn2+-binding states.36 On the other hand, looser packing is observed in the apo and the Ca2+-binding states,37,38 consistent with what is observed in the ensemble associated with minimum B.
The lowest-energy conformations of the ensembles corresponding to minima A and B are used as references to further explore the conformational space through PEM. The PEM-generated ensembles, shown in Fig. 2(a2)-(b2), reproduce the structural features that distinguish minima A and B and corroborate the results obtained from the coarse-grained exploration.
The conformational ensembles associated with minima A and B can be further characterized by considering the network of vdw contacts and hydrogen bonds. Probabilities of contacts and hydrogen bonds formation are measured as Boltzmann averages over each of the ensembles. These probabilities are shown by the color-coded maps in Fig. 2(a3)-(b3). Darker colors denote higher probabilities. For comparison, the bottom halves of these maps show the formation probabilities measured by averaging over the 160 experimental structures of calbindin D9k. Two amino acids are defined in contact if the Euclidean distance between two of their heavy atoms is ≤ 4.5 Å. A hydrogen bond is considered formed if the OH distance is less than 2.4 Å and the maximum NHO angle for the hydrogen bond alignment is 2.44 rad.60
The high similarity between the top and bottom halves of the map in Fig. 2(a3) indicates that the conformational ensemble associated with minimum A captures the main interactions present in the experimental structures. In particular, interactions between loops L1-L2, H1-H2, and H3-H4 occur with high probability. This result confirms the tight packing of the helices that characterizes conformations associated with minimum A. On the other hand, Fig. 2(b3) shows that some of these interactions occur rarely in the ensemble associated with minimum B, as a result of the looser packing that characterizes conformations associated with minimum B.
Analysis of Generated Conformational Ensembles of Calmodulin
The pseudo free-energy landscape of CaM lowest-energy conformations generated by MuSE is shown as a function of the first two global ScIMAP-obtained coordinates in Fig. 3(a). Energy values are color-coded in a red-to-blue spectrum to denote high-to-low values. Three low-energy minima emerge, labeled A, B, and C in Fig. 3(a). The first global coordinate separates A from B and C, whereas the second coordinate separates C from A and B. The projection of PDB structure 1cll (drawn in blue) on this landscape falls near minimum A, that of 1cfd (in magenta) falls near B, and that of 2f3y (in green) falls near C. Energy differences among the minima are < 1 kcal/mol.
FIGURE 3.
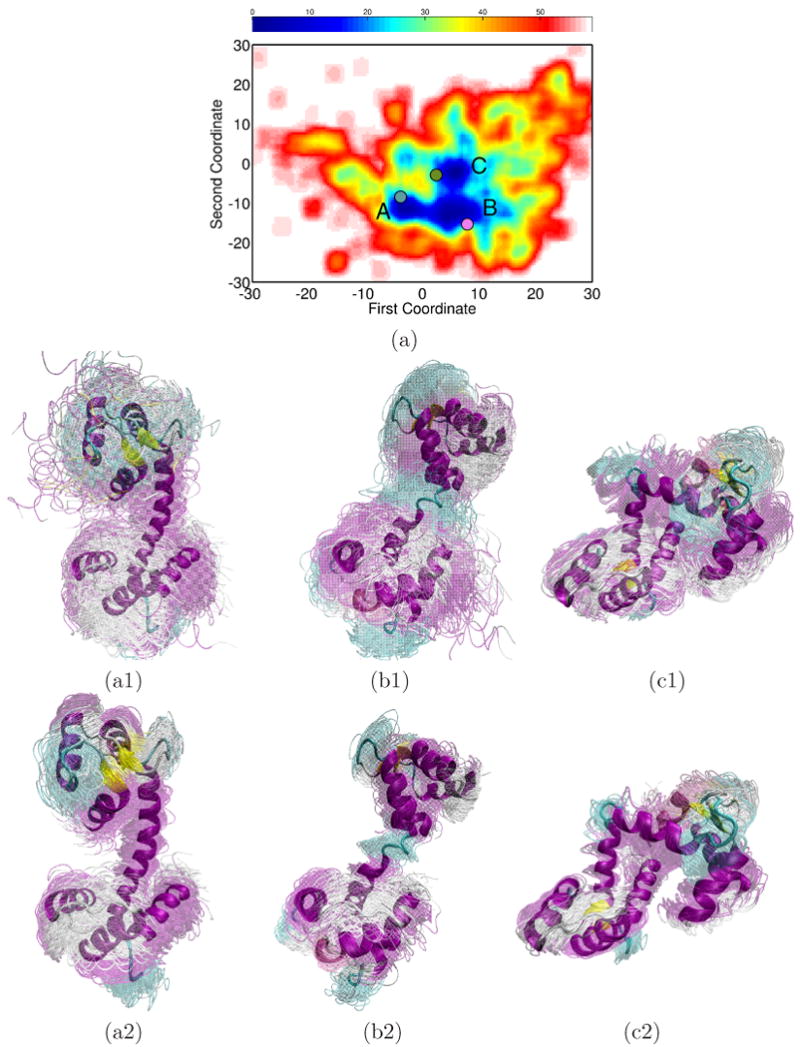
(a) Red-to-blue color spectrum in 2D landscape obtained for CaM denotes high-to-low energy values. The lowest energy minima are labeled A, B, and C. PDB structures are projected on the landscape: 1cfd in magenta, 1cll in blue, and 2f3y in green. (a2), (b2), and (c2) respectively show ensembles corresponding to minima A, B, and C. Conformations are superimposed in transparent over lowest-energy ones drawn in opaque. (a3), (b3), and (c3) show the respective conformational ensembles obtained with PEM from each of the lowest-energy conformations.
The conformational ensembles corresponding to minima A, B, and C are shown in Fig. 3(a1), 3(b1), and 3(c1), respectively. The main feature in the ensemble corresponding to minimum A is a well-formed α-helix in the linker, as in PDB structure 1cll. The helix is partially unfolded in the ensemble corresponding to minimum B, as in PDB structure 1cfd. The linker bends further in the ensemble corresponding to minimum C, as in PDB structure 2f3y. The three ensembles show that the terminal domains exhibit some mobility while largely preserving their secondary structures.
The lowest-energy conformations in ensembles A, B, and C are shown in opaque in Fig. 3(a1)-(b1). These conformations have LGA lRMSDs of 2.572, 2.201, and 2.792 Å from PDB structures 1cll, 1cfd, and 2f3y, respectively. The lowest-energy conformations are used as references to further search in all-atom detail the conformational space around the minima. The PEM-generated ensembles, shown in Fig. 3(a3)-(b3), reproduce well the structural differences among the minima and further support the conformational diversity captured from the coarse-grained exploration.
Fig. 3(a) shows that minimum B is broader than A and C. The corresponding conformational ensemble in Fig. 3(b1) provides an explanation: the partial unfolding of the helix linker in this ensemble allows access to a large configurational space. Fig. 3(a) also shows that minima A, B, and C are not isolated from one another. Conformations bridging A and B exhibit the helix linker gradually unfolding in its middle, whereas conformations bridging B and C further bend the linker. The conformations bridging the minima may provide transitions between the three main functional states of CaM. Conformations mediating between the calcium-binding and collapsed states have been observed in 20-ns MD simulations.48
In addition, inspection of MuSE-obtained conformations reveals higher-energy collapsed ensembles not (yet) observed in experiment (shown in Supplemental Material). Similar collapsed structures have been observed in MD simulations when CaM is depleted of a calcium ion.49
Formation probabilities of vdw contacts and hydrogen bonds are measured over each ensemble associated with the minima and are shown by color-coded maps in Fig. 4(a3)-(c3). The bottom halves of the maps show contacts and hydrogen bonds measured over PDB structures 1cll, 1cfd, and 2f3y, respectively. Darker colors denote higher probabilities. The maps associated with the ensembles corresponding to minima A, B, and C largely reproduce those of PDB structures 1cll, 1cfd, and 2f3y, respectively. Fig. 4(a3) shows additional rare interactions between the terminal domains that arise as the domains move closer to a linker that bends slightly without unfolding in minimum A. Similar interactions are present in Fig. 4(b3), as the linker unfolds in minimum B. Fig. 4(c3) shows that this interdomain coupling becomes more prevalent as the linker bends further in minimum C. Such coupling has been observed in MD studies.48
FIGURE 4.

The top halves of the maps in (a3), (b3), and (c3) show contact and hydrogen-bond formation probabilities measured over the conformational ensembles associated with minima A, B, and C. The bottom halves of these maps show contacts and hydrogen bonds in PDB structure 1cll in (a3), 1cfd in (b3), and 2f3y in (c3). Darker shades denote higher probabilities.
Analysis of Generated Conformational Ensembles of Adenylate Kinase
Fig. 5(a) shows the pseudo free-energy landscape associated with MuSE-generated ADK conformations as a function of the two global coordinates obtained from ScIMAP. Color-coding energy values in a red-to-blue spectrum that denotes high-to-low values reveals two energy minima, labeled A and B in Fig. 5(a). The energetic difference between the minima is ∼ 1.3 kcal/mol.
FIGURE 5.
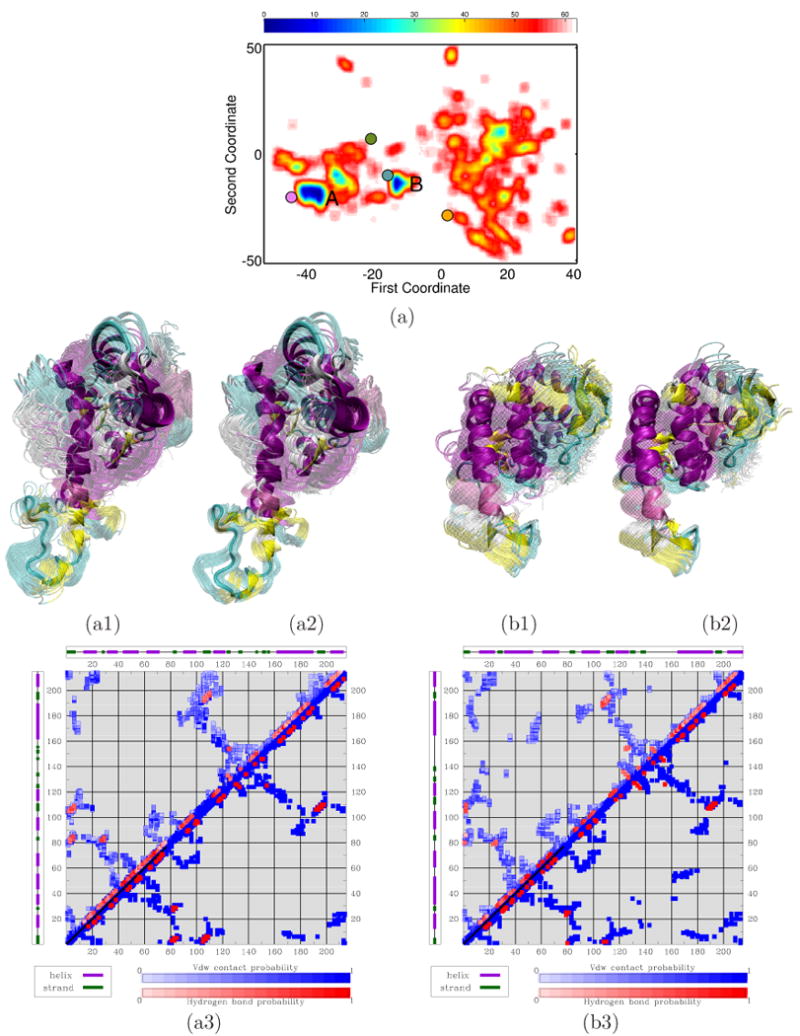
(a) Red-to-blue color spectrum in 2D landscape obtained for ADK denotes high-to-low energy values. The lowest energy minima are labeled A and B. PDB structures are projected on the landscape: 4ake in magenta, 2ak3 in orange, 1dvr in green, and 2aky in blue. (a1) and (b1) respectively show the conformational ensembles corresponding to A and B. Conformations are superimposed in transparent over lowest-energy ones drawn in opaque. (a2) and (b2) show conformational ensembles obtained with PEM from each lowest-energy conformation. (a3) and (b3) show contacts and hydrogen bonds measured over enriched conformational ensembles corresponding to A and B (top half). The bottom halves show contacts and hydrogen bonds in PDB structure 4ake in (a3) and 2aky in (b3). Darker shades denote higher probabilities.
The four X-ray structures of ADK that capture this protein's functional states are projected and drawn on the landscape in Fig. 5(a) in different colors: the projection of PDB structure 4ake is shown in magenta, 1dvr is in orange, 2ak3 is in green, and 2aky is in blue. Fig. 5(a) shows that, when projected on the pseudo free-energy landscape, 4ake, which captures ADK in its apo state, falls near minimum A, and 2aky, which captures the enzyme in its collapsed state, falls near minimum B.
The conformational ensembles corresponding to minima A and B are shown in Fig. 5(a1) and 5(b1), respectively. The main features in the ensemble in Fig. 5(a1) are open AMP- and ATP-binding domains, as in 4ake. Both domains are closed in the ensemble in Fig. 5(b1), as in 2aky. The lowest-energy conformations in each ensemble, shown in opaque in Fig. 5(a1)-(b1), are within 2.95 and 3.27 Å LGA lRMSD from PDB structures 4ake and 2aky, respectively.
The lowest-energy conformations in each minimum are used as references for PEM to further explore the conformational space around A and B. The obtained ensembles, shown in Fig. 5(a2)-(b2), reproduce the apo and collapsed states of ADK, further supporting the structural features associated with the predicted minima. Additional analysis is provided by considering the network of vdw contacts and hydrogen bonds. Fig. 5(a3) and 5(b3) juxtapose formation probabilities of contacts and hydrogen bonds measured over the ensembles associated with minima A and B to contacts and hydrogen bonds in PDB structures 4ake and 2aky. The maps associated with the conformational ensembles respectively reproduce the maps associated with the PDB structures.
The intermediate functional states of ADK, where one terminal domain is open and the other closed, are not obtained as energy minima. These intermediate states are associated with energy barriers in the transition between the apo and collapsed states.57 The higher energies associated with these intermediate states disqualify conformations representative of these states from being selected for further exploration in MuSE. Instead, the lower-energy apo and collapsed states of ADK prevail in the landscape offered by MuSE as relevant at equilibrium. Folding simulations like the one in57 could be employed to launch MD trajectories and capture the intermediate states as ADK transitions between the apo and collapsed states obtained by MuSE.
Discussion and Conclusion
The application of a multiscale strategy to explore the conformational space reproduces well the known functional states of the three considered proteins. On calbindin D9k, the obtained free energy minima capture the variation in the packing of EF-hand helices. One minimum is associated with a tighter packing, as also observed in the Mg2+- and the Mn2+-binding states. The other minimum shows a looser packing, consistent with the apo and Ca2+-binding states. On CaM, the three obtained free energy minima reproduce the three documented functional states. The two free energy minima obtained for ADK capture well the apo and collapsed states of this protein.
Intermediate functional states are not directly observed for ADK. The higher energy of these states probably discards their conformations in the first stage of MuSE. However, by capturing the apo and collapsed states, MuSE could be further enhanced by simulation studies as in Lu and Wang.57 MD trajectories could provide details on states mediating the transition of a protein between the main functional states associated with the free energy minima obtained with MuSE.
The selection of seed conformations, the multiscale search for these seeds, the parallel simulations launched from selected seeds in the first stage, and the coarse-grained energy function employed during this stage (see Materials and Methods for details) are all critical components that together guide the exploration to relevant regions in the all-atom conformational space. It is reasonable, however, to expect the exploration to reach a scalability bottleneck when considering longer protein chains (≥ 300 aas). High-dimensional conformational spaces associated with longer proteins than the ones considered in this work may require employing different seed selection strategies, loosening some of the energetic cutoffs, and possibly employing coarser representations than the one used in the first stage. Realistic coarse-grained energy functions need to be devised for even coarser representations. Alternatively, multiple levels of coarse-graining could be employed for the exploration of a larger high-dimensional space.
As already mentioned above, as an exploration-based approach, MuSE may contain internal biases that are not trivial to disentangle and deconvolute in the final ensemble statistics. The selection of seeds presents a potentially biasing factor in the exploration towards specific conformational subspaces. In addition, even if the specific seed selection strategy resulted in a uniform sampling of the equilibrium conformational space, other approximations can produce different biases. For example, switching from the coarse-grained AMW model to the all-atom model introduces another potential bias. For this reason, the free energies estimated on the final ensembles are referred to as pseudo free energies.
Analysis of the conformational ensembles obtained in this work reveals additional higher-energy ensembles of collapsed conformations. Similar collapsed conformations have been reported, for instance, for CaM, in MD studies but not (yet) in experiment. One cannot rule out, however, that the presence of these conformations may be due to the approximations present in the empirical energy functions or approximations used in the method. Multiple energy functions and representations can be employed in the future to improve predictions obtained by the method.
A different explanation for the presence of additional conformational ensembles may be offered by considering the difference between thermodynamics and kinetics. MuSE is thermodynamic in nature. The estimation of timescales to access different conformational ensembles is an obvious direction for future work that can improve accuracy and strengthen the connection with experiment.
The MuSE method presented here is a promising first step towards obtaining a picture of the conformational diversity of proteins at equilibrium. The results obtained by MuSE can serve as a robust starting point to characterize functional motions in proteins, either in combination with more refined computational methods, or with experiments. Obviously, the fact that MuSE overall correctly captures the diverse equilibrium conformational states in the three proteins considered here is not a guarantee that the method will have similar success in general, on different proteins. The application and testing of the method on a broader range of protein systems will help identify weaknesses and shortcomings, and better characterize the statistical biases introduced by the multiscale search. These issues, as well as improvements on efficiency and scalability, are part of our ongoing and future research.
Supplementary Material
Acknowledgments
Work is supported by NSF (CC Career grant No. CHE-0349303 and LEK and CC grant No. CCF-0523908), NIH (LEK grant No. GM078988), Welch Foundation (CC Norman Hackermann Young Investigator award and grant No. C-1570), and Sloan Foundation (LEK). Equipment is funded by NSF grant No. CNS-0421109 and grant No. CNS-0454333 in partnership between Rice University, AMD and Cray. AS is partly supported by a Nanobiology Training Program Fellowship of the W. M. Keck Center for Computational and Structural Biology of the Gulf Coast Consortia (NIH grant No.1 R90 DK71504-01).
References
- 1.Schnell JR, Dyson HJ, Wright PE. Structure, dynamics, and catalytic function of dihydrofolate reductase. Annu Rev Biophys and Biomolec Struct. 2004;33(1):119–140. doi: 10.1146/annurev.biophys.33.110502.133613. [DOI] [PubMed] [Google Scholar]
- 2.Eisenmesser EZ, Millet O, Labeikovsky W, Korzhnev DM, Wolf-Watz M, Bosco DA, Skalicky JJ, Kay LE, Kern D. Intrinsic dynamics of an enzyme underlies catalysis. Nature. 2005;438(7064):117–121. doi: 10.1038/nature04105. [DOI] [PubMed] [Google Scholar]
- 3.Palmer GAI. NMR probes of molecular dynamics: Overview and comparison with other techniques. Annu Rev Biophys and Biomolec Struct. 2001;30(1):129–155. doi: 10.1146/annurev.biophys.30.1.129. [DOI] [PubMed] [Google Scholar]
- 4.Czaplewski C, Stanislaw O, Liwo A, Scheraga HA. Prediction of the structures of proteins with the UNRES force field, including dynamic formation and breaking of disulfide bonds. Protein Eng Des Sel. 2004;17(1):29–36. doi: 10.1093/protein/gzh003. [DOI] [PubMed] [Google Scholar]
- 5.Karplus M, Kuriyan J. Molecular dynamics and protein function. Proc Natl Acad Sci USA. 2005;102(19):6679–6685. doi: 10.1073/pnas.0408930102. [DOI] [PMC free article] [PubMed] [Google Scholar]
- 6.Lindorff-Larsen K, Best RB, DePristo MA, Dobson CM, Vendruscolo M. Simultaneous determination of protein structure and dynamics. Nature. 2005;433(7022):128–132. doi: 10.1038/nature03199. [DOI] [PubMed] [Google Scholar]
- 7.Shehu A, Clementi C, Kavraki LE. Modeling protein conformational ensembles: From missing loops to equilibrium fluctuations. Proteins: Struct Funct Bioinf. 2006;65(1):164–179. doi: 10.1002/prot.21060. [DOI] [PubMed] [Google Scholar]
- 8.Shehu A, Kavraki LE, Clementi C. On the characterization of protein native state ensembles. Biophys J. 2007;92(5):1503–1511. doi: 10.1529/biophysj.106.094409. [DOI] [PMC free article] [PubMed] [Google Scholar]
- 9.Doruker P, Jernigan RL, Bahar I. Dynamics of large proteins through hierarchical levels of coarse-grained structures. J Comput Chem. 2002;23(1):119–127. doi: 10.1002/jcc.1160. [DOI] [PubMed] [Google Scholar]
- 10.Kevrekidis IG, Gear CW, Hummer G. Equation-free: The computer-aided analysis of complex multiscale systems. AIChE J. 2004;50(7):1346–1355. [Google Scholar]
- 11.Matysiak S, Clementi C. Optimal combination of theory and experiment for the characterization of the protein folding landscape of S6: How far can a minimalist model go? J Mol Biol. 2004;343(8):235–248. doi: 10.1016/j.jmb.2004.08.006. [DOI] [PubMed] [Google Scholar]
- 12.Papoian GA, Ulander J, Eastwood MP, Luthey-Schulten Z, Wolynes PG. Water in protein structure prediction. Proc Natl Acad Sci USA. 2004;101(10):3352–3357. doi: 10.1073/pnas.0307851100. [DOI] [PMC free article] [PubMed] [Google Scholar]
- 13.Das P, Matysiak S, Clementi C. Balancing energy and entropy: A minimalist model for the characterization of protein folding landscapes. Proc Natl Acad Sci USA. 2005;102(29):10141–10146. doi: 10.1073/pnas.0409471102. [DOI] [PMC free article] [PubMed] [Google Scholar]
- 14.Izvekov S, Voth GA. A multiscale coarse-graining method for biomolecular systems. J Phys Chem Lett B. 2005;109(7):2469–2473. doi: 10.1021/jp044629q. [DOI] [PubMed] [Google Scholar]
- 15.Liwo A, Khalili M, Scheraga HA. Ab initio simulations of protein-folding pathways by molecular dynamics with the united-residue model of polypeptied chains. Proc Natl Acad Sci USA. 2005;102(7):2362–2367. doi: 10.1073/pnas.0408885102. [DOI] [PMC free article] [PubMed] [Google Scholar]
- 16.Tama F, Brooks CLI. Symmetry, form, and shape: Guiding principles for robustness in macromolecular machines. Annu Rev Biophys and Biomolec Struct. 2006;35:115–133. doi: 10.1146/annurev.biophys.35.040405.102010. [DOI] [PubMed] [Google Scholar]
- 17.Matysiak S, Clementi C. Minimalist protein model as a diagnostic tool for misfolding and aggregation. J Mol Biol. 2006;363(1):297–308. doi: 10.1016/j.jmb.2006.07.088. [DOI] [PubMed] [Google Scholar]
- 18.Tozzini V, Trylska J, Chang C, McCammon JA. Flap opening dynamics in HIV-1 protease explored with a coarse-grained model. J Struct Bio. 2007;157(3):606–615. doi: 10.1016/j.jsb.2006.08.005. [DOI] [PubMed] [Google Scholar]
- 19.Clementi C. Coarse-grained models of protein folding: Toy models of predictive tools? Curr Opinion Struct Biol. 2008;18(1):10–15. doi: 10.1016/j.sbi.2007.10.005. [DOI] [PubMed] [Google Scholar]
- 20.Bonneau R, Baker D. Ab initio protein structure prediction: progress and prospects. Annu Rev Biophys and Biomolec Struct. 2001;30(1):173–189. doi: 10.1146/annurev.biophys.30.1.173. [DOI] [PubMed] [Google Scholar]
- 21.Chikenji G, Fujitsuka Y, Takada S. A reversible fragment assembly method for de novo protein structure prediction. J Chem Phys. 2003;119(13):6895–6903. [Google Scholar]
- 22.Gong H, Fleming PJ, Rose GD. Building native protein conformation from highly approximate backbone torsion angles. Proc Natl Acad Sci USA. 2005;102(45):16227–16232. doi: 10.1073/pnas.0508415102. [DOI] [PMC free article] [PubMed] [Google Scholar]
- 23.Bradley P, Misura KMS, Baker D. Toward high-resolution de novo structure prediction for small proteins. Science. 2005;309(5742):1868–1871. doi: 10.1126/science.1113801. [DOI] [PubMed] [Google Scholar]
- 24.Colubri A, Jha AK, Shen MY, Sali A, Berry RS, Sosnick TR, Freed KF. Minimalist representations and the importance of nearest neighbor effects in protein folding simulations. J Mol Biol. 2006;363(4):835–857. doi: 10.1016/j.jmb.2006.08.035. [DOI] [PubMed] [Google Scholar]
- 25.Das P, Moll M, Stamati H, Kavraki LE, Clementi C. Low-dimensional free energy landscapes of protein folding reactions by nonlinear dimensionality reduction. Proc Natl Acad Sci USA. 2006;103(26):9885–9890. doi: 10.1073/pnas.0603553103. [DOI] [PMC free article] [PubMed] [Google Scholar]
- 26.Okazaki K, Koga N, Takada S, Onuchic JN, Wolynes PG. Multiple-basin energy landscapes for large amplitude conformational motions of proteins: Structure-based molecular dynamics simulations. Proc Natl Acad Sci USA. 2006;103(32):11844–11849. doi: 10.1073/pnas.0604375103. [DOI] [PMC free article] [PubMed] [Google Scholar]
- 27.Zhang BW, Jasnow D, Zuckermann DM. Efficient and verified simulation of a path ensemble for conformational change in a united-residue model of calmodulin. Proc Natl Acad Sci USA. 2007;104(46):18043–18048. doi: 10.1073/pnas.0706349104. [DOI] [PMC free article] [PubMed] [Google Scholar]
- 28.Heath AP, Kavraki LE, Clementi C. From coarse-grain to all-atom: Towards multiscale analysis of protein landscapes. Proteins: Struct Funct Bioinf. 2007;68(3):646–661. doi: 10.1002/prot.21371. [DOI] [PubMed] [Google Scholar]
- 29.Milik M, Kolinski A, Skolnick J. Algorithm for rapid reconstruction of protein backbone from alpha carbon coordinates. J Comput Chem. 1997;18(1):80–85. [Google Scholar]
- 30.Duan Y, Wu C, Chowdhury S, Lee MC, Xiong GM, Zhang W, Yang R, Cieplak P, Luo R, Lee T, Caldwell J, Wang JM, Kollman P. A point-charge force field for molecular mechanics simulations of proteins based on condensed-phase quantum mechanical calculations. J Comput Chem. 2003;24(16):1999–2012. doi: 10.1002/jcc.10349. [DOI] [PubMed] [Google Scholar]
- 31.Still WC, Tempczyk A, Hawley RC, Hendrickson T. Semianalytical treatment of solvation for molecularmechanics and dynamics. J Am Chem Soc. 1990;112(16):6127–6129. [Google Scholar]
- 32.Plaku E, Stamati H, Clementi C, Kavraki LE. Fast and reliable analysis of molecular motions using proximity relations and dimensionality reduction. Proteins: Struct Funct Bioinf. 2007;67(4):897–907. doi: 10.1002/prot.21337. [DOI] [PubMed] [Google Scholar]
- 33.Shehu A, Kavraki LE, Clementi C. Unfolding the fold of cyclic cysteine-rich peptides. Protein Sci. 2008;17(3):482–493. doi: 10.1110/ps.073142708. [DOI] [PMC free article] [PubMed] [Google Scholar]
- 34.Shehu A, Clementi C, Kavraki LE. Sampling conformation space to model equilibrium fluctuations in proteins. Algorithmica. 2007;48(4):303–327. [Google Scholar]
- 35.Christakos S, Gabrielides C, Rhoten WB. Vitamin D-dependent calcium binding proteins: Chemistry, distribution, functional considerations, and molecular biology. Endocr Rev. 1989;10(1):3–26. doi: 10.1210/edrv-10-1-3. [DOI] [PubMed] [Google Scholar]
- 36.Andersson M, Malmendal SL, Linse S, Ivrasson I, Forsèn S, Svensson A. Structural basis for the negative allostery between Ca2+- and Mg2+-binding in the intracellular Ca2+-receptor calbindin D9k. Protein Sci. 1997;6(6):1139–1147. doi: 10.1002/pro.5560060602. [DOI] [PMC free article] [PubMed] [Google Scholar]
- 37.Skelton NJ, Kördel J, Chazin WJ. Determination of the solution structure of apo calbindin D9k by NMR spectroscopy. J Mol Biol. 1995;249(2):441–462. doi: 10.1006/jmbi.1995.0308. [DOI] [PubMed] [Google Scholar]
- 38.Svensson LA, Thulin E, Forsèn S. Proline cis-trans isomers in calbindin D9k observed by X-ray crystallography. J Mol Biol. 1992;223(3):601–606. doi: 10.1016/0022-2836(92)90976-q. [DOI] [PubMed] [Google Scholar]
- 39.Linse S, Jonsson B, Chazin WJ. The effect of protein concentration on ion binding. Proc Natl Acad Sci USA. 1995;92(11):4748–4752. doi: 10.1073/pnas.92.11.4748. [DOI] [PMC free article] [PubMed] [Google Scholar]
- 40.Manalan AS, Klee C. Calmodulin. Advan Cyclic Nucleot Protein Phosphoryl Res. 1984;18:227–278. [PubMed] [Google Scholar]
- 41.Means AR. Molecular mechanisms of action of calmodulin. Recent Prog Horm Res. 1988;44:223–262. doi: 10.1016/b978-0-12-571144-9.50012-0. [DOI] [PubMed] [Google Scholar]
- 42.O'Neal KT, DeGrado WF. How calmodulin binds its targets : sequence independent recognition of amphiphilic α-helices. Trends Biochem Sci. 1990;15(2):59–64. doi: 10.1016/0968-0004(90)90177-d. [DOI] [PubMed] [Google Scholar]
- 43.Kuboniwa H, Tjandra N, Grzesiek S, Ren H, Klee CB, Bax A. Solution structure of calcium-free calmodulin. Nat Struct Biol. 1995;2(9):768–776. doi: 10.1038/nsb0995-768. [DOI] [PubMed] [Google Scholar]
- 44.Babu YS, Bugg CE, Cook WJ. Structure of calmodulin refined at 2.2 Å resolution. J Mol Biol. 1988;204(1):191–204. doi: 10.1016/0022-2836(88)90608-0. [DOI] [PubMed] [Google Scholar]
- 45.Chattopadhyaya R, Meador WE, Means AR, Quiocho FA. Calmodulin structure refined at 1.7 Å resolution. J Mol Biol. 1992;228(4):1177–1192. doi: 10.1016/0022-2836(92)90324-d. [DOI] [PubMed] [Google Scholar]
- 46.Fallon JL, Halling DB, Hamilton SL, Quiocho FA. Structure of calmodulin bound to the hydrophobic IQ domain of the cardiac Ca(v)1.2 calcium channel. Structure. 2005;13(12):1881–1886. doi: 10.1016/j.str.2005.09.021. [DOI] [PubMed] [Google Scholar]
- 47.Finn BE, Evenäs J, Drakenberg T, Waltho JP, Thulin E, Forsèn S. Calcium-induced structural changes and domain autonomy in calmodulin. Nat Struct Biol. 1995;2(9):777–783. doi: 10.1038/nsb0995-777. [DOI] [PubMed] [Google Scholar]
- 48.Shepherd CM, Vogel HJ. A molecular dynamics study of the Ca2+-Calmodulin: Evidence of interdomain coupling and structural collapse on the nanosecond timescale. Biophys J. 2004;87(2):780–791. doi: 10.1529/biophysj.103.033266. [DOI] [PMC free article] [PubMed] [Google Scholar]
- 49.Project E, Friedman R, Nachliel E, Gutman M. A molecular dynamics study of the effect of Ca2+ removal on calmodulin structure. Biophys J. 2006;90(11):3842–3850. doi: 10.1529/biophysj.105.077792. [DOI] [PMC free article] [PubMed] [Google Scholar]
- 50.Rhoads DG, Lowenstein JM. Initial velocity and equilibrium kinetics of myokinase. J Biol Chem. 1968;243(14):3963–3972. [PubMed] [Google Scholar]
- 51.Muüller CW, Schlauderer GJ, Reinstein J, Schulz GE. Adenylate kinase motions during catalysis: an energetic counterweight balancing substrate binding. Structure. 1996;4(2):147–156. doi: 10.1016/s0969-2126(96)00018-4. [DOI] [PubMed] [Google Scholar]
- 52.Abele U, Schulz GE. High-resolution structures of adenylate kinase from yeast ligated with inhibitor Ap5A, showing the pathway of phosphoryl transfer. Protein Sci. 1995;4(7):1262–1271. doi: 10.1002/pro.5560040702. [DOI] [PMC free article] [PubMed] [Google Scholar]
- 53.Schlauderer GJ, Proba K, Schulz GE. Structure of a mutant adenylate kinase ligated with an ATP analogue showing domain closure over ATP. J Mol Biol. 1996;256(2):223–227. doi: 10.1006/jmbi.1996.0080. [DOI] [PubMed] [Google Scholar]
- 54.Diederichs K, Schulz GE. The refined structure of the complex between adenylate kinase from beef heart mitochondrial matrix and its substrate AMP at 1.85 Å resolution. J Mol Biol. 1991;217(3):541–549. doi: 10.1016/0022-2836(91)90756-v. [DOI] [PubMed] [Google Scholar]
- 55.Ådén J, Wolf-Watz M. NMR identification of transient complexes critical to adenylate kinase catalysis. J Am Chem Soc. 2007;129(45):14003–14012. doi: 10.1021/ja075055g. [DOI] [PubMed] [Google Scholar]
- 56.Snow C, Qi G, Hayward S. Essential dynamics sampling study of adenylate kinase: comparison to citrate syynthase and implication for the hinge and shear mechanisms of domain motions. Proteins: Struct Funct Bioinf. 2007;67(2):325–337. doi: 10.1002/prot.21280. [DOI] [PubMed] [Google Scholar]
- 57.Lu Q, Wang J. Single molecule conformational dynamics of adenylate kinase: energy landscape, structural correlations, and transition state ensembles. J Am Chem Soc. 2008;130(14):4772–4783. doi: 10.1021/ja0780481. [DOI] [PubMed] [Google Scholar]
- 58.Zemla A. LGA: a method for finding 3D similarities in protein structures. Nucl Acids Res. 2003;31(13):3370–3374. doi: 10.1093/nar/gkg571. http://as2ts.llnl.gov/AS2TS/LGA/lga.html. [DOI] [PMC free article] [PubMed]
- 59.Moult J, Fidelis K, Kryshtafovych A, Rost B, Hubbard T, Tramontano A. Critical assessment of methods of protein structure prediction (CASP) round VII. Proteins: Struct Funct Bioinf. 2007;69(S8):3–9. doi: 10.1002/prot.21767. [DOI] [PMC free article] [PubMed] [Google Scholar]
- 60.Niimura N, Bau R. Neutron protein crystallography: beyond the folding structure of biological macromolecules. Acta Crystallogr A. 2008;64(1):12–22. doi: 10.1107/S0108767307043498. [DOI] [PubMed] [Google Scholar]
Associated Data
This section collects any data citations, data availability statements, or supplementary materials included in this article.