Abstract
The signaling mechanisms underlying the effects of angiotensin II in proximal tubules of the kidney are not completely understood. Here we measured signal protein phosphorylation in isolated proximal tubules using pathway-specific proteomic analysis in rats continuously infused with pressor or non-pressor doses of angiotensin II over a 2-week period. Of the 38 phosphoproteins profiled, 14 were significantly altered by the pressor dose. This included increased phosphorylation of the protein kinase C isoenzymes, PKCα and PKCβII, and the glycogen synthase kinases, GSK3α and GSK3β. Phosphorylation of the cAMP-response element binding protein 1 and PKCδ were decreased, whereas PKCε remained unchanged. By contrast, the phosphorylation of only seven proteins was altered by the non-pressor dose, which increased that of PKCα, PKCδ, and GSKα. Phosphorylation of MAP kinases, ERK1/2, was not increased in proximal tubules in vivo by the pressor dose, but was in proximal tubule cells in vitro. Infusion of the pressor dose decreased, whereas the non-pressor dose of angiotensin II increased the phosphorylation of the sodium and hydrogen exchanger 3 (NHE-3) in membrane fractions of proximal tubules. Losartan largely blocked the signaling responses induced by the pressor dose. Thus, PKCα and PKCβII, GSK3α and GSK3β, and cAMP-dependent signaling pathways may have important roles in regulating proximal tubular sodium and fluid transport in Ang II-induced hypertensive rats.
Keywords: angiotensin, blood pressure, cell signaling, hypertension, proximal tubule
Angiotensin II (Ang II) has a critical role in the regulation of sodium and fluid reabsorption in proximal tubules of the kidney in both physiological and diseased states. The evidence supporting the important roles of Ang II in proximal nephrons is quite overwhelming.1–3 In isolated proximal tubule preparations or cultured proximal tubule cells, Ang II stimulates the expression or activities of the sodium and hydrogen exchanger-3 (NHE-3),4,5 the sodium and potassium ATPase (Na +/K +-ATPase),6,7 or the sodium and bicarbonate co-transporter ( ).8,9 In acute in vivo micropuncture or in vitro microperfusion studies, peritubular and intraluminal Ang II infusion induces biphasic transport responses, with picomolar doses of Ang II stimulate sodium transport while nanomolar doses inhibit sodium transport.1,10 Sustained increases of circulating and tissue Ang II levels in proximal tubules in experimental animals, however, are associated with high blood pressure, sodium retention, and tubulointerstitial injury in the kidney.11–13
Signaling mechanisms mediating the physiological or pathophysiological effects of Ang II in proximal tubules of the kidney remain incompletely understood. Our current understanding of Ang II-dependent signaling mechanisms is based primarily on studies in cultured proximal tubule cells or in isolated proximal tubules. In vitro, Ang II activates several heterotrimeric G-proteins including Gq/11, Gs, Gi, G12, and G13.14–16 The activated downstream signaling proteins range from inositol triphosphate, calcium, diacylglycerol, adenylyl cyclase/cAMP, and protein kinase C (PKC) to other receptor and non-receptor tyrosine kinases and serine/threonine kinases, such as the MAP kinase family (ERK, JNK, and p38 MAPK).15,17 However, it is not clear whether similar signaling mechanisms may be replicated in an integrative physiological or pathophysiological setting.
The present study used a novel pathway-specific proteomic approach to study the responses of 38 major signaling phosphoproteins in proximal tubules of the rats treated with 2-week infusion of a pressor or a non-pressor dose of Ang II. Ang II-infused rats were treated with the AT1 receptor blocker losartan to determine the role of AT1 receptors. In order to exclude the contamination of signaling proteins from adjacent glomeruli, blood vessels, or cortical collecting ducts, we isolated fresh proximal tubules specifically from the superficial cortex of the kidney for proteomic analysis of signaling responses to Ang II.
RESULTS
Effects of the pressor dose of Ang II infusion on blood pressure and renal excretory function
Infusion of Ang II (60 ng/min, s.c.) for 2 weeks markedly increased systolic blood pressure in Ang II-infused rats (Table 1; P<0.01). Compared with control, Ang II moderately increased urinary water and sodium excretion and decreased urine osmolality. Urinary albumin-to-creatinine ratio was increased by threefold in Ang II-infused rats. These responses to the pressor dose of Ang II infusion were normalized by losartan treatment.
Table 1.
Effects of the pressor dose of Ang II infusion and concurrent losartan treatment for 2 weeks on body and kidney weights, systolic blood pressure, 24 h urinary excretion of water, and electrolytes in Ang II-infused rats
| Response | Control | Ang II | Ang II+losartan |
|---|---|---|---|
| Body weight, g | 322±8 | 316±7 | 300±5 |
| Kidney weight, g | 2.5±0.3 | 2.4±0.3 | 2.4±0.2 |
| Kidney weight/body weight ratio, ×100 | 0.76±0.02 | 0.79±0.03 | 0.79±0.02 |
| SBP, mm Hg | 118±5 | 175±7** | 126±8†† |
| Urine, ml/24 h | 12.7±0.5 | 20.1±0.6** | 13.5±0.72†† |
| UNaV, mmol/24 h | 1.67±0.05 | 2.17±0.09* | 1.64±0.09†† |
| UKV, mmol/24 h | 2.32±0.16 | 2.61±0.22 | 2.78±0.31 |
| Urine osmolality, mOsm/kg H2O | 1535±28 | 943±26* | 1162±32*† |
| Urine albumin/creatinine ratio, mg/g | 21.6±2.8 | 79.1±11.9** | 26.8±5.8†† |
Abbreviations: Ang, angiotensin; SBP, systolic blood pressure; UKV, urinary potassium excretion; UNaV, urinary sodium excretion.
P<0.05 or
P<0.01 versus control.
P<0.05 or
P<0.01 versus Ang II-infused hypertensive rats.
Effects of the pressor dose of Ang II infusion on circulating and intrarenal Ang II
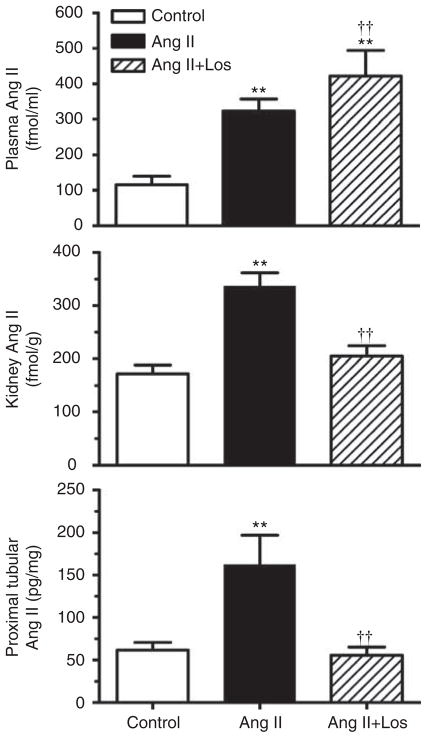
Infusion of the pressor dose of Ang II for 2 weeks significantly increased plasma and whole kidney Ang II levels in rats (Figure 1). Plasma Ang II was increased by 2.8-fold in Ang II-infused rats (control: 115.5±24.1 fmol/ml versus Ang II-infused: 323±34.4 fmol/ml; P<0.01). Concurrent losartan treatment in Ang II-infused rats further elevated plasma Ang II levels above those of control and Ang II-infused rats because of AT1 receptor occupancy by losartan (421.6±32.3 fmol/ml; P<0.01). Kidney Ang II was increased by twofold (control: 172.6±16.2 pg/g versus Ang II-infused: 336.5±25.7 pg/g kidney weight; P<0.01), which was blocked by losartan in Ang II-infused rats (205.1±19.3 pg/g kidney weight, Figure 1). Proximal tubular Ang II was also increased by 2.6-fold (control: 61.7±8.9 versus Ang II-infused: 162.3± 34.9 pg/mg proteins; P<0.01), which was decreased by losartan in Ang II-infused rats (55.7±9.7 pg/mg proteins, P<0.01).
Figure 1. Effects of 2-week infusion of the pressor dose of angiotensin (Ang) II and concurrent losartan (los) treatment on plasma (top), whole kidney (middle), and proximal tubule Ang II levels in rats (bottom).
Proximal tubule Ang II is expressed as pg per mg protein, not as wet weight. **P<0.01, compared with controls; ††P<0.01, compared with angiotensin (Ang) II-infused hypertensive rats.
Effects of the pressor dose of Ang II infusion and losartan treatment on pathway-specific signaling phosphoproteins
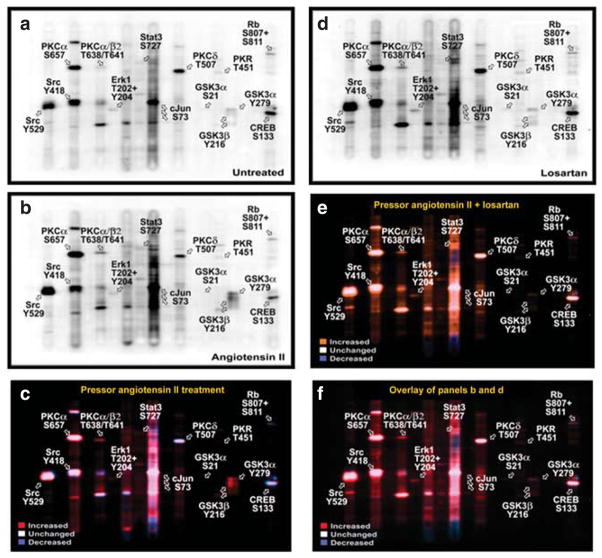
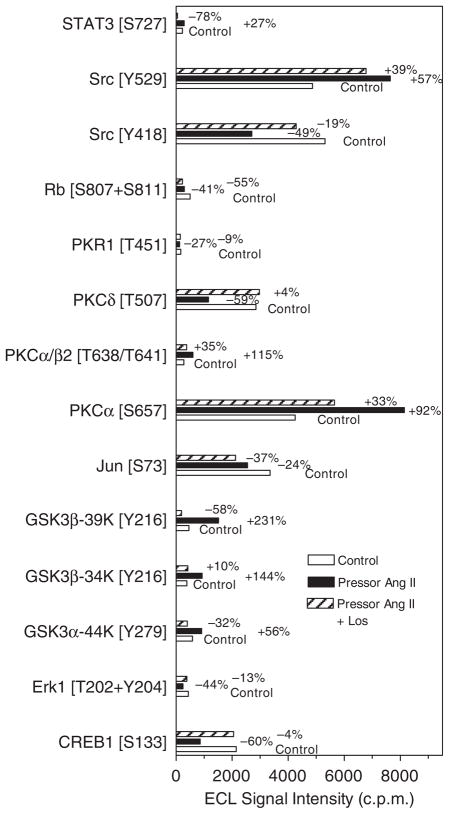
Figure 2 shows multi-immunoblots of 38 signaling phosphoproteins in proximal tubules of control (Figure 2a), the pressor dose of Ang II-infused (Figure 2b), and losartan-treated Ang II-infused rats (Figure 2d). Figure 2c shows the colored overlay of multi-immunoblots of 38 phosphoproteins in proximal tubules of control (Figure 2a) and Ang II-infused rats (Figure 2b). Figure 2e is the colored overlay of control (Figure 2a) and losartan-treated, Ang II-infused rats (Figure 2d), whereas Figure 2f is the colored overlay of Ang II-infused (Figure 2b) and losartan-treated, Ang II-infused rats (Figure 2d). The Kinetwork multi-immunoblot proteomic analyses identified (Kinexus Bioinformatics, Vancouver, Canada) 14 signaling phosphoproteins that were altered by >25% in proximal tubules of the Ang II-infused rats for 2 weeks (Figure 3). Phosphoproteins that were not altered by Ang II are listed in Table 2. Losartan largely, but not completely, blocked the signaling responses to Ang II and restored the phosphoproteins to untreated levels.
Figure 2. Effects of 2-week infusion of the pressor dose of Ang II and concurrent losartan treatment on the activation or inhibition of 38 signaling phosphoproteins in proximal tubules of the rat kidneys.
(a) Control; (b) angiotensin (Ang) II-infused; and (c) colored overlay of pooled control (a) and Ang II-infused (b) rat proximal tubule samples. Panel (d) losartan-treated Ang II-infused rats. (e) Colored overlay of pooled control (a) and losartan-treated Ang II-infused rat proximal tubule samples (d). (f) Colored overlay of pooled Ang II-infused (b) and losartan-treated Ang II-infused (d) rat proximal tubule samples. Abbreviations for the tracked signaling phosphoproteins are explained in Table 4. Red shows increased whereas blue indicates decreased signaling phosphoproteins in response to the pressor dose of Ang II infusion, compared with control or losartan-treated, Ang II-infused rats. White shows unaltered signaling phosphoproteins in response to Ang II infusion.
Figure 3. The Kinetwork multi-immunoblot and semi-quantitative analyses identified 14 signaling phosphoproteins that were altered in proximal tubules by 2-week infusion of the pressor dose of angiotensin (Ang) II in rats.
The relative changes in the enhanced chemiluminescence (ECL) western signal intensity are expressed as c.p.m., which is the trace quantity of the band corrected to a scan time of 60 s (see online Expanded Methods section).
Table 2.
Signaling phosphoproteins that were not significantly altered by the pressor dose of Ang II-infusion or concurrent treatment with losartan in Ang II-infused rats (<25% increase or decrease)
| Proteins | Abbreviation | Lane | Recognized epitope(s) |
|---|---|---|---|
| Epitope(s) | |||
| Adducin α | Adducin α | 3 | S726 |
| Adducin γ | Adducin γ | 3 | S693 |
| B23 (nucleophosmin, numatrin, nucleolar protein NO38) | B23 (NPM) | 19 | S4 |
| Cyclin-dependent protein-serine kinase 1/2 | CDK1/2 | 3 | Y15 |
| Double-stranded RNA-dependent protein-serine kinase | PKR1 | 16 | T451 |
| Extracellular-regulated protein-serine kinase 2 | ERK2 | 8 | T185+Y187 |
| Jun N-terminus protein-serine kinase | JNK | 6 | T183+Y185 |
| Stress-activated protein kinase (SAPK) | |||
| Jun proto-oncogene-encoded AP1 transcription factor | Jun | 11 | S73 |
| MAPK/ERK protein-serine kinase 1/2 | MEK1/2 | 19 | S218+S222 |
| Mitogen-activated protein-serine kinase p38 alpha | p38α MAPK | 18 | T180+Y182 |
| N-methyl-D-aspartate (NMDA) glutamate receptor 1 | NR1 | 2 | S896 |
| Protein-serine kinase B alpha (Akt1) | PKBa (Akt1) | 13 | S473 |
| Protein-serine kinase C epsilon | PKCε | 9 | S729 |
| Ribosomal S6 protein-serine kinase 1/3 | RSK1/3 | 6 | T359+S363/T356+S360 |
| Signal transducer and activator of transcription 1 | STAT1 | 12 | Y701 |
| Signal transducer and activator of transcription 5 | STAT5 | 4 | Y694 |
cAMP-dependent CREB1 signaling phosphoproteins
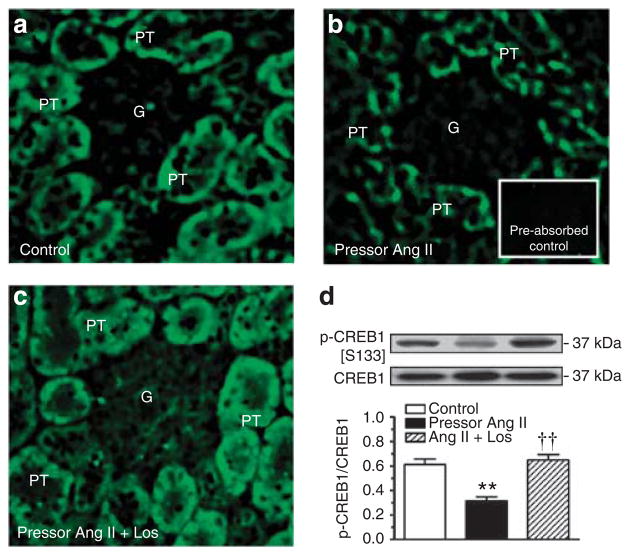
Phospho-CREB1 immunofluorescence staining was much weaker in proximal tubules of Ang II-infused rats than in control rats, and the response was reversed by losartan (Figure 4a–c). Ang II decreased phosphorylated CREB1 [S133] proteins in proximal tubules by 56±7% (P<0.01). Concurrent treatment with losartan restored phospho-CREB1 proteins to the control level in Ang II-infused rats (P<0.01).
Figure 4. Western blot.
Effects of 2-week infusion of the pressor dose of angiotensin (Ang II) and concurrent losartan treatment on cAMP-dependent phospho-CREB1 [S133] immunofluorescence staining (a–c, not quantitative) or CREB1 [S133] phosphoproteins (d, semi-quantitative) in proximal tubules of the rat kidneys. Phospho-CREB1 [S133] is expressed as a fraction of non-phosphorylated CREB1 proteins. In each lane of western blot gels, 100 μg proteins were loaded. **P<0.01 versus control; ††P<0.01 versus Ang II-infused rats. G, glomerulus; PT, proximal tubule.
Protein kinase C signaling phosphoproteins
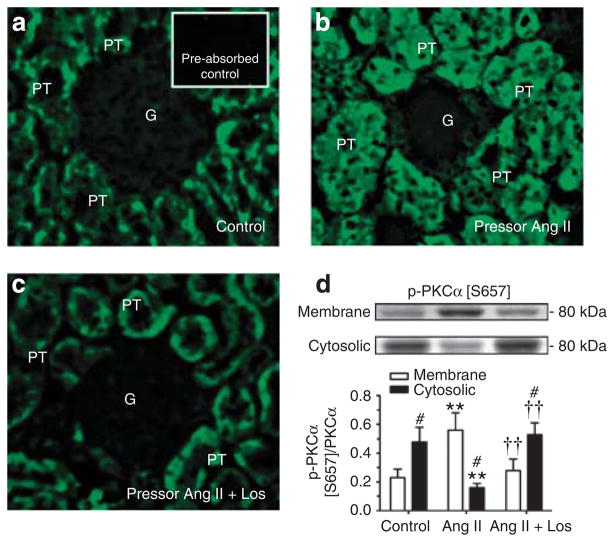
Angiotensin II markedly increased phospho-PKCα [S657] immunofluorescence staining in proximal tubules of Ang II-infused rats, which was reversed by losartan (Figure 5a–c). Western blot analysis confirmed that phospho-PKCα [S657] was increased by 86±9% in membrane fractions, but was decreased in cytosolic fractions (P<0.01, Figure 5d). Activation of PKCα [S657] in proximal tubules by Ang II was blocked by losartan. Phospho-PKCα/βII [T638/T641] was increased by 122±13% in Ang II-infused rats (P<0.01), which was also blocked by losartan (see Supplementary Figure S1 online). By contrast, PKCδ [T507] phosphoproteins were decreased by 53±9% in proximal tubules by Ang II (P<0.01), and the response was blocked by losartan (P<0.01 versus Ang II-infused) (see Supplementary Figure S1 online). PKCε [S729] phosphoproteins were not altered in Ang II-infused rats with or without losartan treatment.
Figure 5. Western blot.
Effects of 2-week infusion of the pressor dose of angiotensin (Ang) II and concurrent losartan treatment on phosphorylated protein-serine kinase C (PKC)α [S657] immunofluorescence staining (a–c, not quantitative) or PKCα [S657] phosphoproteins (d, semi-quantitative) in proximal tubules of the rat kidneys. Phosphorylated or activated PKCα [S657] is expressed as a fraction of non-phosphorylated PKCα proteins. In each lane of western blot gels, 100 μg proteins were loaded. #P<0.05 versus membrane fraction; **P<0.01 versus control; ††P<0.01 versus Ang II-infused rats. G, glomerulus; PT, proximal tubule.
Glycogen synthase kinase 3 signaling phosphoproteins
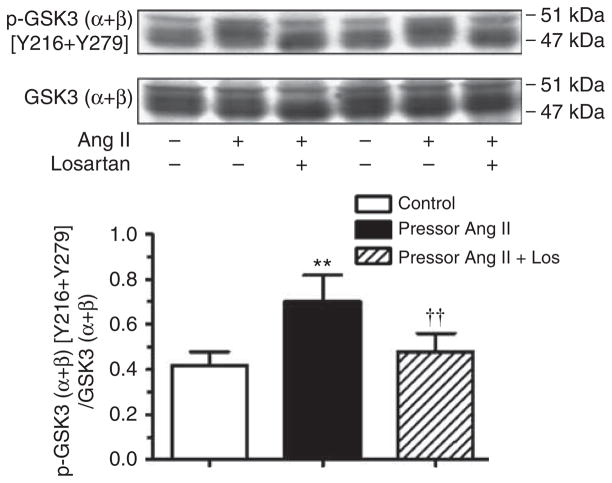
Figure 6 shows that glycogen synthase kinase 3 (GSK3) (α + β)/[Y216 + Y279] phosphoproteins were increased by 56±9% (P<0.01) and 140±11% (P<0.01), respectively, in proximal tubules of Ang II-infused rats. Again, losartan completely blocked these responses.
Figure 6. Effects of 2-week infusion of the pressor dose of Ang II and concurrent losartan treatment on phosphorylated GSK3 (α + β) [Y216 + Y279] phosphoproteins in proximal tubules of the rat kidneys.
Phosphorylated or activated GSK3 (α + β) [Y216 + Y279] is expressed as a fraction of non-phosphorylated GSK3 (α + β) proteins. In each lane of western blot gels, 100 μg proteins were loaded. **P<0.01 versus control; ††P<0.01 versus angiotensin (Ang) II-infused rats.
MAP kinase signaling phosphoproteins
MAP kinases ERK1/ERK2 [T202 + Y204] phosphoproteins were decreased by 44±5% in proximal tubules of Ang II-infused rat kidneys (P<0.05 versus control). Losartan treatment blocked these responses (see Supplementary Figure S2 online).
Effects of the pressor dose of Ang II infusion on [125I]Val5-Ang II binding and AT1 receptor expression
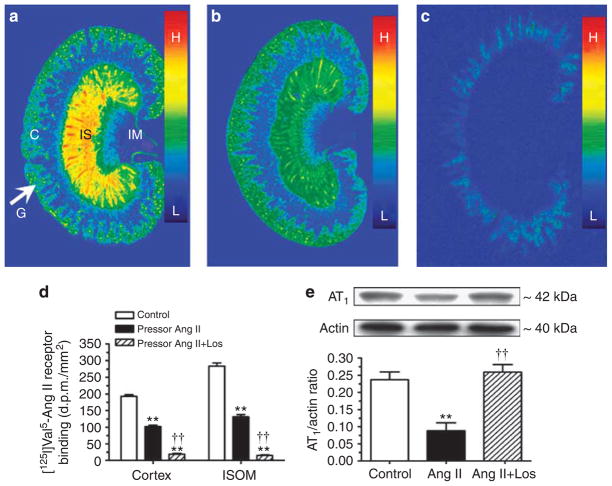
Specific [125I]Val5-Ang II receptor binding was localized in the glomeruli and proximal tubules of the cortex and in the inner stripe of the outer medulla (Figure 7). Ang II infusion decreased [125I]Val5-Ang II binding by 50% in the cortex (control: 183±8 dpm/mm2 versus Ang II: 90±12 dpm/mm2; P<0.01) and in the inner stripe of the outer medulla (control: 276±13 dpm/mm2 versus Ang II: 128±6 dpm/mm2; P<0.01). Losartan largely blocked >90% of [125I]Val5-Ang II binding in the kidney (15±3 dpm/mm2, P<0.01). AT1 protein was measured by western blot analysis in membrane fractions of isolated proximal tubules, which was decreased in Ang II-infused rats (control: 0.24±0.02 versus Ang II: 0.09± 0.02 AT1/actin ratio, P<0.01) and restored by losartan (Figure 7e).
Figure 7. Effects of 2-week infusion of the pressor dose of Ang II and concurrent losartan treatment on specific [125I]Val5-Ang II receptor binding in the cortex and inner stripe of the outer medulla of the rat kidney, and AT1 receptor proteins in membrane fractions of proximal tubules.
(a), Untreated. (b), Angiotensin (Ang) II-infused. (c), Concurrent losartan-treated, and Ang II-infused. Ang II infusion downregulated Ang II receptor binding in the cortex and inner stripe of the outer medulla (b), whereas losartan blocked [125I]Val5-Ang II receptor binding in the kidney of Ang II-infused rats (c). Panel d shows the quantitated results of panels a–c. Panel e shows semi-quantitative western blot result of AT1 receptor proteins in membrane fraction of isolated proximal tubules. In each lane of western blot gels, 100 μg proteins were loaded. C, the renal cortex; G, glomeruli; IM, inner medulla; and IS, inner stripe of the outer medulla. Color bars show the [125I]Val5-ANG II binding density with the red being the highest (H), and blue the lowest levels of binding (L). **P<0.01, compared with controls; ††P<0.01, compared with Ang II-infused rats.
Effects of the pressor dose of Ang II infusion on phosphorylated NHE-3 proteins
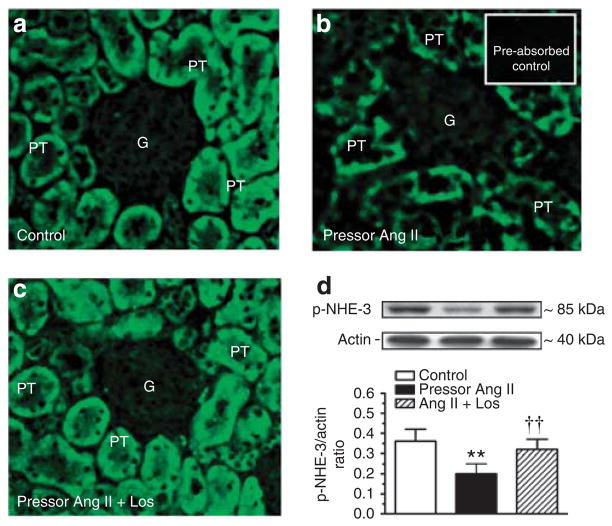
In untreated rats, phospho-NHE-3 immunofluorescence staining was distributed throughout the wall of proximal tubules (Figure 8a), which was much weaker in Ang II-infused rats (Figure 8b). Concurrent losartan treatment largely restored phospho-NHE-3 immunofluorescence staining to the control level (Figure 8c). In membrane fractions of freshly isolated proximal tubules, phospho-NHE-3 proteins were decreased in Ang II-infused rats (control: 0.24±0.02 versus Ang II: 0.10±0.03 NHE-3/actin ratio, P<0.01). Losartan again restored membrane phospho-NHE-3 proteins to the control level (Figure 8d). Interestingly, NHE-3 mRNA expression was increased in proximal tubules of the rats treated with the pressor dose of Ang II infusion, probably because of the feedback response to the decreased membrane (or total) phospho-NHE-3 proteins in proximal tubules (see Supplementary Figure S3 online). Again, losartan reversed the NHE-3 mRNA response to the pressor dose of Ang II infusion (see Supplementary Figure S3 online).
Figure 8. Western blot.
Effects of 2-week infusion of the pressor dose of Ang II and concurrent losartan treatment on phosphorylated or activated NHE-3 immunofluorescence staining (a–c, not quantitative) or phospho-NHE-3 protein abundance in membrane fractions of proximal tubules of the rat kidney (d, semi-quantitative). In each lane of western blot gels, 100 μg proteins were loaded. **P<0.01 versus control; ††P<0.01 versus angiotensin (Ang) II-infused rats. G, glomerulus; PT, proximal tubule.
Effects of the non-pressor dose Ang II infusion on blood pressure, urinary electrolyte excretion, AT1 and NHE-3 activation, and signaling phosphoproteins
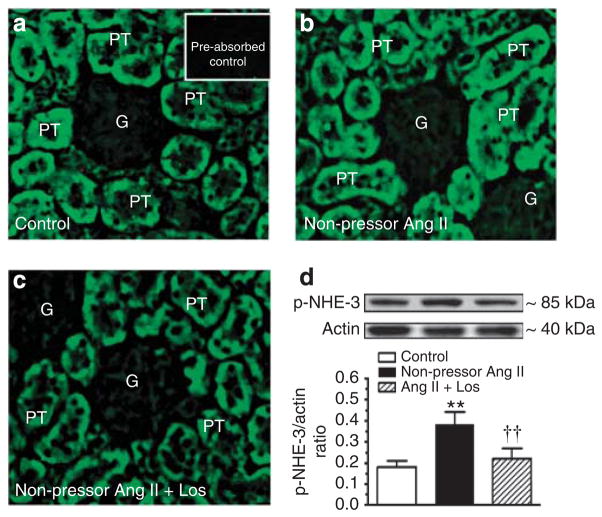
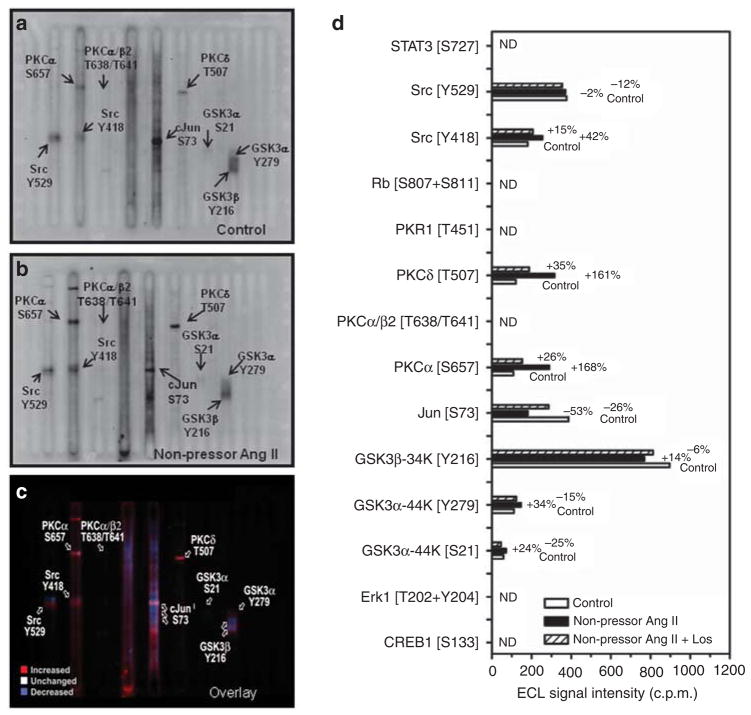
Table 3 summarizes blood pressure and renal electrolyte responses to infusion of the non-pressor dose of Ang II (15 ng/min, s.c.) and concurrent losartan treatment for 2 weeks. Systolic blood pressure was not changed by Ang II, but it was decreased by losartan. Twenty-four hour urine excretion was also unaltered, accompanied by a small decrease in 24-h urinary sodium excretion. AT1 receptor proteins were increased by Ang II (control: 0.26±0.03 versus Ang II: 0.42±0.03 AT1/actin ratio, P<0.01), which was blocked by losartan (see Supplementary Figure S4 online). Compared with control (Figure 9a), phospho-NHE-3 immunofluorescence staining was stronger in proximal tubules of Ang II-infused rats (Figure 9b), which was reversed by losartan (Figure 9c). Furthermore, phospho-NHE-3 proteins were increased in membrane fractions of proximal tubules by the non-pressor dose of Ang II (control: 0.18±0.03 versus Ang II: 0.38±0.06 NHE-3/actin ratio, P<0.01) (Figure 9d). Interestingly, PKCα [S657] and PKCδ [T507], but not PKCβII or PKCε, and GSK3α [Y279], but not GSK3β [Y216], were activated by the non-pressor dose of Ang II (Figure 10a–d).
Table 3.
Effects of the non-pressor dose of Ang II infusion and concurrent losartan treatment for 2 weeks on body and kidney weights, systolic blood pressure, 24 h urinary excretion of water, and electrolytes in Ang II-infused rats
| Response | Control | Non-pressor Ang II | Non-pressor Ang II + Los |
|---|---|---|---|
| Body weight, g | 314±11 | 328±9 | 298±7 |
| Kidney weight, g | 2.4±0.07 | 2.6±0.1 | 2.37±0.03 |
| Kidney weight/body weight ratio, ×100 | 0.77±0.02 | 0.78±0.02 | 0.79±0.01 |
| SBP, mm Hg | 115±4 | 116±3 | 105±6 |
| Urine, ml/24 h | 15.5±0.5 | 17.8±0.9 | 19.1±3.0 |
| UNaV, mmol/24 h | 2.35±0.2 | 1.93±0.2 | 1.98±0.25 |
| UKV, mmol/24 h | 3.2±0.6 | 4.8±0.22** | 2.73±0.36† |
| Urine osmolality, mOsm/kg H2O | 1418±35 | 1084±56* | 1028±151* |
Abbreviations: Ang, angiotensin; SBP, systolic blood pressure; UKV, urinary
potassium excretion; UNaV, urinary sodium excretion.
P<0.05 or
P<0.01 versus control.
P<0.05 versus the non-pressor Ang II-treated group.
Figure 9. Western blot.
Effects of 2-week infusion of the non-pressor dose of Ang II and concurrent losartan treatment on phosphorylated or activated NHE-3 immunofluorescence staining (a–c, not quantitative) or phospho-NHE-3 protein abundance in membrane fractions of proximal tubules of the rat kidney (d, semi-quantitative). In each lane of western blot gels, 100 μg proteins were loaded. **P<0.01 versus control; ††P<0.01 versus angiotensin (Ang II)-infused rats. G, glomerulus; PT, proximal tubule.
Figure 10. The Kinetwork multi-immunoblot comparison analyses identified seven signaling phosphoproteins that were altered in proximal tubules of the rat kidneys by 2-week infusion of the non-pressor dose of Ang II.
(a) A multi-immunoblot from pooled control proximal tubule samples. (b) A multi-immunoblot from pooled Ang II-infused proximal tubule samples. (c) The colored overlay of multi-immunoblots of a and b. (d) The summary of the Kinetwork multi-immunoblot, semi-quantitative analysis results. The relative changes in the enhanced chemiluminescence (ECL) western signal intensity are expressed as c.p.m., which is the trace quantity of the band corrected to a scan time of 60 sec (see online Expanded Methods section). ND, not determined.
Effects of Ang II on MAP kinases ERK1/2 signaling phosphoproteins in cultured mouse proximal tubule cells
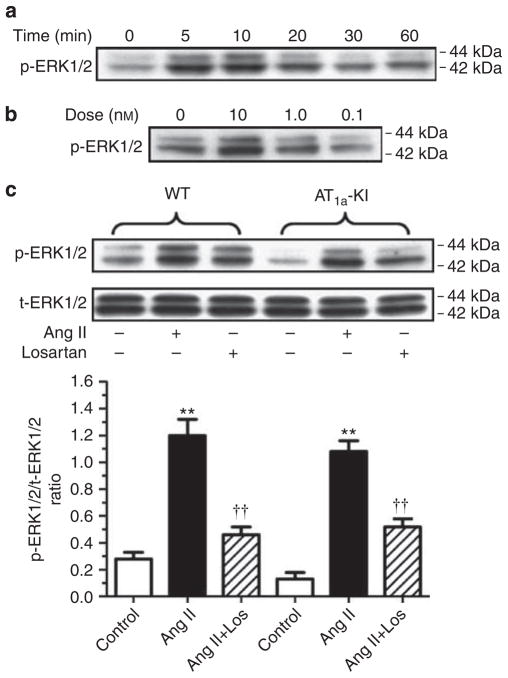
The lack of effects of the pressor dose of Ang II infusion on ERK1/2 signaling phosphoproteins in proximal tubules by Kinetwork multi-immunoblot analysis prompted us to test whether Ang II activates ERK/1/2 in wild type and AT1a-KO mouse proximal tubule cells with the knock-in of a wild-type AT1a receptor (Figure 11). In wild-type cells, Ang II induced dose- and time-dependent increases in phospho-ERK1/2 with peak responses at 10 nmol/l (Figure 11a), and at 5 to 10 min, respectively, (Figure 11b). Ang II (10 nmol/l) increased phospho-ERK1/2 by 2.6-fold (control: 0.28±0.05 versus Ang II: 0.73±0.12 p-ERK1/2 to t-ERK1/2 ratio, P<0.01), which was blocked by losartan (0.46±0.06 p-ERK1/2 to t-ERK1/2 ratio, P<0.01 versus Ang II) (Figure 11). No biphasic p-ERK1/2 responses to Ang II were observed. In AT1a-KO cells, Ang II had little effect on p-ERK1/2 (not shown), but knock-in of the AT1a receptor in these cells restored the p-ERK1/2 response to Ang II (control: 0.16±0.05 versus Ang II: 0.62±0.08, p-ERK1/2 to t-ERK1/2 ratio, P<0.01). Losartan blocked the effect of Ang II on p-ERK1/2 in AT1a-KO cells with the knock-in of the AT1a receptor (0.36±0.06 p-ERK1/2 to t-ERK1/2 ratio, P<0.01 versus Ang II) (Figure 11).
Figure 11. Concentration- and time-dependent, and AT1a receptor-mediated activation of MAP kinases ERK1/2 in wild-type and AT1a receptor-deficient (AT1a-KO) mouse proximal tubule cells with the knock-in of the AT1a receptor.
(a) Time-dependent, (b) dose-dependent, and (c) AT1a receptor-dependent responses. The effects of angiotensin (Ang) II on MAP kinases ERK1/2 were blocked by losartan (10 μmol/l). AT1a-KI, re-expression of AT1a receptors in AT1a-KO mouse proximal tubule cells. In each lane of western blot gels 10 μg proteins were loaded. **P<0.01 versus control; ††P<0.01 versus Ang II-treated wild-type cells or Ang II-treated AT1a-KO cells with the knock-in of the receptor. WT, wild-type.
Effects of knockdown of PKCα protein expression on Ang II-induced NHE-3 activation in mouse proximal tubule cells
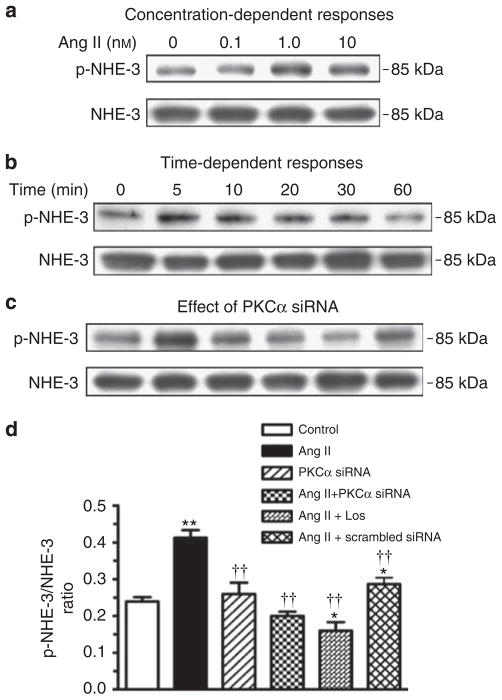
We determined whether activation of PKCα signaling phosphoproteins is actually involved in the activation or phosphorylation of NHE-3 proteins in wild-type mouse proximal tubule cells. Ang II induced both dose- and time-dependent increases in phospho-NHE-3 proteins with peak responses at 1 to 10 nmol/l (Figure 12a), and at 5 to 10 min after Ang II stimulation (Figure 12b). The effect of Ang II (1 nmol/l) on activation of NHE-3 proteins was inhibited by knocking down the expression of PKCα signaling proteins with a specific PKCα siRNA, but not with a scrambled siRNA control (Figure 12c).
Figure 12. Effects of knockdown of PKCα expression with a specific PKCα siRNA on Ang II-induced phosphorylation or activation of NHE-3 proteins (phospho-NHE-3) in mouse proximal tubule cells in vitro.
(a) Concentration-dependent responses, (b) time-dependent responses, and (c) protein-serine kinase C (PKC)α-dependent activation of NHE-3 proteins. A nonspecific scrambled small-interfering RNA was used as a negative control. (d) Semi-quantitative results expressed as the ratio of phospho-NHE-3 versus non-phospho-NHE-3 proteins from three experiments. In each lane of western blot gels, 10 μg proteins were loaded. *P<0.05 or **P<0.01 versus control; ††P<0.01 versus Ang II.
DISCUSSION
Although proteomic approaches are increasingly used to identify novel proteins in target tissues, few studies have used these techniques to profile pathway-specific signaling responses to 2 weeks of Ang II infusion specifically in proximal tubules of the kidney.18 Leong et al.19 used one-dimensional SDS-PAGE and MALDI-MS analyses to study the trafficking of renal cortical membrane transporter proteins in response to acute angiotensin-converting enzyme inhibition with captopril in rats. Using these techniques, Leong et al.19 were able to characterize the patterns of redistribution of NHE-3, NaPi2, and vacuolar H+-ATPases in the rat renal cortex after acute angiotensin-converting enzyme inhibition. de Borst et al.20 used novel peptide array chips to profile protein kinase substrates and/or protein kinase activities in the renal cortex of homozygous Ren2 rats, a model of Ang II-dependent hypertension. The notable observations in the latter study are the activation of p38 MAP kinase and the platelet-derived growth factor receptor-β, which were increased in Ren2 and reversed by ramipril.20 The present study differs from the abovementioned studies in three unique ways. First, only freshly isolated proximal tubules were used for analysis of signaling responses, which exclude the contamination of signaling proteins from other cellular structures. Second, we used the pathway-specific, multi-immunoblotting approach for proteomic analysis of signaling responses to 2 weeks of pressor or non-pressor dose of Ang II infusion with or without hypertension. Finally, we used antibodies that target specific phosphorylation sites of the proteins of interest. This pathway-specific multi-immunoblotting analysis revealed several key signaling responses in proximal tubules of rats infused with the pressor or the non-pressor dose of Ang II.
Inhibition of cAMP-dependent activation of CREB1 [S133] signaling phosphoproteins by the pressor dose of Ang II
Ang II regulates proximal tubule sodium and bicarbonate reabsorption in part by inhibiting adenylate cyclase and cAMP.21,22 Although it remains controversial, there is evidence that Ang II inhibits cAMP production in proximal tubule cells.23–25 Conversely, increases in cAMP and activation of cAMP-dependent PKA inhibit Ang II-induced acidification of proximal tubule fluid or apical Na +/H +exchange in isolated perfused proximal tubules.22,23 Phospho-CREB1 [S133] is the major downstream signaling protein in response to activation of cAMP-dependent PKA and was measured as a function of cAMP activation in the present study. We found a ~60% decrease in phospho-CREB1 [S133] proteins in proximal tubules of rats infused with the pressor dose Ang II and the effect was blocked by losartan treatment. These responses were confirmed in phospho-CREB1-immunofluorescence staining in proximal tubules of Ang II-infused rats treated with or without losartan. However, we did not observe similar changes in phospho-CREB1 [S133] proteins in proximal tubules of rats infused with the non-pressor dose of Ang II. This raises the possibility that the response of phospho-CREB1 [S133] proteins to the pressor dose of Ang II in proximal tubules may be pressure-dependent.
Activation of PKC signaling phosphoproteins
The phospholipase C-dependent PKC signaling pathway represents a major cellular mechanism underlying Ang II-induced transport responses in proximal tubules.5,26–28 In the present study, we focused on four major phospho-PKC isoenzymes, PKCα, PKCβII, PKCδ, and PKCε, because these PKC isoenzymes are expressed and respond to Ang II in the rat and mouse kidneys29,30 or in rat proximal tubules.27,31 As both phospho-PKCα [S657] and phospho-PKCβII were increased by Ang II and attenuated by losartan, an AT1 receptor-mediated mechanism is clearly indicated. By comparison, only phospho-PKCα [S657] and phospho-PKCδ [T507] proteins were increased in proximal tubules by the non-pressor dose of Ang II. These results suggest that PKCα and PKCδ may be directly activated by Ang II, independent of blood pressure, whereas the response of PKCβII may be pressure-dependent. Previous studies showed that Ang II had no effect on PKCδ or increased PKCε27 or PKCγ activity in proximal tubules.31 By contrast, the present study showed that PKCδ [T507] phosphoproteins were decreased by ~59% without altering PKCε [S729] in proximal tubules of rats infused with the pressor dose of Ang II. These differences may be explained by our use of freshly isolated proximal tubules and measurement of activated or phosphorylated PKC isozymes, and treatment of rats with Ang II for 2 weeks. A substantial increase in activated PKCδ [T507] in proximal tubules of rats infused with the non-pressor dose of Ang II and with normal blood pressure is consistent with this interpretation.
Activation of GSK3α and GSK3β signaling phosphoproteins
GSK3 is associated with glycogen metabolism, glucose transport, insulin receptor signaling, and proliferative cytokines.32–34 GSK3α and GSK3β are serine/threonine protein kinases and their activation induces phosphorylation of glycogen synthase leading to inactivation of this enzyme and increase of glucose levels. Mariappan et al.32 showed that GSK3β has a role in augmented protein synthesis by high glucose and in insulin-stimulated hypertrophy of renal proximal tubular cells of type 2 diabetes. In human tubular epithelial cells, tumor necrosis factor-α-mediated proinflammatory responses were augmented by GSK3β overexpression and conversely obliterated by GSK3β inhibitors.33 How GSK3α and GSKβ are activated by Ang II remains to be further studied. The differences in phospho-GSK3 (α + β) responses to the pressor and non-pressor doses of Ang II suggest that activation of PKC by Ang II and hypertension may have an important role.34
MAP kinases ERK1/2 signaling phosphoproteins
Activation of the MAP kinases ERK1/2 signaling cascade is a major downstream signaling mechanism for Ang II-induced growth and transcriptional responses.35,36 However, phospho-Raf1 [S259], MEK3/6 [S189 + S207], or ERK1/ERK2 [T202 + Y204] were either decreased or remained unaltered in proximal tubules of rats infused with the pressor dose of Ang II, while the non-pressor dose of Ang II had no effects. These in vivo findings are different from the acute effects of Ang II on ERK1/2 activation in vitro in mesangial and proximal tubule cells.37–40 The explanation may be that Ang II was infused in rats for 2 weeks rather than minutes, and the responses of the ERK1/2 signaling cascade may have returned to the control level in the present study. Indeed, Ang II acutely increased ERK1/2 phosphoproteins in both dose-and time-dependent manners, which were blocked by losartan, in wild-type mouse proximal tubule cells and AT1a-KO mouse proximal tubule cells with the knock-in of the AT1a receptor. Alternatively, activation of GSKα and GSKβ signaling by Ang II may inhibit the ERK signaling pathway, as reported in cardiac cells and renal proximal tubular cells.32,41
Correlations between Ang II-induced signaling phospho-protein responses and activation of NHE-3
In the present study, a pressure-induced natriuretic response was observed in rats infused with the pressor dose of Ang II and with hypertension, and conversely, a small but insignificant anti-natriuretic response was seen in rats receiving the non-pressor dose of Ang II infusion without hypertension. These different responses are associated with the downregulation of AT1 receptor and decreases in phospho-NHE-3 proteins in membrane fractions of proximal tubules with the pressor dose of Ang II infusion. Combined with the decreases in phopho-NHE-3 immunofluorescence staining in proximal tubules, our results are consistent with the concept that activated NHE-3 proteins may be decreased and retracted from brush border membranes of proximal tubules during acute and chronic hypertension.42,43 This interpretation is supported by the findings that phospho-NHE-3 proteins were increased in membrane fractions of proximal tubules of the rats infused with the non-pressor dose of Ang II in vivo (Figure 9b) and in cultured mouse proximal tubule cells in vitro (Figure 12). Finally, activation of PKCα signaling proteins by the pressor and non-pressor dose of Ang II may be responsible for activation of NHE-3 in proximal tubules, proximal tubule sodium transport, and urinary sodium responses in the present study.5,26,27,31,44
In summary, the present study used the novel pathway-specific, multi-immunoblotting proteomic approach for the first time to simultaneously profile the sustained responses of 38 signaling phosphoproteins to a pressor or a non-pressor dose of Ang II in freshly isolated proximal tubules of the rat kidney. The activated signaling phosphoproteins by Ang II identified in the present study may have diverse physiological and pathophysiological effects on sodium and fluid reabsorption (cAMP/PKA/CREB1, PKCα, PKCβII, and PKCδ), and glycogen metabolism and glucose transport (GSK3α and GSK3β) in proximal tubules. These responses were likely mediated by AT1 receptors, because losartan largely blocked Ang II receptors in the kidney and the responses of signaling proteins in Ang II-infused rats. However, it should be pointed out that some of the losartan-mediated effects may be independent of AT1 receptor blockade; for example, losartan may directly or indirectly inhibit angiotensin-converting enzyme and therefore decreases Ang II formation. Nevertheless, our results suggest that multi-immunoblot proteomic analysis of pathway-specific signaling phosphoproteins may provide a powerful tool to identify novel signaling mechanisms or therapeutic targets in Ang II-induced hypertension and kidney diseases.
MATERIALS AND METHODS
See Online Expanded Methods for details.
Animals
A total of six groups of 54 adult male Sprague–Dawley rats were used in this study. Groups 1 and 4 were used as control. Groups 2 and 5 were infused with the pressor (60 ng/min) or the non-pressor dose (15 ng/min) of Val5-Ang II via an osmotic minipump for 2 weeks. Groups 3 and 6 were infused with Ang II as in Groups 2 and 5 but treated with the AT1 receptor antagonist, losartan, at 20 mg/kg per day, p.o. for 2 weeks. Systolic blood pressure and 24-h urine and urinary sodium excretion were measured as described.12,45,46 This study was approved by the Henry Ford Health System and University of Mississippi Medical Center’s Institutional Animal Care and Use Committees, respectively.
Isolation of fresh proximal tubules
Fresh and pure proximal tubules (~95%) were isolated from the superficial cortex of the kidneys of control, Ang II-infused, and losartan-treated Ang II-infused rats using a modified method of Vinay et al.47 (Supplementary Figure S5 online).
Measurements of plasma, whole kidney, and proximal tubule Ang II
Plasma, kidney, and proximal tubular Ang II concentrations were measured using a sensitive Ang II ELISA kit after extraction and purification.12,45,46
Measurement of urine and urinary electrolyte excretion
Twenty-four hour urine excretion rate was determined gravimetrically, whereas urinary sodium and potassium concentrations were determined by Nova 13 Electrolyte Analyzer (Waltham, MA).12,45,48 Urine albumin and creatinine concentrations were measured to determine the albumin-to-creatinine ratio as an index of renal injury.
Pathway-specific multi-immunoblotting proteomic analysis of signaling phosphoproteins
Proteins were extracted from freshly isolated proximal tubules according to the Services Provider’s protocol for multi-immunoblotting of signaling phosphoproteins (Kinexus Bioinformatics). Overall, 38 signaling phosphoproteins were profiled using a Kinetworks pathway-specific phosphoprotein multi-immunoblotting screen (KPSS 1.3).49,50 The antibodies targeting specific phosphoproteins are listed in Table 4.
Table 4.
KINETWORKS KPSS 1.3 multi-immunoblotting screen tracking 38 phosphorylation sites of signaling phosphoproteins with antibodies that recognize specific phosphorylated epitopes
| Ab. # | Protein | Description of target protein | Recognized epitope(s) |
|---|---|---|---|
| 1. | Adducin-α | Adducin alpha (ADD1) | S726 |
| 2. | Adducing | Adducin gamma (ADD3) | S693 |
| 3. | B23 [NPM] | B23 (nucleophosmin, numatrin, nucleolar protein NO38) | S4 |
| 4. | CDK1/2 | Cyclin-dependent protein-serine kinase 1/2 | Y15 |
| 5. | CREB1 | cAMP-response element binding protein 1 | S133 |
| 6. | Erk1 | Extracellular regulated protein-serine kinase 1 (p44 MAP kinase) | T202+Y204 |
| 7. | Erk2 | Extracellular regulated protein-serine kinase 2 (p42 MAP kinase) | T185+Y187 |
| 8. | GSK3α | Glycogen synthase-serine kinase 3 alpha | S21 |
| 9. | GSK3α | Glycogen synthase-serine kinase 3 alpha | Y279 |
| 10. | GSK3β | Glycogen synthase-serine kinase 3 beta | S9 |
| 11. | GSK3β | Glycogen synthase-serine kinase 3 beta | Y216 |
| 12. | JNK | Jun N-terminus protein-serine kinase (stress-activated protein kinase (SAPK)) 1/2/3 | T183+Y185 |
| 13. | Jun | Jun proto-oncogene-encoded AP1 transcription factor | S73 |
| 14. | MEK1/2 | MAPK/ERK protein-serine kinase 1/2 (MKK1/2) | S217+S221 |
| 15. | MEK3/6 | MAP kinase protein-serine kinase 3/6 (MKK3/6) | S189/S207 |
| 16. | MEK6 (MAP2K6) | MAP kinase protein-serine kinase 6 (MKK6) | S207 |
| 17. | Msk1 | Mitogen- and stress-activated protein-serine kinase 1 | S376 |
| 18. | NR1 | N-methyl-D-aspartate (NMDA) glutamate receptor 1 subunit zeta | S896 |
| 19. | p38α MAPK | Mitogen-activated protein-serine kinase p38 alpha | T180+Y182 |
| 20. | PKBα [Akt1] | Protein-serine kinase B alpha (Akt1) | T308 |
| 21. | PKBα [Akt1] | Protein-serine kinase B alpha (Akt1) | S473 |
| 22. | PKCα | Protein-serine kinase C alpha | S657 |
| 23. | PKCαβ2 | Protein-serine kinase C alpha/beta 2 | T638/T641 |
| 24. | PKCδ | Protein-serine kinase C delta | T507 |
| 25. | PKCε | Protein-serine kinase C epsilon | S729 |
| 26. | PKR | Double-stranded RNA-dependent protein-serine kinase | T451 |
| 27. | Raf1 | Raf 1proto-oncogene-encoded protein-serine kinase | S259 |
| 28. | Rb | Retinoblastoma-associated protein | S780 |
| 29. | Rb | Retinoblastoma-associated protein | S807+S811 |
| 30. | RSK1/3 | Ribosomal S6 protein-serine kinase 1/3 | T359+S363/T356+S360 |
| 31. | S6K2 p85 | p85 ribosomal protein-serine S6 kinase 2 | T412 |
| 32. | S6Kαp70 | p70 ribosomal protein-serine S6 kinase alpha | T389 |
| 33. | Smad1/5/9 | SMA- and mothers against decapentaplegic homologs 1/5/9 | S463+S465/S463+S465/S465+S467 |
| 34. | Src | Src proto-oncogene-encoded protein-tyrosine kinase | Y418 |
| 35. | Src | Src proto-oncogene-encoded protein-tyrosine kinase | Y529 |
| 36. | STAT1 | Signal transducer and activator of transcription 1 | Y701 |
| 37. | STAT3 | Signal transducer and activator of transcription 3 | S727 |
| 38. | STAT5 | Signal transducer and activator of transcription 5 | Y694 |
Abbreviations: Ab., antibody; S, serine; T, threonine; Y, tyrosine.
Immunofluorescence staining of signaling phosphoproteins
Phospho-CREB1 (S133), phospho-PKCα (S657), phospho-NHE-3, phospho-cJun (S73) (Supplementary Figure S6 online), phospho-Rb (S807 + 811) (Supplementary Figure S9 online), phospho-Src (Y418) (Supplementary Figure S7 online), phospho-Src (Y529) (Supplementary Figure S8 online), and phospho-STAT3 (S727) (Supplementary Figure S10 online) immunofluorescence staining in proximal tubules were performed in kidney sections using the primary antibodies as for western blot analysis.
Western blot analysis
Western blot analysis was performed to further confirm the extent of responses in some, but not all, selective phosphoproteins using antibodies that recognize the phosphorylation epitope(s).49,50
Statistical analysis
All results are presented as means±s.e.m. The differences in the same parameters between different groups of rats were first analyzed using one-way analysis of variance followed by Dunnett’s comparisons between group means. For multi-immunoblotting analysis, the data were pooled from five rats for each group. For standard western blot analysis, data were derived from six rats for each group. The significance was set at P<0.05.
Supplementary Material
Figure S1. Effects of the pressor dose of Ang II and concurrent losartan treatment on proximal tubular phospho-PKCα/βII [T638/T641] and phospho-PKCδ [T507] signaling proteins.
Figure S2. Effects of the pressor dose of Ang II and concurrent losartan treatment on proximal tubular phospho-ERK1/2 signaling proteins.
Figure S3. Effects of the pressor dose of Ang II and concurrent losartan treatment on proximal tubular NHE-3 mRNA expression.
Figure S4. Effects of the non-pressor dose of Ang II and concurrent losartan treatment on proximal tubular AT1 receptor proteins.
Figure S5. Phase-contrast micrographs of freshly isolated rat proximal tubules.
Figure S6. Effect of the pressor dose of Ang II on proximal tubular phosphorylated c-Jun [S73] immunofluorescence staining.
Figure S7. Effect of the pressor dose of Ang II on proximal tubular phosphorylated Src [Y418] immunofluorescences staining.
Figure S8. Effect of the pressor dose of Ang II on proximal tubular phosphorylated c-Jun[Y529] immunofIuorescence staining.
Figure S9. Effect of the pressor dose of Ang II on proximal tubular phosphorylated Rb [807+S811] immunofluorescence staining.
Figure S10. Effect of the pressor dose of Ang II on proximal tubular phosphorylated STAT-3[S727] immunofluorescence staining.
Acknowledgments
We thank Dr Ulrich Hopfer of Case Western Reserve University for providing us with wild-type and AT1a receptor-KO mouse proximal tubule cells, and Dr Steven Pelech of University of British Columbia and Kinexus Corporation, Canada for helpful discussions and suggestions in revising the manuscript.
Footnotes
Supplementary material is linked to the online version of the paper at http://www.nature.com/ki
Portions of the work were presented at the 62nd High Blood Pressure Research Conference, American Heart Association, in Atlanta, GA, 17–20 September 2008, and Renal Week 2008, American Society of Nephrology, in Philadelphia, PA, 5–9 November 2008. The results were published as abstracts in Hypertension 2008; 52(4):e41 and J Am Soc Nephrol 2008; 19:382A.
DISCLOSURE
This work was supported in part by grants from the National Institute of Diabetes and Digestive and Kidney Diseases (5RO1DK067299, 2R56DK067299-06, and 2RO1DK067299-06A2), American Society of Nephrology (M James Scherbenske Grant), Henry Ford Health System, and University of Mississippi Medical Center institutional supports to JLZ.
References
- 1.Harris PJ, Young JA. Dose-dependent stimulation and inhibition of proximal tubular sodium reabsorption by angiotensin II in the rat kidney. Pflugers Arch. 1977;367:295–297. doi: 10.1007/BF00581370. [DOI] [PubMed] [Google Scholar]
- 2.Navar LG, Carmines PK, Huang WC, et al. The tubular effects of angiotensin II. Kidney Int Suppl. 1987;20:S81–S88. [PubMed] [Google Scholar]
- 3.Cogan MG. Angiotensin II: a powerful controller of sodium transport in the early proximal tubule. Hypertension. 1990;15:451–458. doi: 10.1161/01.hyp.15.5.451. [DOI] [PubMed] [Google Scholar]
- 4.Geibel J, Giebisch G, Boron WF. Angiotensin II stimulates both Na(+)-H+ exchange and cotransport in the rabbit proximal tubule. Proc Natl Acad Sci USA. 1990;87:7917–7920. doi: 10.1073/pnas.87.20.7917. [DOI] [PMC free article] [PubMed] [Google Scholar]
- 5.Houillier P, Chambrey R, Achard JM, et al. Signaling pathways in the biphasic effect of angiotensin II on apical Na/H antiport activity in proximal tubule. Kidney Int. 1996;50:1496–1505. doi: 10.1038/ki.1996.464. [DOI] [PubMed] [Google Scholar]
- 6.Yingst DR, Massey KJ, Rossi NF, et al. Angiotensin II directly stimulates activity and alters the phosphorylation of Na-K-ATPase in rat proximal tubule with a rapid time course. Am J Physiol Renal Physiol. 2004;287:F713–F721. doi: 10.1152/ajprenal.00065.2004. [DOI] [PubMed] [Google Scholar]
- 7.Bharatula M, Hussain T, Lokhandwala MF. Angiotensin II AT1 receptor/signaling mechanisms in the biphasic effect of the peptide on proximal tubular Na+/K+-ATPase. Clin Exp Hypertens. 1998;20:465–480. doi: 10.3109/10641969809053225. [DOI] [PubMed] [Google Scholar]
- 8.Horita S, Zheng Y, Hara C, et al. Biphasic regulation of cotransporter by angiotensin II type 1A receptor. Hypertension. 2002;40:707–712. doi: 10.1161/01.hyp.0000036449.70110.de. [DOI] [PubMed] [Google Scholar]
- 9.Zhou Y, Bouyer P, Boron WF. Role of the AT1A receptor in the CO2-induced stimulation of reabsorption by renal proximal tubules. Am J Physiol Renal Physiol. 2007;293:F110–F120. doi: 10.1152/ajprenal.00516.2006. [DOI] [PubMed] [Google Scholar]
- 10.Schuster VL, Kokko JP, Jacobson HR. Angiotensin II directly stimulates sodium transport in rabbit proximal convoluted tubules. J Clin Invest. 1984;73:507–515. doi: 10.1172/JCI111237. [DOI] [PMC free article] [PubMed] [Google Scholar]
- 11.Johnson RJ, Alpers CE, Yoshimura A, et al. Renal injury from angiotensin II-mediated hypertension. Hypertension. 1992;19:464–474. doi: 10.1161/01.hyp.19.5.464. [DOI] [PubMed] [Google Scholar]
- 12.Zhuo JL, Imig JD, Hammond TG, et al. Ang II accumulation in rat renal endosomes during Ang II-induced hypertension: role of AT1 receptor. Hypertension. 2002;39:116–121. doi: 10.1161/hy0102.100780. [DOI] [PubMed] [Google Scholar]
- 13.Muller DN, Dechend R, Mervaala EM, et al. NF-kappaB inhibition ameliorates angiotensin II-induced inflammatory damage in rats. Hypertension. 2000;35:193–201. doi: 10.1161/01.hyp.35.1.193. [DOI] [PubMed] [Google Scholar]
- 14.Touyz RM, Schiffrin EL. Signal transduction mechanisms mediating the physiological and pathophysiological actions of angiotensin II in vascular smooth muscle cells. Pharmacol Rev. 2000;52:639–672. [PubMed] [Google Scholar]
- 15.Higuchi S, Ohtsu H, Suzuki H, et al. Angiotensin II signal transduction through the AT1 receptor: novel insights into mechanisms and pathophysiology. Clin Sci (Lond) 2007;112:417–428. doi: 10.1042/CS20060342. [DOI] [PubMed] [Google Scholar]
- 16.Zou Y, Komuro I, Yamazaki T, et al. Cell type-specific angiotensin II-evoked signal transduction pathways: critical roles of Gbetagamma subunit, Src family, and Ras in cardiac fibroblasts. Circ Res. 1998;82:337–345. doi: 10.1161/01.res.82.3.337. [DOI] [PubMed] [Google Scholar]
- 17.Griendling KK, Ushio-Fukai M, Lassegue B, et al. Angiotensin II signaling in vascular smooth muscle. New concepts Hypertension. 1997;29:366–373. doi: 10.1161/01.hyp.29.1.366. [DOI] [PubMed] [Google Scholar]
- 18.Janech MG, Raymond JR, Arthur JM. Proteomics in renal research. Am J Physiol Renal Physiol. 2007;292:F501–F512. doi: 10.1152/ajprenal.00298.2006. [DOI] [PubMed] [Google Scholar]
- 19.Leong PK, Devillez A, Sandberg MB, et al. Effects of ACE inhibition on proximal tubule sodium transport. Am J Physiol Renal Physiol. 2006;290:F854–F863. doi: 10.1152/ajprenal.00353.2005. [DOI] [PubMed] [Google Scholar]
- 20.de Borst MH, Diks SH, Bolbrinker J, et al. Profiling of the renal kinome: a novel tool to identify protein kinases involved in angiotensin II-dependent hypertensive renal damage. Am J Physiol Renal Physiol. 2007;293:F428–F437. doi: 10.1152/ajprenal.00367.2006. [DOI] [PubMed] [Google Scholar]
- 21.Douglas JG. Angiotensin receptor subtypes of the kidney cortex. Am J Physiol. 1987;253:F1–F7. doi: 10.1152/ajprenal.1987.253.1.F1. [DOI] [PubMed] [Google Scholar]
- 22.Liu FY, Cogan MG. Angiotensin II stimulates early proximal bicarbonate absorption in the rat by decreasing cyclic adenosine monophosphate. J Clin Invest. 1989;84:83–91. doi: 10.1172/JCI114174. [DOI] [PMC free article] [PubMed] [Google Scholar]
- 23.Schelling JR, Singh H, Marzec R, et al. Angiotensin II-dependent proximal tubule sodium transport is mediated by cAMP modulation of phospholipase C. Am J Physiol. 1994;267:C1239–C1245. doi: 10.1152/ajpcell.1994.267.5.C1239. [DOI] [PubMed] [Google Scholar]
- 24.Thekkumkara T, Linas SL. Role of internalization in AT1A receptor function in proximal tubule epithelium. Am J Physiol Renal Physiol. 2002;282:F623–F629. doi: 10.1152/ajprenal.00118.2001. [DOI] [PubMed] [Google Scholar]
- 25.Li XC, Carretero OA, Navar LG, et al. AT1 receptor-mediated accumulation of extracellular angiotensin II in proximal tubule cells: role of cytoskeleton microtubules and tyrosine phosphatases. Am J Physiol Renal Physiol. 2006;291:F375–F383. doi: 10.1152/ajprenal.00405.2005. [DOI] [PMC free article] [PubMed] [Google Scholar]
- 26.Du Z, Ferguson W, Wang T. Role of PKC and calcium in modulation of effects of angiotensin II on sodium transport in proximal tubule. Am J Physiol Renal Physiol. 2003;284:F688–F692. doi: 10.1152/ajprenal.00261.2002. [DOI] [PubMed] [Google Scholar]
- 27.Karim Z, Defontaine N, Paillard M, et al. Protein kinase C isoforms in rat kidney proximal tubule: acute effect of angiotensin II. Am J Physiol. 1995;269:C134–C140. doi: 10.1152/ajpcell.1995.269.1.C134. [DOI] [PubMed] [Google Scholar]
- 28.Liu FY, Cogan MG. Role of protein kinase C in proximal bicarbonate absorption and angiotensin signaling. Am J Physiol. 1990;258:F927–F933. doi: 10.1152/ajprenal.1990.258.4.F927. [DOI] [PubMed] [Google Scholar]
- 29.Pfaff IL, Wagner HJ, Vallon V. Immunolocalization of protein kinase C isoenzymes alpha, beta1 and betaII in rat kidney. J Am Soc Nephrol. 1999;10:1861–1873. doi: 10.1681/ASN.V1091861. [DOI] [PubMed] [Google Scholar]
- 30.Redling S, Pfaff IL, Leitges M, et al. Immunolocalization of protein kinase C isoenzymes alpha, beta I, beta II, delta, and epsilon in mouse kidney. Am J Physiol Renal Physiol. 2004;287:F289–F298. doi: 10.1152/ajprenal.00273.2003. [DOI] [PubMed] [Google Scholar]
- 31.Boesch DM, Garvin JL. Age-dependent activation of PKC isoforms by angiotensin II in the proximal nephron. Am J Physiol Regul Integr Comp Physiol. 2001;281:R861–R867. doi: 10.1152/ajpregu.2001.281.3.R861. [DOI] [PubMed] [Google Scholar]
- 32.Mariappan MM, Shetty M, Sataranatarajan K, et al. Glycogen Synthase Kinase 3{beta} is a novel regulator of high glucose- and high insulin-induced extracellular matrix protein synthesis in renal proximal tubular epithelial cells. J Biol Chem. 2008;283:30566–30575. doi: 10.1074/jbc.M801756200. [DOI] [PMC free article] [PubMed] [Google Scholar]
- 33.Gong R, Ge Y, Chen S, et al. Glycogen synthase kinase 3beta: a novel marker and modulator of inflammatory injury in chronic renal allograft disease. Am J Transplant. 2008;8:1852–1863. doi: 10.1111/j.1600-6143.2008.02319.x. [DOI] [PubMed] [Google Scholar]
- 34.Vilimek D, Duronio V. Cytokine-stimulated phosphorylation of GSK-3 is primarily dependent upon PKCs, not PKB. Biochem Cell Biol. 2006;84:20–29. doi: 10.1139/o05-154. [DOI] [PubMed] [Google Scholar]
- 35.de Gasparo M, Catt KJ, Inagami T, et al. International union of pharmacology. XXIII. The angiotensin II receptors. Pharmacol Rev. 2000;52:415–472. [PubMed] [Google Scholar]
- 36.Mehta PK, Griendling KK. Angiotensin II cell signaling: physiological and pathological effects in the cardiovascular system. Am J Physiol Cell Physiol. 2007;292:C82–C97. doi: 10.1152/ajpcell.00287.2006. [DOI] [PubMed] [Google Scholar]
- 37.Gorin Y, Ricono JM, Wagner B, et al. Angiotensin II-induced ERK1/ERK2 activation and protein synthesis are redox-dependent in glomerular mesangial cells. Biochem J. 2004;381:231–239. doi: 10.1042/BJ20031614. [DOI] [PMC free article] [PubMed] [Google Scholar]
- 38.Min LJ, Mogi M, Li JM, et al. Aldosterone and angiotensin II synergistically induce mitogenic response in vascular smooth muscle cells. Circ Res. 2005;97:434–442. doi: 10.1161/01.RES.0000180753.63183.95. [DOI] [PubMed] [Google Scholar]
- 39.Li XC, Zhuo JL. Selective knockdown of AT1 receptors by RNA interference inhibits Val5-Ang II endocytosis and NHE-3 expression in immortalized rabbit proximal tubule cells. Am J Physiol Cell Physiol. 2007;293:C367–C378. doi: 10.1152/ajpcell.00463.2006. [DOI] [PMC free article] [PubMed] [Google Scholar]
- 40.Li XC, Hopfer U, Zhuo JL. AT1 receptor-mediated uptake of angiotensin II and NHE-3 expression in proximal tubule cells through the microtubule-dependent endocytic pathway. Am J Physiol Renal Physiol. 2009;297:F1342–F1352. doi: 10.1152/ajprenal.90734.2008. [DOI] [PMC free article] [PubMed] [Google Scholar]
- 41.Zhai P, Gao S, Holle E, et al. Glycogen synthase kinase-3alpha reduces cardiac growth and pressure overload-induced cardiac hypertrophy by inhibition of extracellular signal-regulated kinases. J Biol Chem. 2007;282:33181–33191. doi: 10.1074/jbc.M705133200. [DOI] [PubMed] [Google Scholar]
- 42.Yip KP, Tse CM, McDonough AA, et al. Redistribution of Na+/H+ exchanger isoform NHE3 in proximal tubules induced by acute and chronic hypertension. Am J Physiol. 1998;275:F565–F575. doi: 10.1152/ajprenal.1998.275.4.F565. [DOI] [PubMed] [Google Scholar]
- 43.Leong PK, Yang LE, Holstein-Rathlou NH, et al. Angiotensin II clamp prevents the second step in renal apical NHE3 internalization during acute hypertension. Am J Physiol Renal Physiol. 2002;283:F1142–F1150. doi: 10.1152/ajprenal.00178.2002. [DOI] [PubMed] [Google Scholar]
- 44.Karim ZG, Chambrey R, Chalumeau C, et al. Regulation by PKC isoforms of Na(+)/H(+) exchanger in luminal membrane vesicles isolated from cortical tubules. Am J Physiol. 1999;277:F773–F778. doi: 10.1152/ajprenal.1999.277.5.F773. [DOI] [PubMed] [Google Scholar]
- 45.Li XC, Navar LG, Shao Y, et al. Genetic deletion of AT1a receptors attenuates intracellular accumulation of angiotensin II in the kidney of AT1a receptor-deficient mice. Am J Physiol Renal Physiol. 2007;293:F586–F593. doi: 10.1152/ajprenal.00489.2006. [DOI] [PMC free article] [PubMed] [Google Scholar]
- 46.Li XC, Shao Y, Zhuo JL. AT1a receptor knockout in mice impairs urine concentration by reducing basal vasopressin levels and its receptor signaling proteins in the inner medulla. Kidney Int. 2009;76:169–177. doi: 10.1038/ki.2009.134. [DOI] [PMC free article] [PubMed] [Google Scholar]
- 47.Vinay P, Gougoux A, Lemieux G. Isolation of a pure suspension of rat proximal tubules. Am J Physiol. 1981;241:F403–F411. doi: 10.1152/ajprenal.1981.241.4.F403. [DOI] [PubMed] [Google Scholar]
- 48.Li XC, Zhuo JL. In vivo regulation of AT1a receptor-mediated intracellular uptake of [125I]-Val5-angiotensin II in the kidneys and adrenal glands of AT1a receptor-deficient mice. Am J Physiol Renal Physiol. 2008;294:F293–F302. doi: 10.1152/ajprenal.00398.2007. [DOI] [PMC free article] [PubMed] [Google Scholar]
- 49.Hu JH, Zhang H, Wagey R, et al. Protein kinase and protein phosphatase expression in amyotrophic lateral sclerosis spinal cord. J Neurochem. 2003;85:432–442. doi: 10.1046/j.1471-4159.2003.01670.x. [DOI] [PubMed] [Google Scholar]
- 50.Pelech S, Jelinkova L, Susor A, et al. Antibody microarray analyses of signal transduction protein expression and phosphorylation during porcine oocyte maturation. J Proteome Res. 2008;7:2860–2871. doi: 10.1021/pr800082a. [DOI] [PubMed] [Google Scholar]
Associated Data
This section collects any data citations, data availability statements, or supplementary materials included in this article.
Supplementary Materials
Figure S1. Effects of the pressor dose of Ang II and concurrent losartan treatment on proximal tubular phospho-PKCα/βII [T638/T641] and phospho-PKCδ [T507] signaling proteins.
Figure S2. Effects of the pressor dose of Ang II and concurrent losartan treatment on proximal tubular phospho-ERK1/2 signaling proteins.
Figure S3. Effects of the pressor dose of Ang II and concurrent losartan treatment on proximal tubular NHE-3 mRNA expression.
Figure S4. Effects of the non-pressor dose of Ang II and concurrent losartan treatment on proximal tubular AT1 receptor proteins.
Figure S5. Phase-contrast micrographs of freshly isolated rat proximal tubules.
Figure S6. Effect of the pressor dose of Ang II on proximal tubular phosphorylated c-Jun [S73] immunofluorescence staining.
Figure S7. Effect of the pressor dose of Ang II on proximal tubular phosphorylated Src [Y418] immunofluorescences staining.
Figure S8. Effect of the pressor dose of Ang II on proximal tubular phosphorylated c-Jun[Y529] immunofIuorescence staining.
Figure S9. Effect of the pressor dose of Ang II on proximal tubular phosphorylated Rb [807+S811] immunofluorescence staining.
Figure S10. Effect of the pressor dose of Ang II on proximal tubular phosphorylated STAT-3[S727] immunofluorescence staining.


