Abstract
Top-down proteomics has improved over the last decade despite the significant challenges presented by the analysis of large protein ions. Here, the detection of these high mass species by electrospray-based mass spectrometry (MS) is examined from a theoretical perspective to understand the mass-dependent increases in the number of charge states, isotopic peaks, and interfering species present in typical protein mass spectra. Integrating these effects into a quantitative model captures the reduced ability to detect species over 25 kDa with the speed and sensitivity characteristic of proteomics based on <3 kDa peptide ions. The model quantifies the challenge that top-down proteomics faces with respect to current MS instrumentation and projects that depletion of 13C and 15N isotopes can improve detection at high mass by only <2-fold at 100 kDa whereas the effect is up to 5-fold at 10 kDa. Further, we find that supercharging electrosprayed proteins to the point of producing <5 charge states at high mass would improve detection by more than 20 fold.
Introduction
In recent years, mass spectrometry-based proteomics for the analysis of whole protein molecules (i.e., no proteolysis) has realized major improvements in the number of identifications and characterizations resulting from a single LC-MS run1, 2. Front-end separations1, 3-7, back-end computational tools8, 9 and more advanced instrumentation4 have been largely responsible for these improvements. In our laboratory, mass spectrometric instrumentation now stands as a major barrier to further advancing top-down methodologies. Here, we study how the challenge presented by electrosprayed protein ions scales with molecular weight and extrapolate our findings to prioritize the research directions that would be most likely to result in improvements of proteome coverage for top-down proteomics of complex mixtures.
Mass spectrometers are all limited to varying extents by the number of charges that can be analyzed simultaneously. As protein (peptide) masses increase, the number of channels amongst which this “pool” of charge is split also increases. The major channels are a result of an increased number of charge states (from Electrospray Ionization, ESI) as well as heavy isotopes at higher precursor mass. Further, the potential for interfering species as well as solvent adduction also increases with mass. All of these channels split the fixed number of charges present in a single scan and hinder detection at high mass.
High mass species, even if detected, may still suffer when analyzed by common data reduction algorithms. In nearly all cases, data is analyzed via the use of THRASH10 or deconvolution11-13. Analysis of resolved isotopic distributions of intact or fragment ions to <1 Da accuracy relies on a close match between the experimental and theoretical data14, 15. For small molecules, this condition is easily met not only because the charge pool is split by so few species but also because the charge states are low. Charge is drawn from the charge “pool” in quantized amounts that correspond to the charge state of the species being populated. If the charge pool is sufficiently split and the charge states of the species present in the spectrum are sufficiently high, single ions become visible as quantization in the intensities of species present in the spectrum. This quantization may result in large deviations of observed peak intensities from ideal isotopic distributions in a single scan, rendering algorithms such as THRASH susceptible to discontinuous errors (integers of 1 dalton) or even unable to assign mass values reliably. Thus, averaging of spectra or summing of transients becomes necessary for mass assignment to <1 Da and robust protein identification.
Top-down proteomics typically utilizes high-resolution instrumentation to make protein/peptide identifications from an accurate precursor mass coupled with isotopically resolved fragment ions. In general, this limits top-down proteomics to time-of-flight (TOF) and Fourier transform-based (FT) instruments. As Hofstadler et al. demonstrated, isotopes generate beat patterns in the transients of FT-based instruments16. The increasing number of isotopes present at higher mass results in the isotopic beats becoming more narrow and spaced further apart in the time domain. Thus, these species are fundamentally more difficult to detect in FT-based instruments. TOF instrumentation relies on micro channel plate (MCP) or secondary emission multipliers (SEM) coupled to analog to digital converters (ADC) or time to digital converters (TDC). These detection strategies are limited by how quickly the detection system can recover from the previous detection event and by loss of linearity in detection efficiency at high mass17. Thus, while TOF instrumentation is not limited by space charge considerations, the number of ions that may be analyzed simultaneously is still limited, making high mass species more difficult to detect. Although these challenges will not be examined here, they are worth noting.
To our knowledge, there has been little done in the way of an integrated, quantitative treatment of the factors affecting signal-to-noise values in mass spectrometry of multiply charged protein ions. We therefore constructed a model that describes the reduction in signal-to-noise with increasing mass to both describe the challenges that instrumentation for top-down proteomics faces and direct future research. The model derived here relies on one central concept: a fixed number of charges are used during a single scan in a trapping instrument (i.e., QLT, ICR, Orbitrap). Therefore, the channels amongst which this charge is distributed must be considered.
Experimental
Isotopic Distributions and S:N Calculation
The algorithm described by Rockwood et al. was used to generate theoretical isotopic distributions for species ranging from 10 – 100 kDa18. The isotopic distributions were truncated where the theoretical relative abundance of isotopic peaks fell below 1×10⁻⁴%. The distributions were then scaled to the most abundant isotope and the contribution from the most abundant isotope to the sum calculated. This percentage was compared to the number of charges specified for a scan and then converted to S:N by a relationship between S:N and number of charges. This process was then repeated for each isotopic depletion level following modification of the algorithm to allow calculation of isotopic distributions under depleted conditions. The depleted conditions used were: natural; 99.5% 12C; 99.9% 12C; 99.9% 12C 99.9% 14N; 99.95% 12C; 99.95% 12C 99.95% 14N; 99.99% 12C 99.95% 14N.
Sample Preparation and Mass Spectrometry
5 pmol/μl solutions of Ubiquitin (8.6 kDa), cytochrome C (12.3 kDa), myoglobin (16.9 kDa), carbonic anhydrase (29.0 kDa), and enolase (46.6 kDa) in 40% acetonitrile with 0.1% acetic acid were directly infused at 4.75 μL/min on a Q Exactive bench top mass spectrometer (Thermo Fisher Scientific, Bremen, Germany) with 3.2 kV spray voltage, capillary temperature of 320 °C, 4 units of sheath gas flow and no auxiliary gas flow. The instrument was operated with an S-lens value of 55 and at a resolution setting of 1,500 (@ m/z 400). All reagents were purchased from Sigma-Aldrich (St. Louis, MO) and used without further purification.
Results
Effect of Isotopic Peak Distributions
The contribution of heavy isotopes to the top-down measurement challenge can be dealt with entirely from isotope statistics. Utilizing averagine15, theoretical isotopic distributions can be calculated for any precursor mass as well as any isotopic depletion level. If a fixed number of charges are then distributed amongst the peaks in the distribution, the quantity of charge present in the most abundant isotope for different masses or different depletion levels can be used as a measure of the relative signal that would be observed in a mass spectrometer. As a means of anchoring these relative values, a relationship between S:N and the number of charges present in a peak must be determined. While this relationship will not be explored here, Limbach et al. determined this experimentally for a 3 Tesla FT-ICR19. This method assumes only thermal noise is present during detection. Subsequently, Makarov et al. utilized this method to determine the thermal noise caused by the amplifier of an orbitrap to be equivalent to 20 charges. However, the relationship determined by Limbach et al. provides a more conservative estimate of sensitivity for the purposes of this study. Thus, the S:N ratio may be related to the number of charges by the expression:
| (1) |
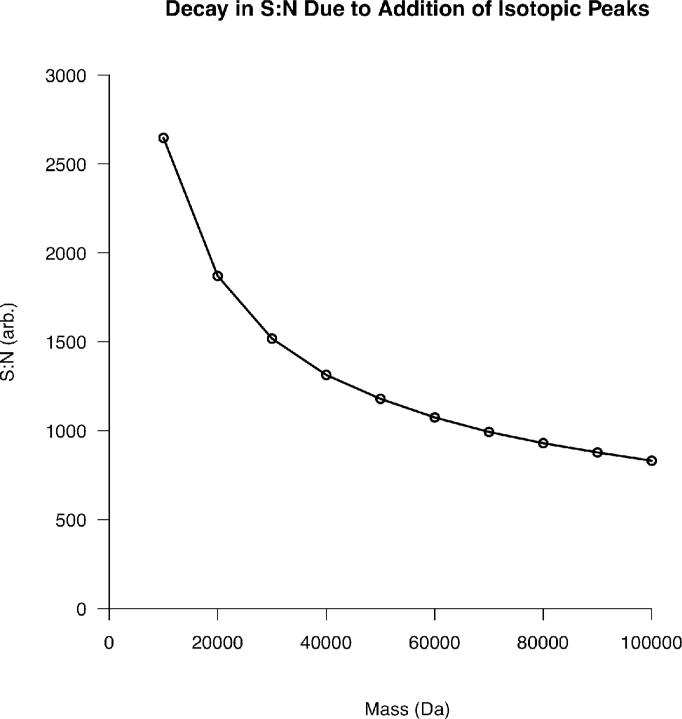
Utilizing this relationship, the number of charges present in the most abundant isotope may be expressed as S:N. Thus, the relationship between protein mass and S:N for any number of charges may be derived. This was performed for 1 million charges and the result is shown in Figure 1 below.
Figure 1.
The reduction in S:N for a single isotopic distribution populated by 1 million charges as a function of increasing protein mass. Ions were assumed to have a +1 charge state to eliminate contributions from charge state distributions created by ESI.
The reduction in S:N due to the presence of heavy isotopes of carbon, hydrogen, oxygen, nitrogen, and sulfur follows the relationship:
| (2) |
This behavior is expected. At higher mass, the S:N reducing effect of heavy isotopes becomes less dramatic because the additional isotopes contribute less to the total ion current than at low mass. This relationship shows a greater than 4-fold reduction in S:N from a 1 kDa to a 20 kDa species simply from the addition of isotopic peaks with increasing mass. It should be noted that, despite the negative effects on S:N, isotopic distributions at high mass have been considered for their possible analytical utility previously20.
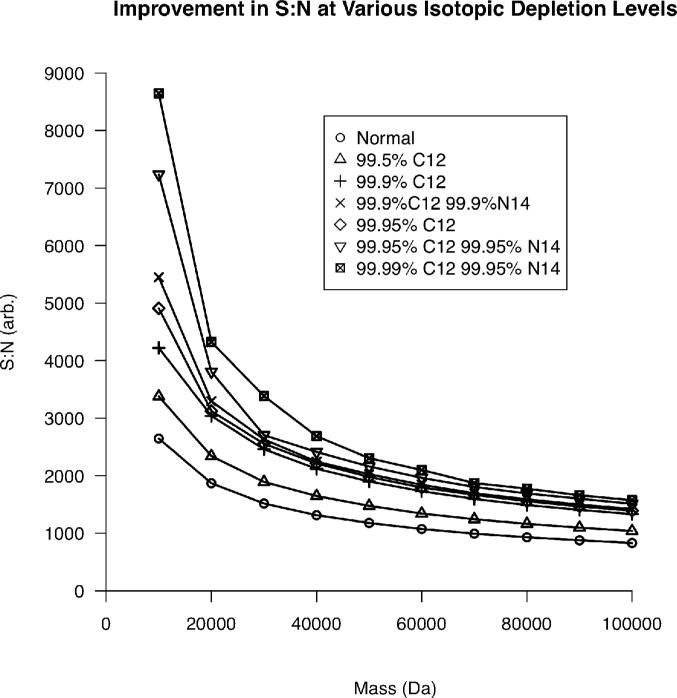
Utilizing a similar process, the improvement in S:N as a function of 13C, 15N double isotopic depletion21, 22 can be elucidated. Figure 2 demonstrates that at extreme 13C and 15N depletion levels, the S:N at 10 kDa is expected to increase by a factor of three. However, this gain is reduced to a factor of ~2 at 100 kDa. This surprising result can be understood by considering how isotopic distributions differ for 10 vs. 100 kDa species. At lower masses, a normal isotopic distribution contains relatively few components when compared to a distribution at higher mass. When the depletion level is increased, the heaviest isotopes in the distribution contribute their intensity to the remaining isotopes in the distribution. Therefore, at higher masses, the charge “depleted” from the heaviest isotopes still has many channels to be split amongst when compared to the equivalent depletion at lower masses, resulting in a larger increase in signal-to-noise for lower masses.
Figure 2.
The reduction in S:N as a function of increasing mass at various isotopic depletion levels for a single isotopic distribution.
Effect of Charge State Distributions
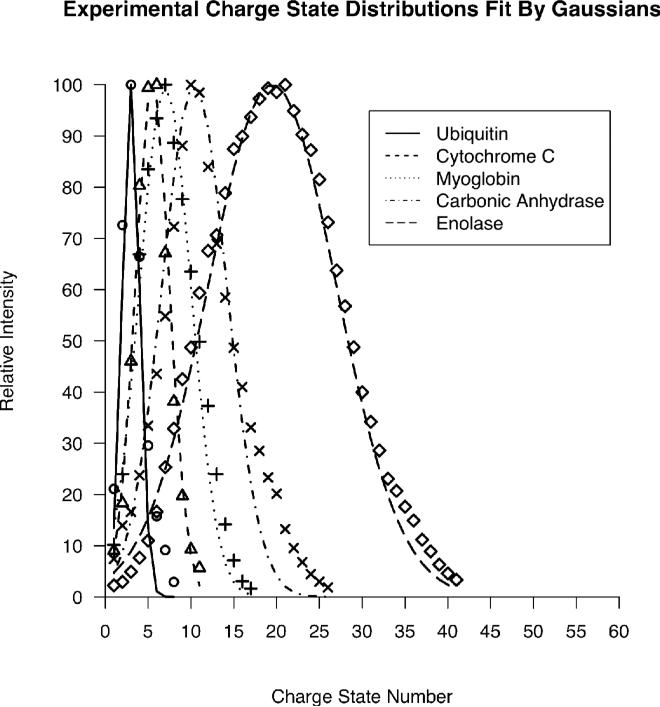
Charge states resulting from ESI also serve to split ion current in a mass spectrometer. The number of charge states and their distribution as a function of mass is dependent on many factors. Solvent polarity, pH, ambient pressure, supercharging additives and other parameters can alter charge state distributions23, 24. Therefore, the relationships between precursor mass, number of charge states and the distribution of charge state intensities must be determined experimentally for prototypical examples25. In this work, proteins from 8.6 kDa up to 47 kDa were used to model the evolution of charge state parameters as a function of mass. Figure 3 contains experimental charge state distributions normalized to the most intense charge state. The charge states were numbered in order of appearance (the highest observed charge state was labeled 1, the next 2, etc.) to eliminate the 1/z spacing of a standard charge state distribution. Each distribution was then fit by a simple Gaussian of the form:
| (3) |
where n is the charge state number, μ is the average charge state and σ is the standard deviation of the charge state distribution. The number of charge states as well as the mean and standard deviation of the Gaussian as a function of mass can then be derived, allowing the calculation of a theoretical charge state distribution for any precursor mass. The following expression is the result of this model:
| (4) |
Figure 3.
Experimental charge state distributions for proteins ranging from 8.6 – 47 kDa fit by Gaussian distributions.
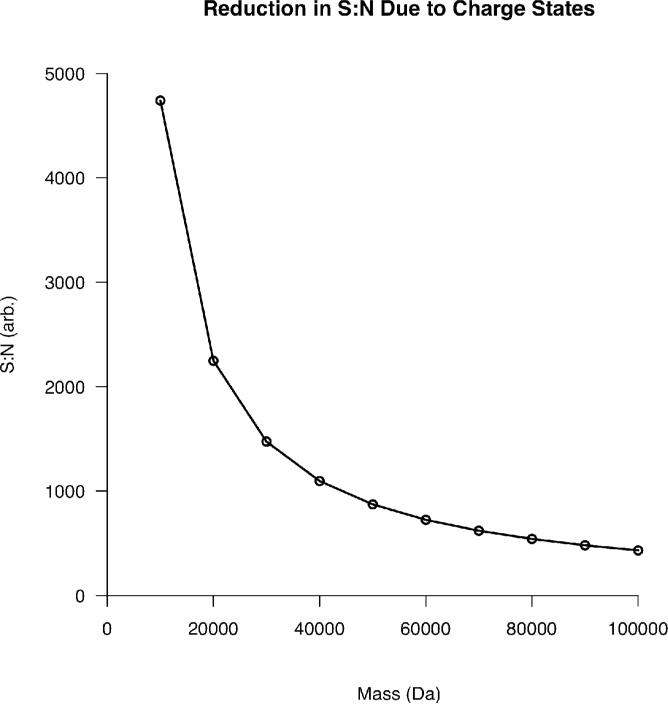
Charge state distributions can be treated similarly to isotopic distributions. A fixed number of charges can be distributed amongst the peaks in the distribution based on relative intensity, enabling the projection of S:N decrease for proteins of all mass values. The model used here is linear over the range of proteins used to derive it. However, by analogy with isotopic effects, one would expect the S:N dependence on charge states as a function of mass to evolve with a dependency like that observed in (2). This relationship is simply not seen within the mass range examined because the rate of addition of charge states as a function of mass is much lower when compared to the analogous isotopic behavior. Figure 4 was generated by distributing a target number of charges amongst the peaks in the predicted charge state distribution as singly charged ions. Again, this was done to eliminate any bias caused by charge quantization. By comparing Figures 1 and 4, it is evident that isotopic effects are more dominant at low mass whereas charge states begin to have a greater effect on S:N over 30 kDa.
Figure 4.
Decay in S:N as a function of increasing mass resulting from the increasing number of charge states observed for electrosprayed protein ions.
There are now several examples of “supercharging” in the literature26-30. While the results of these papers are encouraging, the level of supercharging accomplished is not enough to drastically impact detection of high mass species and, in some cases, overall signal is diminished by the supercharging additives. However, extreme supercharging holds the promise of large impacts on the analysis of high mass protein ions. From Figure 4, even if the charge state distribution present for a 10 kDa protein could be accomplished at 100 kDa, the benefit in S:N is ~10 fold assuming no overall loss in signal. If the charge state envelope could be further reduced to 4-5 charge states, the gains in S:N would be ~20 fold at 100 kDa. This is based on the combined model considering both isotopes and charge states where the number of charge states was limited to 5 instead of the predicted number of 86 at 100 kDa.
Combined Effects of Isotopes and Charge States
Using the expressions for charge states and isotopes, the two effects may be combined to demonstrate the overall performance of an analysis as a function of precursor mass. The intensities determined from the charge state distribution can be used to scale the corresponding isotopic distributions. Then, the charges can be distributed amongst all peaks. The most abundant isotope in the most abundant charge state then defines the S:N of the scan. Through relation (1), the S:N may be expressed as a function of precursor mass.
Figure 5 may be generated via the evaluation of the following expression:
| (5) |
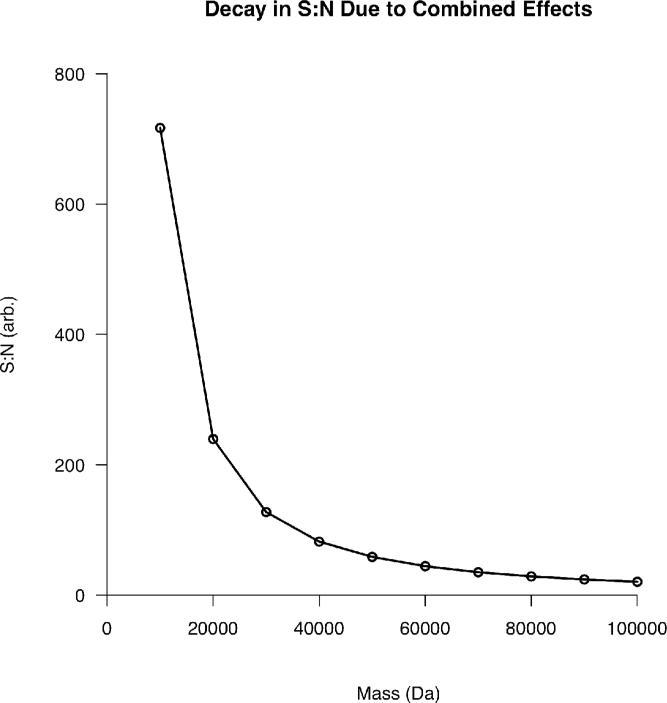
(5) is an empirical expression relating the number of charges utilized in a scan (target) and the sensitivity of the instrument's detector (see (1)) to the S:N as a function of mass (in Da). This expression is valid for normal isotopic abundances and standard micro-ESI spray conditions from 10 – 100 kDa. The upper bound of the sum is to be rounded to the nearest integer. Within the sum, the expression for the charge state model is again visible (4). It is multiplied by the isotopic model then summed. Essentially, this is scaling the combined intensities of the isotopic distributions by the relative intensity of each charge state then summing over the charge states in the distribution. Since both the charge state and isotopic models are normalized to one, the peak defining the S:N of the scan will have a relative abundance of one. Thus, the inverse of the sum is the percent of the total ion current present in the base peak. Modifying this value by the target value and the sensitivity of the instrument then results in the S:N for a particular mass. With more complete models for isotopic depletion and ESI charge state distributions, much of the empirical nature of this expression can be eliminated.
Figure 5.
The combined effect of isotopes and charge states on S:N as a function of protein mass.
The commonality in all of these graphs is the marked reduction in S:N that occurs around 20-30 kDa. Despite this, Figure 5 indicates that even species as high in mass as 100 kDa should theoretically be detectable at a S:N of ~20 in the absence of chemical noise. Thus, chemical noise further contributes to a loss in S:N.
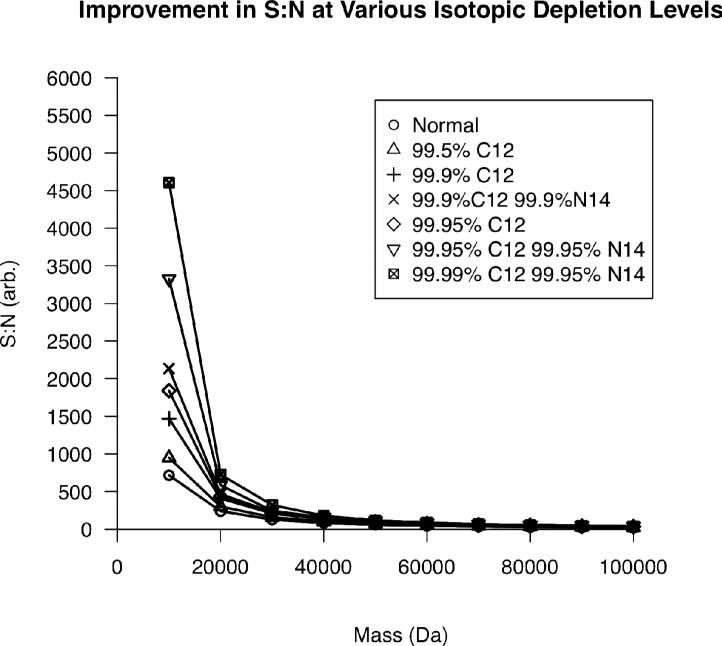
The effects of isotopic depletion within the combined model may also be explored. Figure 6 demonstrates the reduction in S:N as a function of mass for various isotopic depletion levels when considering charge states as well. Here, the statement that isotopic effects play a more dominant role at low mass whereas charge state effects reduce S:N more greatly at high mass is again demonstrated. For lower masses, extreme isotopic depletion provides even more benefit to S:N when considered in the context of ESI generated charge states. However, when moving to high mass, this benefit is again lost when charge state effects begin to dominate.
Figure 6.
The effect of isotopic depletion when considered with charge state distributions.
Effect of Chemical Noise
The topic of chemical noise is very complex and must be simplified to allow modeling. As a first approximation, chemical noise can be divided into two categories. Given a totally pure protein; multimers, solvent adducts and unintended source fragmentation may all contribute to chemical noise. To this noise is added the complexity of biological heterogeneity. Multiply charged adduct ions31, 32, non-covalent multimers33, 34, and interfering species all compete with the protein of interest for charge. Here we assume this type of noise to be mass dependent. The identity of the second type of noise is related to solvent and analyte clustering with cations or anions present in the electrospray solution35. This noise is ever-present and fairly constant during an analysis. In considering how to model noise, it is necessary to note that the chemical noise essentially removes an amount of charge from the initial charge pool. Therefore, a simple linear reduction in the initial charge pool may be used to align theory with experiment. The y-int would then be the reduction in the charge pool from the constant chemical noise and the slope would be the linear reduction due to the charge contained in adducted and interfering species.
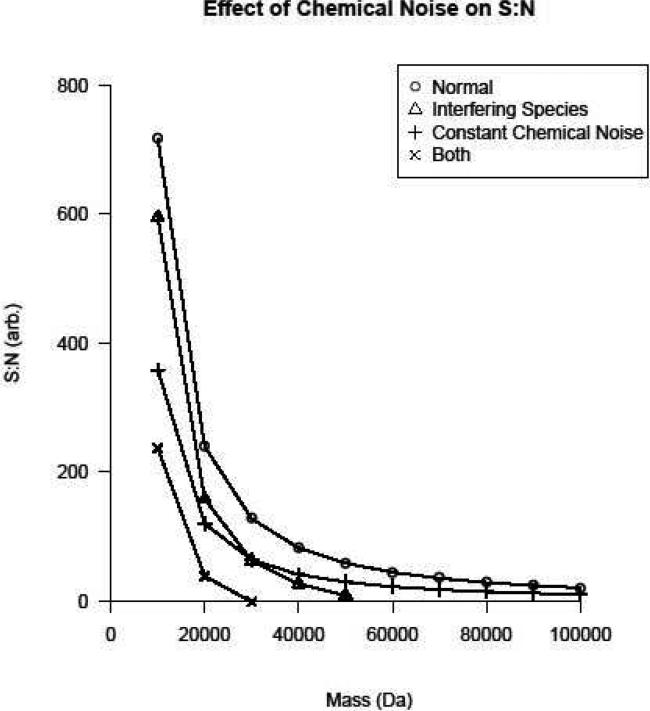
Figure 7 contains the S:N curves resulting from various types of noise. For the constant chemical noise, 50% of the target value was arbitrarily assigned to noise and the curve regenerated. Thus, the curve is simply half the magnitude of the noiseless case. The interfering species curve was generated by assuming a slope of 17 charges/Dalton. This value was chosen so that, in the combined curve, proteins beyond 30 kDa were below detectable limits. This aligns with the authors’ experience with top-down proteomics analyses. Following the subtraction of this charge from the target value of 1e6 charges at each mass, the S:N was again calculated as described previously. The same slope and intercept were used for the combined curve.
Figure 7.
The contribution of various types of chemical noise to the reduction in S:N as a function of precursor mass.
These results may be related to typical performance characteristics of ICR instrumentation. If one assumes that, during a typical online LC/MS experiment, one million charges results in a S:N of ~200-400 in a 7 Tesla FT-ICR for ubiquitin (8.6 kDa), then by examining Figure 7, it becomes apparent that chemical noise is severely limiting to detection at high mass. If the constant chemical noise is adjusted such that the predicted S:N at 10 kDa is 200, species as high as 100 kDa would still have S:N > 3. However, upon the addition of interfering species, this situation deteriorates rapidly for high mass species as evidenced by the combined curve in Figure 7. While the depth of knowledge about the nature and properties of chemical noise makes a rigorous analytical treatment difficult, the argument presented here is sufficient to demonstrate the effects of chemical noise on detection at high mass.
A complete treatment of tandem MS is beyond the scope of this manuscript, but fragment ions will be governed in a similar manner as the effect resulting from additional isotopes. Increased precursor mass also results in more fragmentation channels. Again, the charge “pool” will be split amongst all fragment ions present. Further, if charge reduction or neutral loss become dominant channels, the amount of charge present in the fragment ions may be greatly reduced due to the charge that remains in these species. Thus, tandem MS presents yet another challenge to top down proteomics.
From the treatments above, one can see that current instruments should be able to provide high quality MS1 spectra on proteins up to 25 kDa. However, above 25 kDa, spectral averaging becomes necessary due to charge quantization and chemical noise. Also, it is shown here that isotopic depletion by 13C, 15N-double depletion21 improve signal acquisition by a factor of 5 below 40 kDa and a factor of <2 in the 50-80 kDa regime when considered with charge state distributions.
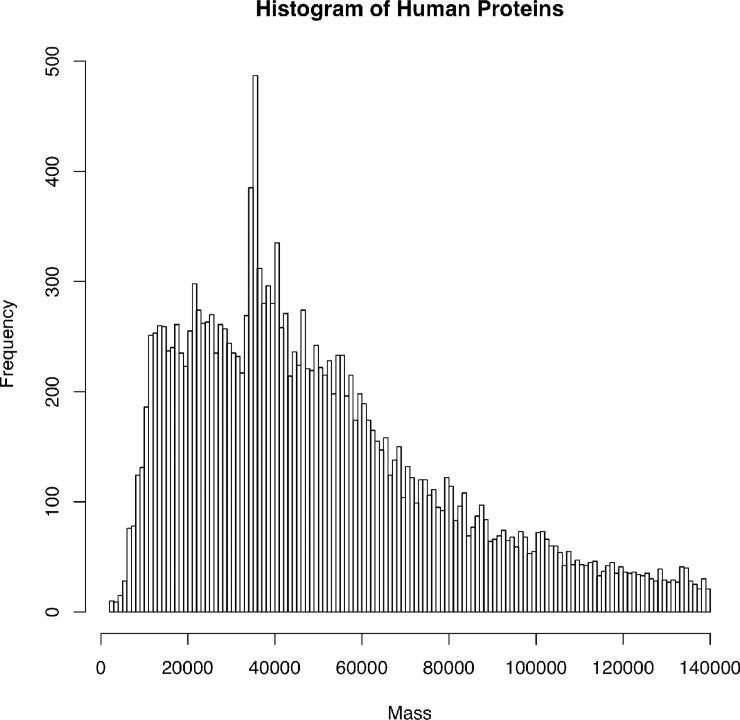
The relevance of these findings to biological mass spectrometry can be found in the distribution of the number of proteins expressed vs. mass in the human proteome. Figure 8 depicts this distribution by plotting all human proteins <140 kDa in the UniProt Knowledgebase as a histogram. Surely, modifications such as ubiquitinylation, glycosylation, sumoylation and neddylation will shift this distribution higher, while endogenous proteolysis will shift it lower. However, it is apparent that the single scan detection limit of ~25 kDa for isotopic resolved spectra using 1e6 charges in a 7 Tesla FTICR is severely limiting in terms of whole proteome coverage during LC-MS analyses. Luckily, spectral averaging serves to increase this limit but comes at the cost of acquisition time. Thus, dynamic range is reduced in the context of online LC/MS. In fact, identifications over 25 kDa in our lab are mainly a result of utilizing spectral averaging or unit resolution for MS1 detection.
Figure 8.
Histogram of protein sizes in the human proteome. Plot was created using 18,852 entries for Homo sapiens using the Uniprot Knowledgebase released on April 4, 2011 and the bin size is 1,000 dalton.
When constructing MS instruments, the quantitative models presented here will help guide instrument specifications. The experimental requirements those, in some aspects, are drastically different from bottom-up proteomics, position top down proteomics as a major frontier in the future of mass spectrometer design. While current levels of supercharging and isotopic depletion in combination can provide large improvements in S: N at high mass, instruments that can simultaneously analyze a larger population of ions would provide the greatest and most easily realized benefit to top down proteomics. In addition, separation strategies capable of eliminating or reducing interfering species will be a top priority to the future of top down mass spectrometry.
Acknowledgement
We would like to thank Mike Senko for helpful conversations and all those who contributed to the development of Top Down Mass Spectrometry along with Northwestern University and The Chicago Biomedical Consortium with support from The Searle Funds at the Chicago Community Trust. We further acknowledge the Institute on Drug Abuse (DA 026672) and the Institute for General Medical Sciences at the National Institutes of Health (GM 067193-09), whose combined investment has made accelerated progress toward the realization of Top Down Proteomics.
References
- 1.Lee JE, Kellie JF, Tran JC, Tipton JD, Catherman AD, Thomas HM, Ahlf DR, Durbin KR, Vellaichamy A, Ntai I, Marshall AG, Kelleher NL. J Am Soc Mass Spectrom. 2009;20:2183–2191. doi: 10.1016/j.jasms.2009.08.001. [DOI] [PMC free article] [PubMed] [Google Scholar]
- 2.Bunger MK, Cargile BJ, Ngunjiri A, Bundy JL, Stephenson JL., Jr. Anal Chem. 2008;80:1459–1467. doi: 10.1021/ac7018409. [DOI] [PubMed] [Google Scholar]
- 3.Meng F, Du Y, Miller LM, Patrie SM, Robinson DE, Kelleher NL. Anal Chem. 2004;76:2852–2858. doi: 10.1021/ac0354903. [DOI] [PubMed] [Google Scholar]
- 4.Parks BA, Jiang L, Thomas PM, Wenger CD, Roth MJ, Boyne MT, 2nd, Burke PV, Kwast KE, Kelleher NL. Anal Chem. 2007;79:7984–7991. doi: 10.1021/ac070553t. [DOI] [PMC free article] [PubMed] [Google Scholar]
- 5.Sharma S, Simpson DC, Tolic N, Jaitly N, Mayampurath AM, Smith RD, Pasa-Tolic L. J Proteome Res. 2007;6:602–610. doi: 10.1021/pr060354a. [DOI] [PubMed] [Google Scholar]
- 6.Tran JC, Doucette AA. Anal Chem. 2008;80:1568–1573. doi: 10.1021/ac702197w. [DOI] [PubMed] [Google Scholar]
- 7.Wall DB, Kachman MT, Gong S, Hinderer R, Parus S, Misek DE, Hanash SM, Lubman DM. Anal Chem. 2000;72:1099–1111. doi: 10.1021/ac991332t. [DOI] [PubMed] [Google Scholar]
- 8.Durbin KR, Tran JC, Zamdborg L, Sweet SM, Catherman AD, Lee JE, Li M, Kellie JF, Kelleher NL. Proteomics. 2010;10:3589–3597. doi: 10.1002/pmic.201000177. [DOI] [PMC free article] [PubMed] [Google Scholar]
- 9.Leduc RD, Kelleher NL. Curr Protoc Bioinformatics. 2007 doi: 10.1002/0471250953.bi1306s19. Chapter 13, Unit 13 16. [DOI] [PubMed] [Google Scholar]
- 10.Horn DM, Zubarev RA, McLafferty FW. J Am Soc Mass Spectrom. 2000;11:320–332. doi: 10.1016/s1044-0305(99)00157-9. [DOI] [PubMed] [Google Scholar]
- 11.Covey TR, Bonner RF, Shushan BI, Henion J. Rapid Commun Mass Spectrom. 1988;2:249–256. doi: 10.1002/rcm.1290021111. [DOI] [PubMed] [Google Scholar]
- 12.Fenn JB, Mann M, Meng CK, Wong SF, Whitehouse CM. Science. 1989;246:64–71. doi: 10.1126/science.2675315. [DOI] [PubMed] [Google Scholar]
- 13.Zhang Z, Marshall AG. J Am Soc Mass Spectrom. 1998;9:225–233. doi: 10.1016/S1044-0305(97)00284-5. [DOI] [PubMed] [Google Scholar]
- 14.Beu SC, Senko MW, Quinn JP, Mclafferty FW. Journal of the American Society for Mass Spectrometry. 1993;4:190–192. doi: 10.1016/1044-0305(93)85077-B. [DOI] [PubMed] [Google Scholar]
- 15.Senko MW, Beu SC, Mclafferty FW. Journal of the American Society for Mass Spectrometry. 1995;6:229–233. doi: 10.1016/1044-0305(95)00017-8. [DOI] [PubMed] [Google Scholar]
- 16.Hofstadler SA, Bruce JE, Rockwood AL, Anderson GA, Winger BE, Smith RD. International Journal of Mass Spectrometry. 1994;132:109–127. [Google Scholar]
- 17.Westmacott G, Frank M, Labov SE, Benner WH. Rapid Communications in Mass Spectrometry. 2000;14:1854–1861. doi: 10.1002/1097-0231(20001015)14:19<1854::AID-RCM102>3.0.CO;2-M. [DOI] [PubMed] [Google Scholar]
- 18.Rockwood AL, Vanorden SL, Smith RD. Analytical Chemistry. 1995;67:2699–2704. [Google Scholar]
- 19.Limbach PA, Grosshans PB, Marshall AG. Analytical Chemistry. 1993;65:135–140. [Google Scholar]
- 20.Yergey J, Heller D, Hansen G, Cotter RJ, Fenselau C. Analytical Chemistry. 1983;55:353–356. [Google Scholar]
- 21.Marshall AG, Senko MW, Li WQ, Li M, Dillon S, Guan SH, Logan TM. Journal of the American Chemical Society. 1997;119:433–434. [Google Scholar]
- 22.Xiong Y, Schroeder K, Greenbaum NL, Hendrickson CL, Marshall AG. Anal Chem. 2004;76:1804–1809. doi: 10.1021/ac030299e. [DOI] [PubMed] [Google Scholar]
- 23.Iavarone AT, Jurchen JC, Williams ER. J Am Soc Mass Spectrom. 2000;11:976–985. doi: 10.1016/S1044-0305(00)00169-0. [DOI] [PMC free article] [PubMed] [Google Scholar]
- 24.Chen LC, Mandal MK, Hiraoka K. J Am Soc Mass Spectrom. 22:539–544. doi: 10.1007/s13361-010-0058-8. [DOI] [PubMed] [Google Scholar]
- 25.Dobo A, Kaltashov IA. Anal Chem. 2001;73:4763–4773. doi: 10.1021/ac010713f. [DOI] [PubMed] [Google Scholar]
- 26.Iavarone AT, Jurchen JC, Williams ER. Anal Chem. 2001;73:1455–1460. doi: 10.1021/ac001251t. [DOI] [PMC free article] [PubMed] [Google Scholar]
- 27.Loo JA, Edmonds CG, Udseth HR, Smith RD. Anal Chem. 1990;62:693–698. doi: 10.1021/ac00206a009. [DOI] [PubMed] [Google Scholar]
- 28.Loo JA, Udseth HR, Smith RD. Biomedical and Environmental Mass Spectrometry. 1988;17:411–414. [Google Scholar]
- 29.Valeja SG, Tipton JD, Emmett MR, Marshall AG. Anal Chem. 2010;82:7515–7519. doi: 10.1021/ac1016858. [DOI] [PMC free article] [PubMed] [Google Scholar]
- 30.Sterling HJ, Cassou CA, Trnka MJ, Burlingame AL, Krantz BA, Williams ER. Phys Chem Chem Phys. doi: 10.1039/c1cp20277d. [DOI] [PMC free article] [PubMed] [Google Scholar]
- 31.Gardner MW, Brodbelt JS. J Am Soc Mass Spectrom. 2009;20:2206–2210. doi: 10.1016/j.jasms.2009.08.008. [DOI] [PubMed] [Google Scholar]
- 32.Loo JA, Udseth HR, Smith RD. Rapid Commun. Mass Spectrom. 1988;2:207–210. [Google Scholar]
- 33.Counterman AE, Hilderbrand AE, Barnes CAS, Clemmer DE. Journal of the American Society for Mass Spectrometry. 2001;12:1020–1035. [Google Scholar]
- 34.Lightwahl KJ, Schwartz BL, Smith RD. Journal of the American Chemical Society. 1994;116:5271–5278. [Google Scholar]
- 35.Cech NB, Enke CG. Mass Spectrometry Reviews. 2001;20:362–387. doi: 10.1002/mas.10008. [DOI] [PubMed] [Google Scholar]


