Abstract
Purpose
To compare vitreoretinal pathology imaged with portable handheld spectral domain optical coherence tomography (SDOCT) to conventional indirect ophthalmoscopic (IO) examination in neonates undergoing screening for retinopathy of prematurity (ROP).
Methods
SDOCT images were collected from 76 eyes of 38 neonates during 118 routine ROP examinations. Imaging sessions in the neonatal intensive care unit were performed immediately after the subjects underwent a standard ophthalmic examination with IO by a pediatric ophthalmologist. Masked certified SDOCT graders evaluated scans for preretinal and retinal findings including material in the vitreous, epiretinal membrane, intraretinal cystoid structures and deposits, optic nerve and vascular features, as well as severity and location of ROP. The frequency of detection of these features by clinical examination and evaluation of SDOCT images was compared to determine potential clinical advantages for each modality.
Results
Portable SDOCT imaging characterized macular features of retinal cystoid structures in 39% of exams and epiretinal membrane in 32% of exams. Neither feature was visualized by indirect ophthalmoscopy in any cases. The clinician using indirect ophthalmoscopy detected stage of ROP and the presence or absence of plus or pre-plus disease. These were not visualized with SDOCT.
Conclusions
SDOCT provides new information about the premature infant retina that is of unknown importance relative to visual development and acuity. As used in this study, SDOCT does not replace indirect ophthalmoscopy for evaluation of ROP.
Keywords: Macular edema, Premature neonates, ROP, SDOCT, Visual development
Retinopathy of prematurity (ROP) remains a major cause of vision loss in neonates despite advances in treatment [1, 2]. Examination of the retina with indirect ophthalmoscopy has been the gold standard for the evaluation of neonates at risk for ROP [3]. However, imaging technology has progressed to allow detection of pathologic findings not evident on conventional clinical examination [4]. The ability to identify clinical features that herald fibrovascular proliferation and subsequent risk for subsequent retinal detachment may lead to earlier intervention and improved visual outcomes.
Optical coherence tomography (OCT) has become a standard diagnostic imaging tool in the management of macular disease in adults [5]. Applications of OCT to the pediatric population have been limited by patient motion and positioning. Modifications to this modality have led to the development of a portable hand-held SDOCT unit (Bioptigen, Inc., Research Triangle Park, North Carolina) that has been optimized for use in neonates, infants and children [6]. This system has been used to successfully image infants with shaken baby syndrome and children with albinism [7, 8]. More recently, imaging of three ROP infants with this device revealed posterior retinal pathologic findings such as preretinal structures, retinoschisis and retinal detachment that were not observed clinically [4]. These preretinal structures may represent posterior neovascularization such as with aggressive posterior retinopathy of prematurity or incomplete regression of the hyaloid [9].
SDOCT is a rapid and well-tolerated modality that offers the advantages of quantitative, reproducible, and 3-dimensional cross-sectional assessment of retinal pathology. While indirect ophthalmoscopy or color fundus imaging will likely remain advantageous in many aspects, we hypothesize that SDOCT imaging may be more sensitive than standard indirect ophthalmoscopy in detecting critical early vitreoretinal abnormalities in the developing eye. This additional information may optimize timing of treatment and visual outcomes, and augment current practices of ROP evaluation.
Methods
Patient Selection
Eligible subjects included all infants in the Neonatal Intensive Care Unit (NICU) undergoing routine ROP screening by Duke pediatric ophthalmologists (SFF and DKW) between January 20, 2009 and January 12, 2010, using standard screening criteria. Medical clearance to participate in this study was first obtained from the neonatologist, and consent for the study was obtained from parents or legal guardians in accordance with the Duke University Medical Center Institutional Review Board. The study conformed to the tenets of the Declaration of Helsinki. Data Collection
Imaging was performed in study subjects following clinical examination by pediatric ophthalmologists as part of the standard of care for ROP screenings. Both pupils had been dilated with cyclomydril (cyclopentolate 0.2% and phenylephrine 1.0%). In most cases during imaging, the eyelids were held open by the examiner using two fingers, although a lid speculum was used when needed. Artificial tears (Systane, Alcon Inc., Fort Worth, TX) were applied topically to improve the corneal surface and enhance imaging. Oral sucrose 24% 0.5 mL with pacifier was used to decreased infant stress as reported in previous studies [10, 11]. Image acquisition time was limited to 15 minutes with monitoring of vital signs every minute. If monitoring indicated a change in health status, defined as a deviation of heart rate, respiratory rate, or oxygen saturation of greater than 20% from baseline, study imaging was stopped until these stabilized. If a second change in health status occurred, the study imaging session was stopped. The nurse was queried one to two hours following imaging for adverse events such as apnea, bradycardia, desaturation and feeding problems that may have been related to the imaging session.
All subjects were imaged in a supine position using a non-contact portable handheld SDOCT system (Bioptigen Inc., Research Triangle Park, North Carolina) optimized for pediatric use [6] (Figure 1). Capture and analysis of SDOCT images were perfomed in a manner similar to a protocol described previously using volumetric and lateral-repeated scanning techniques [7].
Figure 1.
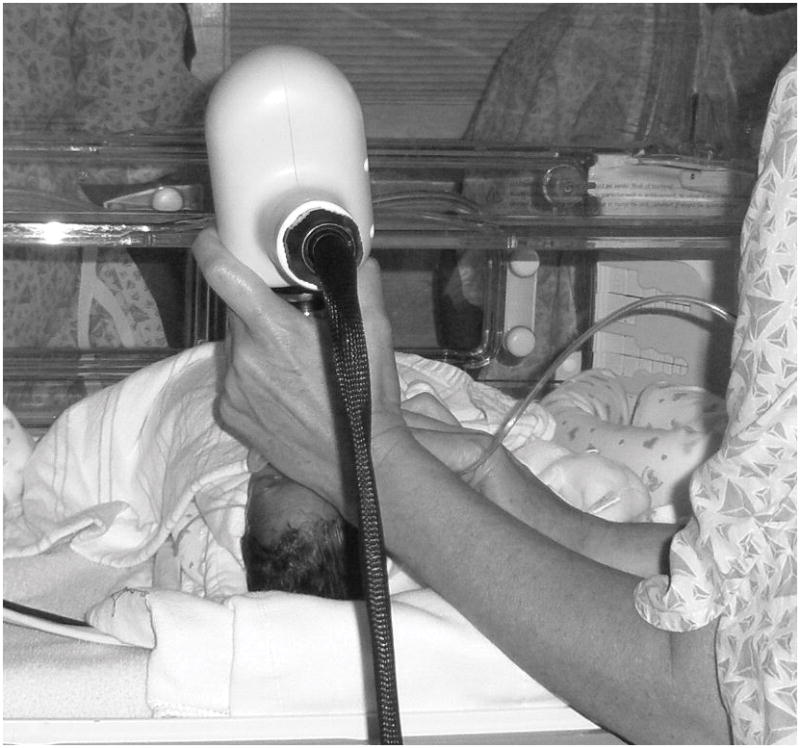
Color photograph showing a portable spectral domain optical coherence tomography (SD OCT) workstation connected to a handheld probe for imaging of infants in the neonatal intensive care unit.
Up to nine total SDOCT scans were collected for each eye. During the preceding indirect ophthalmoscopic examination, the clinician (SF or DW) completed a clinical case report form for each eye, documenting the presence or absence of the same vitreoretinal features as were graded on later SDOCT review. Each feature was recorded as present, absent or indeterminate, and further characterization of pathology type or extent was documented where applicable. The features included: vitreous material shadowing (and location), preretinal tissue (and location), vitreoretinal attachment (and whether deforming retina), epiretinal membrane (and whether deforming foveal), optic nerve abnormality (elevation, large cup, pallor, hyaloidal remnants), retinal cystoid structures or splitting (and whether single, foveal location), intraretinal deposits (lipid, blood, other), subretinal fluid (and whether foveal), subretinal lesions (CNV, blood, pigment, etc), retinal pigment epithelial (RPE) atrophy, stage and zone of ROP, and plus disease.
In a later review, certified OCT readers masked to the clinical findings selected three representative SDOCT scan sets per eye with the goal of choosing optimal images that captured the region of interest, either fovea or optic nerve, and captured an adequate field of scan and allowed differentiation of retinal layers and foveal contour. The graders evaluated each of the three SDOCT scans for characteristics of the same vitreoretinal features as on the clinical examination grading form. Each feature was recorded as present, absent or indeterminate, and further characterization of pathology type or extent was documented where applicable. A subset of ten scans was reevaluated by an independent grader to confirm intergrader agreement, and intergrader agreement was seen in all in the subset of cases. Detection frequencies of pathologic features found on SDOCT and clinical examination were compared.
Results
Patient Enrollment and Demographics
Table 1 provides the baseline characteristics for enrolled subjects. Thirty-eight subjects were included in the study. Of the 168 premature infants undergoing ROP screening, 42 patients were not medically cleared by the neonatologist, 77 patients had legal guardians that were not approached due to availability, 9 declined consent, 1 patient was discharged prior to imaging, and 1 patient’s legal guardian withdrew prior to imaging. Images were obtained in parallel with clinical examinations scheduled as part of standard of care. Subjects were imaged over multiple visits, for a total of 118 visits (228 individual eye sessions). All but 3 imaging sessions were performed in the NICU. Of those, two were obtained during clinic examination following discharge from the NICU, and one was obtained during examination under anesthesia. Imaging was not attempted if dense vitreous hemorrhage was present, as occurred in 1 session for 1 infant.
Table 1.
Baseline Characteristics of Enrolled Subjects (n= 38)
| Mean birth weight (g, SD) | 810 (±245) |
|
| |
| Mean gestational age (wk, SD) | 26.3 (±2.5) |
|
| |
| Mean postmenstrual age at time of imaging (wk, SD) | 37.5 (±4.8) |
|
| |
| Gender (n, % male) | 17 (45%) |
|
| |
| Race or Ethnicity (n, %) | |
| Asian | 0 |
| Black/African American | 21 (55%) |
| Hispanic | 1 (3%) |
| White | 16 (42%) |
Image Acquisition and Safety
Of 118 imaging visits, imaging was paused in 3 (2%), once due to a respiratory rate fluctuation, twice because of heart rate fluctuation and none due to drop in oxygen saturation. Two of the three sessions were resumed with permission from the nurse. Although the nurse gave permission to resume in the third case, the imager decided not to resume the imaging due to persisting elevated heart rate that was, however, still within acceptable parameter by protocol. No adverse events related to the study activity were reported.
Modality Agreement and Ability to Grade Vitreoretinal Features
Comparison of agreement between SDOCT and clinical examination for the detection of vitreoretinal features showed that the two modalities had a high rate of agreement for many categories (Table 2) with the highest agreement in subretinal fluid, subretinal lesion and RPE atrophy categories. Whereas SDOCT graders used all three scoring options including the designations present, absent, and “unable to determine”, the clinical examiners almost never scored the latter designation and instead scored all features as present or absent.
Table 2.
Comparison of SD OCT and Clinical Examination for the Detection of Vitreoretinal Features
| FEATURE | AGREEMENT | DISAGREEMENT | |||||||
|---|---|---|---|---|---|---|---|---|---|
| Present (%) | Absent (%) | Total (%) | Present on Clinical | Present on OCT | Absent on Clinical | Absent on OCT | |||
| Absent on OCT (%) | Indeterminate on OCT (%) | Absent on Clinical (%) | Indeterminate on Clinical (%) | Indeterminate on OCT (%) | Indeterminate on Clinical (%) | ||||
| Vitreous Material* | 7 (3) | 200 (88) | 207 (91) | 8 (4) | 0 | 4 (2) | 0 | 9 (4) | 0 |
| Over Fovea | 0 | 213 (93) | 213 (93) | 5 (2) | 0 | 0 | 0 | 10 (4) | 0 |
| Preretinal Tissue (not ERM) | 15 (7) | 155 (68) | 170 (75) | 23 (10) | 0 | 29 (13) | 0 | 6 (3) | 0 |
| Vitreoretinal Attachment | 2 (1) | 197 (86) | 199 (87) | 10 (4) | 1 (<1) | 9 (4) | 0 | 9 (4) | 0 |
| Deforming Retina | 1 (<1) | 204 (89) | 205 (90) | 3 (1) | 0 | 8 (4) | 0 | 12 (5) | 0 |
| Epiretinal Membrane | 0 | 144 (63) | 144 (63) | 0 | 0 | 74 (32) | 0 | 10 (4) | 0 |
| Deforming Fovea | 0 | 190 (83) | 190 (83) | 0 | 0 | 22 (10) | 0 | 16 (7) | 0 |
| Optic Nerve Abnormality | 13 (6) | 26 (11) | 39 (17) | 0 | 5 (2) | 124 (54) | 0 | 60 (26) | 0 |
| Retinal Cystoid Structures | 0 | 126 (55) | 126 (55) | 0 | 0 | 88 (39) | 0 | 14 (6) | 0 |
| Single | 0 | 208 (91) | 208 (91) | 0 | 0 | 5 (2) | 0 | 15 (7) | 0 |
| Foveal | 0 | 147 (64) | 147 (64) | 0 | 0 | 64 (28) | 0 | 17 (7) | 0 |
| Intraretinal Deposits | 0 | 200 (88) | 200 (88) | 5 (2) | 0 | 12 (5) | 1 (<1) | 10 (4) | 0 |
| Subretinal Fluid** | 2 (1) | 219 (96) | 221 (97) | 6 (3) | 0 | 0 | 0 | 1 (<1) | 0 |
| Foveal | 0 | 218 (96) | 218 (96) | 0 | 0 | 1 (<1) | 0 | 9 (4) | 0 |
| Other Subretinal Lesion | 0 | 214 (94) | 214 (94) | 5 (2) | 0 | 0 | 0 | 9 (4) | 0 |
| RPE Atrophy/Absence | 0 | 213 (93) | 213 (93) | 1 (<1) | 0 | 5 (2) | 0 | 9 (4) | 0 |
| Foveal | 0 | 218 (96) | 218 (96) | 0 | 0 | 1 (<1) | 0 | 9 (4) | 0 |
Graded on SD OCT as Vitreous Shadowing
Graded on SD OCT and clinical examination as either Subretinal Fluid or Retinal Detachment
Comparison of Features of the Vitreous and Vitreoretinal Interface
Both SDOCT and clinical examination were able to detect cases of vitreous material shadowing, preretinal tissue and vitreoretinal attachment that were not graded as present by the other modality (Table 2). The vitreous material reported on clinical examination, but not noted as shadowing on SDOCT, was blood in all cases and was within zone I in 2 of the 8 sessions. Nineteen of 23 (83%) cases of preretinal tissue found clinically and not seen on SDOCT were at the anterior border of Zone I or in Zone II. The typical appearance of preretinal tissue as graded on SDOCT was a discrete hyperreflective laterally elongated structure often with shadowing (Figure 2). In the 29 sessions where preretinal tissue was seen on SDOCT (presumably within zone I) the ROP was staged as 3 or greater in 11 sessions (38%).
Figure 2.
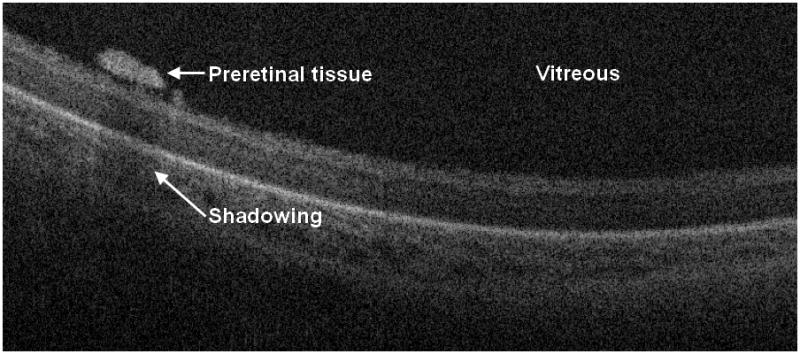
Cross-sectional SD OCT image shows a laterally elongated preretinal structure with shadowing. As these preretinal structures were sometimes found adjacent to blood vessels, we hypothesize that they may represent early proliferative changes. In the sessions where preretinal tissue was seen on SDOCT (presumably within zone I) the ROP was staged as 3 or greater in 38% of sessions.
Epiretinal membrane was found in 74 (32%) SDOCT imaging sessions and was never identified on clinical examination (Figure 3). In almost one third of these cases (22 imaging sessions), the epiretinal membrane was graded as deforming the fovea with loss of the foveal depression. Unlike the adult eye, neonatal ERMs appeared more adherent across the retinal surface without retinal folds. In some cases of subtle ERMs, in secondary review we debated whether these could be prominent internal limiting membranes.
Figure 3.

The cross-sectional SD OCT image on the left demonstrates a prominent epiretinal membrane deforming fovea. The cross-sectional SD OCT image on the right shows an epiretinal membrane adjacent to blood vessel. Neither case of epiretinal membrane was noted on clinical examination.
Comparison of Optic Nerve Features
Optic nerve characteristics could be analyzed by SDOCT by review of cross-sectional images as well as by evaluation of the sum voxel projection (SVP), a 2-dimensional image analogous to a fundus image created by the axial projection of 3-dimensional volumetric scans. The optic nerve was incompletely or poorly imaged in 65 sessions (28%) on SDOCT, particularly early in the series. The 124 (54%) sessions with SDOCT optic nerve findings not detected by clinical examination included hyaloid artery remnants (Figure 4) and large optic cup (Figure 5), but no case of elevated optic nerve head. Clinical examination identified large optic cup at 14 (6%) sessions, and SDOCT also detected large cup at 4 of these sessions. Clinical examination identified optic nerve pallor at 4 (2%) sessions. SDOCT did not identify optic nerve pallor.
Figure 4.
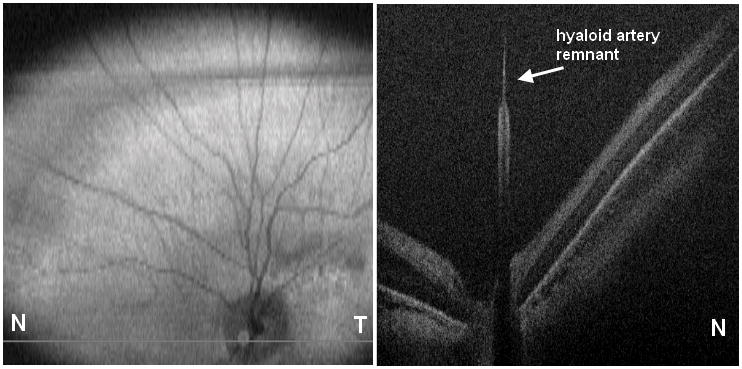
Cross-sectional SD OCT image shows hyaloidal remnant.
Figure 5.
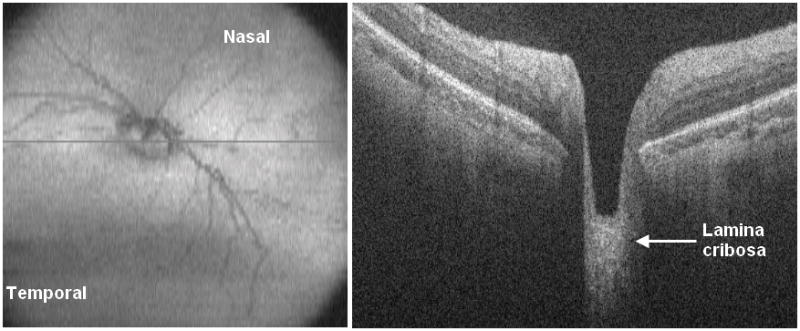
Cross-sectional SD OCT image on left with corresponding en-face retinal summed image on right.
Comparison of Intraretinal Features
On SDOCT we characterized 88 (39%) imaging sessions with retinal cystoid structures or schisis (Figure 6) not identified on clinical examination. Thirty-nine eyes of 23 patients (61% of all subjects) showed retinal cystoid structures or schisis during the study. In secondary analysis of our SDOCT category “retinal cystoid structures or schisis”, no cases of retinal schisis inner to the inner nuclear layer were found, unlike the finding of schisis adjacent to traction RD reported in other studies [4]. Thus all eyes demonstrated “cystoid structures”, which ranged from milder rounded hyporeflective sites often without complete loss of foveal depression (Figure 7) to severe vertically elongated hyporeflective structures with thin strands of hyperreflectivity between them and grossly elevating the central fovea (Figure 8). Rarely was there a single cystoid structure (five sessions, all in different neonates). The macular cystoid structures were always present in the inner nuclear layer with infrequent associated thickening and deformation of (and rarely a cystoid structure within) the photoreceptor layer elevating the outer plexiform layer (Figure 6). One third of the sessions with macular cystoid structures had concurrent macular epiretinal membrane (29 sessions). Hyperreflective intraretinal deposits were also present in 13 of 88 (15%) sessions with cystoid structures and occurred in 0 of 126 sessions without cystoid structures. Macular cystoid structures were observed in all stages of ROP and in the presence or absence of plus disease (Table 3). Because neonates were first available for imaging at different ages and because imaging was not at standard intervals, the time of onset and exact duration of cystoid structures could not be compared across subjects. Cystoid structures were visible as early as 32.7 weeks PMA and as late as 50 weeks PMA. In the majority of cases the edema was bilateral and persisted on repeat examinations, when these occurred. The longest duration of cystoid structures present on interval examinations was 6 weeks.
Figure 6.
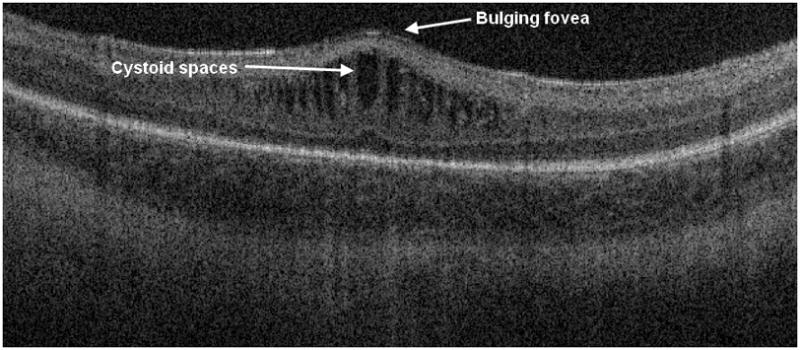
Cross-sectional SD OCT image showing retinal cystoid structures or schisis present in the inner nuclear layer with associated thickening and deformation of the photoreceptor layer elevating the outer plexiform layer. This session had been graded by the clinical examiner as stage II ROP disease in zone 2, no cystoid structures.
Figure 7.
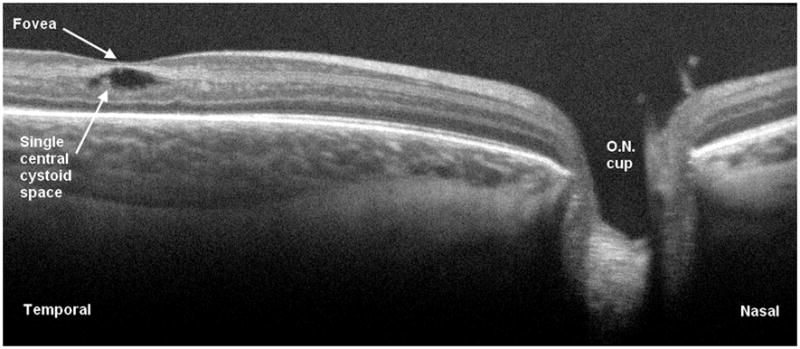
Cross-sectional SD OCT image demonstrating single intraretinal cystic structure without complete loss of foveal depression. The optic nerve is visible to the right.
Figure 8.
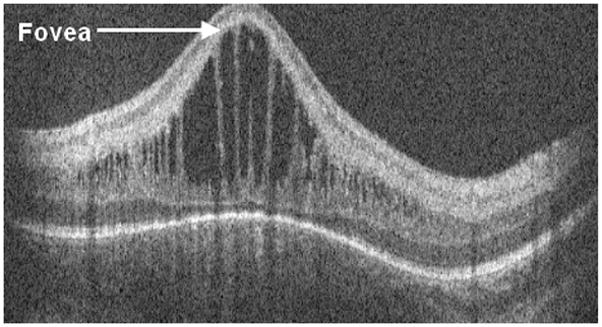
Cross-sectional SD OCT image showing a severe case of macular edema with gross elevation of the central fovea and vertically elongated hyporeflective structures alternating with thin strands of hyperreflectivity. This eye reached stage 2 disease in zone III and did not receive laser treatment.
Table 3.
Summary of Indirect Ophthalmoscopy and OCT Findings
| Subject | Imaging Session | Birth wt (g) | GA at birth (wks) | PMA at imaging (wks) | Indirect Ophthalmoscopy Findings OD | OCT Findings OD | Indirect Ophthalmoscopy Findings OS | OCT Findings OS |
|---|---|---|---|---|---|---|---|---|
| 1 | 1 | 880 | 28 | 33.3 | ZII S0; stalk at optic disc | ZII S0 | HR | |
| 1 | 2 | 880 | 28 | 41.4 | ZIII S2 | HR | ZIII S2 | HR |
| 2 | 1 | 660 | 24 | 37.7 | ZI S4A; VH; fibrous stalk, ridge NV; VRA; SRF; SR exudate | ERM; CME; IR deposits | ZI S4B; VRA; dragged vessels; SRF; SR exudate; RPE atrophy | ERM; CME; IR deposits |
| 2 | 2 | 660 | 24 | 38.1 | ZI S3; VH; VRA | ERM; HR; CME | ZI S4A; VRA; SRF; SR exudate | PR tissue; ERM; CME; IR deposits; SRF |
| 2 | 3 | 660 | 24 | 38.7 | ZI S4A; PRH; dragged vessels; IR lipid; SRF | vitreous shadowing; HR; CME | VH | ERM |
| 2 | 4 | 660 | 24 | 38.7 | ZII; VH; PRH; VRA | CME | VH | |
| 2 | 5 | 660 | 24 | 40.7 | ZII regressing; VH | VH | ||
| 2 | 6 | 660 | 24 | 43.0 | ZII regressing; VH | vitreous shadowing; HR | ZII regressing | PR tissue; CME; IR deposits; RPE atrophy |
| 3 | 1 | 560 | 23 | 41.9 | ZII regressing; LC | HR; CME; IR deposits | ZII regressing; VRA; LC | PR tissue; ERM; HR; CME |
| 3 | 2 | 560 | 23 | 43.0 | ZII S1 | HR; CME; IR deposits | ZII S1; fibrous PR material | CME |
| 4 | 1 | 542 | 25 | 50.7 | ZI S3; VRA; NV PR material; LC; vascular abnormality | PR tissue; VRA; ERM; HR; CME; IR deposits | ZI S3; NV PR material; LC | ERM; CME |
| 4 | 2 | 542 | 25 | 53.7 | ZI regressing; LC | PR tissue; VRA; ERM; HR | ZI regressing; fibrous PR material; LC | vitreous shadowing; PR tissue; VRA; HR; LC |
| 4 | 3 | 542 | 25 | 56.7 | ZI regressing; LC; vascular abnormality | PR tissue; VRA; HR | ZI regressing; VRA; NV PR material; LC; vascular abnormality | PR tissue |
| 5 | 1 | 860 | 26 | 40.0 | ZII S3; NV PR material; pre-Plus | CME | ZII S3; NV PR material | |
| 6 | 1 | 690 | 26 | 31.9 | ZII S2 | ZII S2 | ERM; HR; LC | |
| 6 | 2 | 690 | 26 | 33.9 | ZII S2 | ZII S2 | LC | |
| 6 | 3 | 690 | 26 | 35.9 | ZII S3; pre-Plus | HR; LC | ZII S3; pre-Plus | |
| 6 | 4 | 690 | 26 | 36.9 | ZII S3; pre-Plus | ZII S3; pre-Plus | LC | |
| 7 | 1 | 610 | 25 | 31.4 | ZI S0 | ZI S0 | ||
| 7 | 2 | 610 | 25 | 32.4 | ZII S1 | ZII S1 | ||
| 7 | 3 | 610 | 25 | 33.4 | ZII S2 | HR | ZII S2 | |
| 7 | 4 | 610 | 25 | 34.4 | ZII S2 | ERM | ZII S2 | |
| 7 | 5 | 610 | 25 | 35.4 | ZII S2 | ZII S2 | HR | |
| 8 | 1 | 770 | 26 | 34.3 | ZI S0; pre-Plus | ERM; HR | ZI S0; pre-Plus | ERM; HR |
| 8 | 2 | 770 | 26 | 35.3 | ZI S0; pre-Plus | PR tissue; ERM; HR | ZI S0; pre-Plus | |
| 8 | 3 | 770 | 26 | 36.3 | ZI S0; Plus | PR tissue; ERM; HR; CME | ZI S0; Plus | PR tissue; ERM |
| 8 | 4 | 770 | 26 | 37.3 | ZII S0; Plus | PR tissue; ERM; HR | ZII S0; Plus | PR tissue; ERM; HR |
| 8 | 6 | 770 | 26 | 39.6 | ZII S0; pre-Plus | PR tissue; ERM; CME | ZII S0; pre-Plus | PR tissue; ERM; HR |
| 8 | 7 | 770 | 26 | 45.3 | ZI S0; PRH | PR tissue; ERM; CME | ZI S0 | ERM; HR; CME |
| 9 | 1 | 1010 | 27 | 33.4 | ZI S0 | ERM; HR; LC | ZI S0 | LC |
| 9 | 2 | 1010 | 27 | 37.4 | ZII S2 | CME | ZII S2 | |
| 10 | 1 | 1050 | 30 | 34.0 | ZII S0 | ERM | ZII S0 | ERM; HR |
| 11 | 1 | 860 | 26.4 | 33.7 | ZII S1 | HR; LC | ZII S0 | HR; LC |
| 11 | 2 | 860 | 26.4 | 36.0 | ZII S1 | ZII S1 | ERM; HR; LC | |
| 12 | 1 | 520 | 28 | 41.4 | ZII S1; LC | ZII S1; LC | ||
| 12 | 2 | 520 | 28 | 42.3 | ZII S2; LC | ERM; LC; CME | ZII S2; LC | ERM; LC |
| 12 | 3 | 520 | 28 | 44.3 | ZII S2; NV PR material; LC; pre-Plus; IRH | ERM | ZII S2; NV PR material; LC; vascular abnormality; IRH | ERM; LC |
| 13 | 2 | 478 | 23 | 33.0 | ZI S1 | PR tissue; ERM; HR; LC | ZI S1 | |
| 13 | 3 | 478 | 23 | 35.0 | ZI/II S3; NV PR material; Plus | PR tissue; ERM; HR | ZI/II S3; NV PR material; pre-Plus | PR tissue; ERM; HR |
| 13 | 4 | 478 | 23 | 36.0 | ZI/II S3; PRH; VRA; pre-Plus | vitreous shadowing; PR tissue; ERM; HR | ZI/II S3; PRH; VRA; pre-Plus | HR |
| 13 | 5 | 478 | 23 | 37.0 | ZII S2; VH; PRH; pre-Plus | ERM; HR | ZII S2; PRH; pre-Plus | vitreous shadowing; PR tissue; VRA; ERM; HR; CME |
| 13 | 6 | 478 | 23 | 38.0 | ZII S2; PRH; pre-Plus | PR tissue; VRA; ERM; HR | ZII S3; PRH; pre-Plus | PR tissue; HR |
| 13 | 7 | 478 | 23 | 39.0 | ZII S0; PRH | vitreous shadowing; ERM; HR; CME | ZII S0; PRH | vitreous shadowing; ERM; HR; CME; |
| 14 | 1 | 790 | 25.7 | 31.4 | ZII S1 | LC | ZII S1 | LC |
| 15 | 1 | 1060 | 28 | 32.4 | ZI/II S0 | LC | ZI/II S0 | LC |
| 16 | 1 | 550 | 23.2 | 31.3 | ZI/II S0; optic nerve pallor | ZI/II S0; optic nerve pallor | ||
| 16 | 2 | 550 | 23.2 | 34.3 | ZI S2; pre-Plus | PR tissue; ERM; CME | ZI S2; pre-Plus | PR tissue; ERM; CME |
| 16 | 3 | 550 | 23.2 | 35.3 | ZI S2; NV PR material; Plus | CME | ZI S3; NV PR material; Plus | ERM; CME; IR deposits |
| 16 | 4 | 550 | 23.2 | 36.3 | ZI S0; Plus | ERM | ZI S0; Plus | PR tissue |
| 16 | 5 | 550 | 23.2 | 49.0 | ZII S0; optic nerve pallor | PR tissue; ERM; CME; IR deposits; RPE atrophy | ZII S0; optic nerve pallor | HR |
| 17 | 1 | 640 | 24.1 | 31.1 | ZI S0 | ZI S0 | ERM; LC | |
| 17 | 2 | 640 | 24.1 | 32.1 | ZI/II S2 | ZI/II S2 | ||
| 17 | 3 | 640 | 24.1 | 33.1 | ZII S0 | ZII S0 | ||
| 18 | 1 | 850 | 25 | 32.7 | ZII S1 | HR; CME | ZII S1 | HR |
| 19 | 1 | 1060 | 28 | 32.7 | ZII S0 | ZII S0 | HR | |
| 20 | 1 | 720 | 28 | 32.7 | ZII S0 | HR | ZII S0 | ERM; HR |
| 21 | 2 | 1160 | 28 | 40.1 | ZII S2 | HR; CME; IR deposits | ZII S2 | ERM; CME |
| 22 | 1 | 1580 | 29 | 35.1 | ZIII S0 | ZIII S0 | HR | |
| 23 | 1 | 660 | 24.4 | 38.0 | ZII S2 | HR | ZII S2 | HR |
| 24 | 1 | 650 | 27 | 34.0 | ZII S1 | HR | ZII S1 | |
| 24 | 2 | 650 | 27 | 35.0 | ZII S1 | CME | ZII S1 | HR; CME |
| 25 | 1 | 930 | 27 | 32.0 | ZII S0 | LC; CME | ZII S0 | |
| 26 | 1 | 495 | 24 | 40.0 | ZII S4A; fibrous PR material; VRA; SRF | HR | ZII S3 | PR tissue; HR; CME |
| 26 | 2 | 495 | 24 | 41.0 | ZII S4A; fibrous PR material; VRA; SRF | PR tissue; HR | ZII S3 | |
| 26 | 3 | 495 | 24 | 42.0 | ZII S4A; fibrous PR material; VRA; SRF | vitreous shadowing; PR tissue; VRA; SRF; RPE atrophy | ZII S3 | PR tissue; VRA |
| 26 | 4 | 495 | 24 | 43.0 | ZII S4A; fibrous PR material; VRA; SRF | vitreous shadowing; PR tissue; HR; RPE atrophy | ZII S3 | vitreous shadowing; HR |
| 26 | 5 | 495 | 24 | 45.0 | ZII S3; fibrous PR material | PR tissue | ZII S3 | PR tissue; HR |
| 26 | 6 | 495 | 24 | 47.0 | ZII S0 | HR | ZII S0 | HR |
| 26 | 7 | 495 | 24 | 50.0 | ZII S0 | PR tissue | ZII S0 | PR tissue; HR |
| 27 | 1 | 630 | 27 | 31.0 | ZI/II S0 | ERM | ZI/II S0 | ERM; HR; LC |
| 27 | 2 | 630 | 27 | 32.0 | ZI/II S0 | ERM; HR | ZI/II S0 | HR |
| 27 | 3 | 630 | 27 | 33.0 | ZII S0 | PR tissue; ERM; HR | ZII S0 | ERM; HR |
| 27 | 4 | 630 | 27 | 34.0 | ZII S0 | ERM; HR; LC | ZII S0 | ERM; HR |
| 27 | 5 | 630 | 27 | 36.0 | ZII S0 | vitreous shadowing; ERM | ZII S0 | HR |
| 28 | 1 | 750 | 24 | 36.0 | ZII S2; pre-Plus | ZII S2 | ||
| 28 | 2 | 750 | 24 | 37.0 | ZII S2; pre-Plus | ZII S2; pre-Plus | HR | |
| 28 | 3 | 750 | 24 | 38.0 | ZII S2 | ZII S2 | ||
| 28 | 4 | 750 | 24 | 39.0 | ZII S2; pre-Plus | ZII S2; pre-Plus | HR | |
| 28 | 5 | 750 | 24 | 40.0 | ZII S2; pre-Plus | ERM; HR | ZII S2; pre-Plus | |
| 28 | 6 | 750 | 24 | 41.0 | ZII S2; pre-Plus | ERM | ZII S2; pre-Plus | HR |
| 29 | 1 | 950 | 26 | 35.0 | ZII S2 | CME | ZII S2 | CME |
| 29 | 2 | 950 | 26 | 36.0 | ZII S2 | CME | ZII S2 | HR; LC; CME |
| 29 | 3 | 950 | 26 | 38.0 | ZII S2 | CME | ZII S2 | LC; CME |
| 30 | 1 | 1160 | 29 | 35.0 | ZII S0 | ZII S0 | HR | |
| 30 | 2 | 1160 | 29 | 37.0 | ZIII S0 | ZIII S0 | HR | |
| 31 | 1 | 1350 | 29 | 35.0 | ZII S0 | HR | ZII S0 | HR |
| 31 | 2 | 1350 | 29 | 37.0 | ZIII S0 | HR | ZIII S0 | |
| 32 | 1 | 870 | 25 | 33.0 | ZII S2 | HR; CME | ZII S2; pre-Plus | HR; CME |
| 32 | 2 | 870 | 25 | 35.0 | ZII S2 | HR; CME | ZII S2; pre-Plus | CME |
| 32 | 3 | 870 | 25 | 36.0 | ZII S2 | CME | ZII S2; pre-Plus | HR; CME |
| 32 | 4 | 870 | 25 | 37.0 | ZII S2 | HR; CME | ZII S2; pre-Plus | HR; CME |
| 32 | 5 | 870 | 25 | 38.0 | ZII S2 | ERM; HR; CME | ZII S3; pre-Plus | ERM; CME |
| 32 | 6 | 870 | 25 | 39.0 | ZII S2 | ERM; HR; CME; IR deposits | ZII S2; pre-Plus | ERM; HR; CME; IR deposits |
| 33 | 1 | 700 | 37 | 37.0 | ZII S3; VH; pre-Plus | VRA | ZII S3; pre-Plus | HR; CME |
| 33 | 2 | 700 | 37 | 38.0 | ZII S3; VH; fibrous PR material | VRA; HR | ZII S3; fibrous PR material | PR tissue; VRA; ERM; HR; CME |
| 33 | 3 | 700 | 37 | 39.0 | ZII regressing; VH; fibrous PR material | ERM; CME | ZII regressing; fibrous PR material | CME |
| 34 | 1 | 990 | 26 | 31.0 | ZII S0 | ERM; HR; LC | ZII S0 | HR; LC |
| 34 | 2 | 990 | 26 | 36.0 | ZII S0 | CME | ZII S0 | HR; CME |
| 35 | 1 | 800 | 25 | 33.0 | ZII S1 | HR; CME | ZII S1 | ERM |
| 35 | 2 | 800 | 25 | 34.0 | ZII S3; Plus | ERM; HR | ZII S3; Plus | ERM; HR |
| 35 | 3 | 800 | 25 | 35.0 | ZII regressing; Plus | PR tissue; ERM; HR | ZII regressing; pre-Plus | ERM; HR |
| 35 | 4 | 800 | 25 | 36.0 | ZII S3; pre-Plus | ZII regressing; pre-Plus | HR | |
| 35 | 5 | 800 | 25 | 37.0 | ZII S3 | PR tissue; HR; CME | ZII regressing | CME |
| 35 | 6 | 800 | 25 | 40.0 | ZII regressed | HR; LC; CME | ZII regressed | CME |
| 35 | 7 | 800 | 25 | 42.0 | ZII regressed | ZII regressed | ||
| 36 | 1 | 680 | 25 | 33.0 | ZII S0 | HR; CME | ZII S0 | HR |
| 36 | 2 | 680 | 25 | 34.0 | ZII S0 | ZII S0 | HR; CME | |
| 36 | 3 | 680 | 25 | 36.0 | ZII S0 | HR; CME | ZII S0 | HR; CME |
| 36 | 4 | 680 | 25 | 37.0 | ZII S0 | HR; CME | ZII S0 | HR; CME |
| 36 | 5 | 680 | 25 | 39.0 | ZII S0 | HR; CME | ZII S0 | HR; CME |
| 37 | 1 | 600 | 26 | 41.0 | ZIII S3; IR deposit | HR; CME | ZIII S1 | HR; CME |
| 37 | 2 | 600 | 26 | 42.0 | ZIII S2 | PR tissue; HR; CME | ZIII S2 | HR; CME |
| 37 | 3 | 600 | 26 | 46.0 | ZIII S3; IRH | CME | ZIII S0 | HR; CME |
| 38 | 1 | 700 | 25 | 34.0 | ZI S2; pre-Plus | ZI S2; pre-Plus | ||
| 38 | 2 | 700 | 25 | 35.0 | ZII S2; pre-Plus | HR; LC; CME | ZII S2; pre-Plus | CME |
| 38 | 3 | 700 | 25 | 36.0 | ZII S2; pre-Plus | CME | ZII S2; pre-Plus | CME |
| 38 | 4 | 700 | 25 | 37.0 | ZII S2 | CME | ZII S2 | HR; CME |
| 38 | 5 | 700 | 25 | 42.0 | ZIII S1 | HR; CME | ZII S2 | CME |
CME=macular cystoid structures; ERM=epiretinal membrane; GA=gestational age; HR=hyaloidal remnants; IR=intraretinal; IRH=intraretinal hemorrhage; LC=large optic cup; NV=neovascular; PMA=postmenstrual age; PR=preretinal; PRH=preretinal hemorrhage; S=stage; SR=subretinal; SRF=subretinal fluid; VH=vitreous hemorrhage; VRA=vitreoretinal attachment; Z=zone
Comparison of Subretinal Features
At six sessions, clinical examination identified retinal detachment not graded on SDOCT. All were cases of Stage 4A, or more peripheral detachments not involving the macula. In one case, we found subretinal fluid tracking into the fovea on SDOCT, signaling a more advanced retinal detachment than the 4A RD described on clinical examination (Table 2).
Comparison of Vascular Features
Retinal vascular abnormalities such as tortuosity and dragging was assessed on all clinical sessions but could not be assessed by evaluation of the cross-sections of SDOCT images. The retinal summed images from the SDOCT sessions were of inadequate quality to evaluate vessels in many sessions and the time to sum and extract images was prohibitive.
ROP Disease and Severity
The clinician was able to determine stage and zone of ROP after indirect ophthalmoscopy in all except for 4 sessions in which vitreous hemorrhage was present. The stage and zone of ROP could not be determined from any of the SDOCT images with the exception of the single session in which SDOCT graded subretinal fluid tracking under fovea. Twenty-one eyes in 12 subjects reached ROP stage 3 or greater and, of these, 3 eyes progressed to retinal detachment.
Discussion
Using SDOCT imaging, we identified many retinal features in premature infants that were not detected on clinical examination by experienced pediatric ophthalmologists. Macular features identified on SDOCT images and not seen by clinical examination included macular cystoid structures (39% of all sessions), epiretinal membranes (32% of all sessions), intraretinal deposits and subclinical macular detachment. Clinical features of zone and stage of ROP were not detected by portable handheld SDOCT imaging of the awake infant in the NICU. This is in large part due to the smaller field of view with SDOCT imaging which restricted assessment of the peripheral retina (Figure 9).
Figure 9.
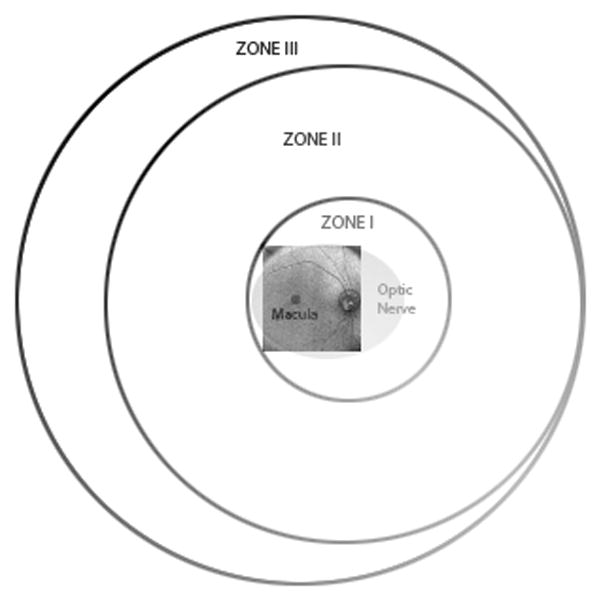
Schematic diagram showing range of retinal imaging with the portable handheld SD OCT unit. This system is provides high magnification imaging within zone I and can only infrequently capture images at the anterior border of zone I.
In a previous study, Muni et al. used a handheld SDOCT to image progressive posterior tractional retinoschisis in laser-treated ROP both during examination under anesthesia and in the NICU [12]. They documented SDOCT imaging of a stage 3 elevated neovascular complex in zone 1 in an infant eye in the NICU. With the current system and our technique, we could not readily view the anterior border of zone I ROP, which is quite restricted, compared to a wide-field fundus camera (e.g. RetCAM, Clarity Medical Systems, Pleasanton, CA). Because of this limitation, SDOCT in this study was most useful for visualizing macular pathology, and not a useful tool for routine imaging of the border between vascular and avascular retina.
The presence of plus disease also could not be assessed by SDOCT. Although retinal vascular features may be evaluated by SDOCT using the retinal summed image, these were of limited quality in many infants and showed motion artifact. As our imaging techniques and protocol have improved, so have the retinal summed images, perhaps allowing evaluation of these features in the future (Figure 10).
Figure 10.
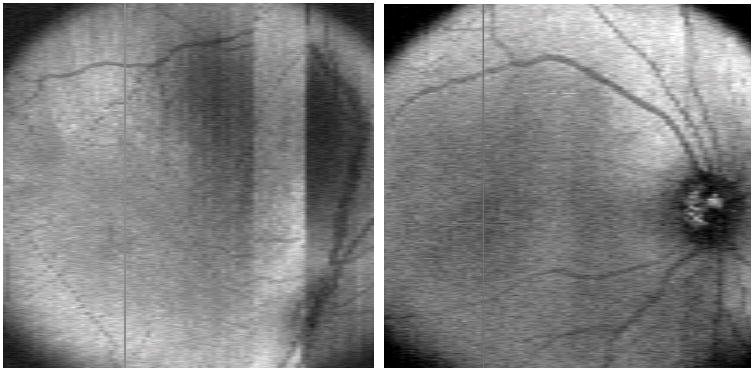
Early retinal summed image on left showing motion artifact and incomplete view of optic nerve and vascular arcades. Example of a later retinal summed image on the right demonstrating improved image of optic nerve and vascular arcades.
The clinical significance of the large number of subclinical macular cystoid structures and schisis is not yet known. Cystoid structures were observed in eyes with or without stage 3 ROP and in the presence or absence of plus disease. They were documented from 33 to 50 weeks PMA and often persisted through several interval examinations (Table 3). The cystoid changes always involved the inner nuclear layer and were rarely seen in the photoreceptor or other layers except in the most deformed foveas. Because vascular endothelial growth factor (VEGF) has been demonstrated to increase vascular permeability leading to macular edema [13, 14] and is known to be present in the eyes of infants with ROP [15], we believe these cystoid structures may be a VEGF –related process. The presence of cystoid structures might serve as a marker for VEGF levels in these infants although it could also reflect a stage of ex utero development in these very young eyes. As the infants in this study were imaged at different gestational ages, it was not possible to correlate patient age with onset of cystoid changes. A more in-depth study is in progress to correlate macular findings including macular thickness with the complex systemic findings and with severity of ROP.
We do not know whether macular cystoid changes early in retinal development play any role in ultimate visual outcome. Final visual acuity results from the Early Treatment of Retinopathy of Prematurity Study showed that although visual acuity is improved with early treatment, 65.4% of eyes receiving early treatment developed visual acuity worse than 20/40 [16]. However, in another study, very low birth weight infants without advanced ROP and without serious neurologic sequelae of premature birth showed no difference from term infants on three measures of visual function [17]. Anatomic macular abnormalities detected by SDOCT may also partially explain the poor visual outcomes after surgical intervention in advanced cases of ROP [18]. Although we had few retinal detachments in this series, precise macular assessment in eyes with retinal detachment may influence timing of future intervention and improve visual outcomes.
This study must be viewed in light of several limitations. The comparison of modalities in this study is descriptive and not statistical. Also, the sample presented in this study may not be representative since enrollment in the study was limited to neonates that had been medically cleared to participate and who had parents available for, and willing to provide consent. In addition, some infants were examined for more sessions than others, weighing results toward those with more sessions. Differing interpretations of grading form elements may also have contributed to scoring differences between clinical examiners and SDOCT graders. Unlike the SDOCT graders, the clinical examiners almost never used the “unable to determine” category. In a large number of sessions, optic nerve findings noted on SDOCT were not recorded on clinical examination, although the scoring forms for both had the same options to record large cup, hyaloidal remnants, optic nerve pallor and optic nerve elevation. The clinician may not have been as attentive to the optic nerve section of the grade form as to the ROP-pertinent sections. For the optic nerve, we lacked an objectively defined threshold for abnormalities to assure similar attention to structures such as small hyaloidal remnants that would be recorded as present on SDOCT grading but may not have been considered notable for clinical scoring. In addition, the clinician scored findings based upon a brief indirect ophthalmoscopic examination in a moving infant, while the SDOCT graders made their interpretations based upon evaluation of digital images displayed on a computer screen, which could be replayed as needed for evaluation of graded features. Color fundus photography would provide a similar reader experience reviewing images as one is moving through a grade form. In future study, it would be interesting to identify how characteristics identified on SDOCT relate to a corresponding fundus photograph.
In conclusion, SDOCT images may provide subclinical information on early critical vitreoretinal changes and enhance standard clinical examination in the management of ROP. As used in this study, SDOCT does not replace standard clinical examination of ROP, but may serve as a useful adjunct. Further study is needed to evaluate the clinical significance and predictive value of novel SDOCT findings in premature infants.
Footnotes
Meeting Presentation: The American Academy of Ophthalmology Annual Meeting, Chicago, IL, October 2010
Disclosures: The following authors have the ensuing financial disclosures:
Dr. Sharon F. Freedman:
Pfizer: Consulting
Dr. Cynthia A. Toth:
Alcon: Consulting, Research Support and Royalties; Bioptigen: Research Support and Royalties; Genentech: Consulting and Research Support
Financial Support: Supported by grants from Angelica and Euan Baird; The Hartwell Foundation; Grant 1UL1 RR024128-01 from the National Center for Research Resources (NCRR), a component of the National Institutes of Health (NIH); and NIH Roadmap for Medical Research. The contents of the article are solely the responsibility of the authors and do not necessarily represent the official view of NCRR or NIH.
References
- 1.Tasman W. Multicenter trial of cryotherapy for retinopathy of prematurity. Arch Ophthalmol. 1988;106(4):463–4. doi: 10.1001/archopht.1988.01060130509025. [DOI] [PubMed] [Google Scholar]
- 2.Early Treatment For Retinopathy Of Prematurity Cooperative, G. Revised indications for the treatment of retinopathy of prematurity: results of the early treatment for retinopathy of prematurity randomized trial. Arch Ophthalmol. 2003;121(12):1684–94. doi: 10.1001/archopht.121.12.1684. [DOI] [PubMed] [Google Scholar]
- 3.Screening examination of premature infants for retinopathy of prematurity. Pediatrics. 2001;108(3):809–11. doi: 10.1542/peds.108.3.809. [DOI] [PubMed] [Google Scholar]
- 4.Chavala SH, et al. Insights into Advanced Retinopathy of Prematurity Using Handheld Spectral Domain Optical Coherence Tomography Imaging. Ophthalmology. 2009 doi: 10.1016/j.ophtha.2009.06.003. [DOI] [PMC free article] [PubMed] [Google Scholar]
- 5.Mirza RG, Johnson MW, Jampol LM. Optical coherence tomography use in evaluation of the vitreoretinal interface: a review. Surv Ophthalmol. 2007;52(4):397–421. doi: 10.1016/j.survophthal.2007.04.007. [DOI] [PubMed] [Google Scholar]
- 6.Maldonado RS, et al. Optimizing Hand-Held Spectral Domain Optical Coherence Tomography Imaging for Neonates, Infants and Children. Invest Ophthalmol Vis Sci. doi: 10.1167/iovs.09-4403. [DOI] [PMC free article] [PubMed] [Google Scholar]
- 7.Scott AW, et al. Imaging the infant retina with a hand-held spectral-domain optical coherence tomography device. Am J Ophthalmol. 2009;147(2):364–373. e2. doi: 10.1016/j.ajo.2008.08.010. [DOI] [PubMed] [Google Scholar]
- 8.Chong GT, et al. Abnormal foveal morphology in ocular albinism imaged with spectral-domain optical coherence tomography. Arch Ophthalmol. 2009;127(1):37–44. doi: 10.1001/archophthalmol.2008.550. [DOI] [PubMed] [Google Scholar]
- 9.Flynn JT, Chan-Ling T. Retinopathy of prematurity: two distinct mechanisms that underlie zone 1 and zone 2 disease. Am J Ophthalmol. 2006;142(1):46–59. doi: 10.1016/j.ajo.2006.02.018. [DOI] [PubMed] [Google Scholar]
- 10.Stevens B, Yamada J, Ohlsson A. Sucrose for analgesia in newborn infants undergoing painful procedures. Cochrane Database Syst Rev. 2004:CD001069. doi: 10.1002/14651858.CD001069.pub2. [DOI] [PubMed] [Google Scholar]
- 11.Elserafy FA, et al. Oral sucrose and a pacifier for pain relief during simple procedures in preterm infants: a randomized controlled trial. Ann Saudi Med. 2009;29(3):184–8. doi: 10.4103/0256-4947.52821. [DOI] [PMC free article] [PubMed] [Google Scholar]
- 12.Muni RH, et al. Retinoschisis detected with handheld spectral-domain optical coherence tomography in neonates with advanced retinopathy of prematurity. Arch Ophthalmol. 128(1):57–62. doi: 10.1001/archophthalmol.2009.361. [DOI] [PubMed] [Google Scholar]
- 13.Funatsu H, et al. Vitreous levels of vascular endothelial growth factor and intercellular adhesion molecule 1 are related to diabetic macular edema. Ophthalmology. 2005;112(5):806–16. doi: 10.1016/j.ophtha.2004.11.045. [DOI] [PubMed] [Google Scholar]
- 14.Micieli JA, Surkont M, Smith AF. A systematic analysis of the off-label use of bevacizumab for severe retinopathy of prematurity. Am J Ophthalmol. 2009;148(4):536–543. e2. doi: 10.1016/j.ajo.2009.05.031. [DOI] [PubMed] [Google Scholar]
- 15.Chen J, Smith LE. Retinopathy of prematurity. Angiogenesis. 2007;10(2):133–40. doi: 10.1007/s10456-007-9066-0. [DOI] [PubMed] [Google Scholar]
- 16.Good WV, et al. Final visual acuity results in the early treatment for retinopathy of prematurity study. Arch Ophthalmol. 128(6):663–71. doi: 10.1001/archophthalmol.2010.72. [DOI] [PMC free article] [PubMed] [Google Scholar]
- 17.Mirabella G, et al. Visual development in very low birth weight infants. Pediatr Res. 2006;60(4):435–9. doi: 10.1203/01.pdr.0000238249.44088.2c. [DOI] [PubMed] [Google Scholar]
- 18.Joshi MM, Trese MT, Capone A., Jr Optical coherence tomography findings in stage 4A retinopathy of prematurity: a theory for visual variability. Ophthalmology. 2006;113(4):657–60. doi: 10.1016/j.ophtha.2006.01.007. [DOI] [PubMed] [Google Scholar]


