Abstract
Purpose: A 3D dosimetry system is described which consists of two parts: a radiochromic plastic dosimeter PRESAGE® (which responds to absorbed dose with a linear change in optical-density) and the Duke large-field-of-view optical-CT scanner (DLOS). The DLOS∕PRESAGE system has recently been commissioned and benchmarked for clinical use and, in particular, for verification and commissioning of complex radiation treatments.
Methods: DLOS commissioning involved determining the dynamic range, spatial resolution, noise, temporal, and other characteristics of the light source and imaging components. Benchmarking tests were performed on the combined DLOS∕PRESAGE system to establish baseline dosimetric performance. The tests consisted of delivering simple radiation treatments to PRESAGE dosimeters, and comparing the measured 3D relative dose distributions with the known gold standard. The gold standard distribution was obtained from machine beam-data or the treatment planning system (TPS). All studies used standardized procedures to ensure consistency.
Results: For commissioning, isotropic spatial resolution was submillimeter (MTF > 0.5 for frequencies of 1.5 lp∕mm) and the dynamic range was ∼60 dB. Flood field uniformity was within 10% and stable after 45 min of warm-up. Stray-light is small, due to telecentricity, but even the residual can be removed through deconvolution by a point-spread-function. For benchmarking, the mean 3D passing NDD (normalized dose distribution) rate (3%, 3mm, 5% dose threshold) over the benchmark data sets was 97.3% ± 0.6% (range 96%–98%), which is on par with other planar dosimeters used in external beam radiation therapy indicating excellent agreement. Noise was low at <2% of maximum dose (4–12 Gy) for 2 mm reconstructions. The telecentric design was critical to enabling fast imaging with minimal stray-light artifacts.
Conclusions: This work presents the first comprehensive benchmarking of a 3D dosimetry system for clinical use. The DLOS∕PRESAGE benchmark tests show consistently good agreement to simple known distributions. The system produces accurate isotropic 2 mm dose data over clinical volumes (e.g., 16 cm diameter phantoms, 12 cm height), in under 15 min. It represents a uniquely useful and versatile new tool for commissioning and verification of complex therapy treatments.
Keywords: 3D dosimetry, optical, computed tomography, radiation, treatment verification
INTRODUCTION
The need for a fast, accurate, and practical 3D dosimetry system has become acute as radiation delivery and treatment systems become ever more sophisticated and complex. Prior work has shown the radiochromic 3D dosimetry material PRESAGE®, in combination with an optical-CT scanning system, has promised to address this need.1, 2, 3, 4, 5, 6, 7, 8, 9 These publications typically reported on prototype scanners and dosimeter formulations at varying stages of development and capability. The present work differentiates, in that an optimized optical-CT scanning system is presented. The system is commissioned and benchmarked for clinical use in combination with a standard PRESAGE formulation.
Two types of optical-CT scanners are prevalent today. The early laser based scanners were designed to image scatter contrast in polymer gels and acquired data by illuminating one line-integral and raster scanning over the whole projection.10, 11, 12 While effective and accurate, due to efficient stray-light elimination, the raster scanners were time consuming and not optimal for clinical use. The introduction of radiochromic dosimeters like PRESAGE, which exhibit light absorbing optical contrast (with very little scatter) created an opportunity for faster, broadbeam scanner designs that acquire all line-integrals for a projection angle simultaneously.13, 14 This work introduces such a scanner, referred to as DLOS (Duke large-field-of-view optical-CT scanner), shown in Fig. 1. The DLOS can produce 2 mm isotropic 3D data (each voxel is 2 mm × 2 mm × 2 mm) over a 20 cm diameter dosimeter in about 15 min using the standard operating procedures (SOPs), in contrast to the many hours that would be required with a typical raster scanning system.
Figure 1.
Duke large field-of-view optical-CT scanner (DLOS). Light is collected by the matched telecentric imaging lens, which forms a precise image only from light rays that are parallel to the optic axis (with a 0.1° tolerance due to the aperture stop). Note rejected light rays due to the aperture such as the dashed scattered line. Each pixel in the image, measures the line-integral of optical attenuation through the dosimeter, with negligible scatter contamination upstream of the imaging lens.
The DLOS system arose out of experience gained from earlier prototypes, but includes several novel hardware and software modifications. As described in Sec. 2, these include increased intensity and uniformity of flood field, methods to reduce spectral artifacts, an algorithm to remove residual stray-light artifacts, and reduced noise due to improved registration and fluid filtration. Several of these developments were not available in the earlier prototypes. Together, these modifications combine to create a system with substantially improved performance (shown in Sec. 3). Tests indicated the system was fully optimized and performing well, so studies were initiated to commission the DLOS system for clinical dosimetry and to benchmark its performance in combination with PRESAGE dosimeters.
METHODS
The design and operation of the DLOS system is described in Sec. 2A. The DLOS commissioning tests, which were performed to characterize scanner performance alone (i.e., independent of PRESAGE), are described in Sec. 2B. Section 2C describes benchmarking tests to evaluate and define baseline performance and capability of the combined DLOS∕PRESAGE 3D dosimetry system on simple known dose distributions. A set of SOPs were developed for the benchmark studies to ensure consistent and optimal data acquisition and reconstruction.
DLOS design and operation
The DLOS scanner (Fig. 1) consists of a matched telecentric source and imaging lens (30 cm diameter - both from Opto-Engineering, Italy), which provide a 24 cm field of view (FOV) with a 2∕3” CCD array. The light source is a 3 W red LED behind a weak optical diffuser and a narrow band pass filter (632 ± 5 nm). The diffuser helps improve the uniformity of flood field, and de-sensitize the system to Schlieren bands in the dosimeter, while the filter reduces any spectral artifacts.29 Nominally parallel light projects through an aquarium containing a radiochromic dosimeter and index matching fluid to minimize bending and reflections at the dosimeter-fluid interfaces. The light is imaged through a telecentric imaging lens with a manufacturer specified magnification of .037 × and an acceptance angle of 0.1°. The collimation lens is designed to project a parallel beam through the dosimeter to the imaging lens creating an ideal design for parallel beam CT geometry. Images are captured with a 12-bit monochromatic 1040 × 1392 CCD based Basler camera. Each pixel in the CCD array is 6.45 μm square in image space, representing ∼175 μm square in object space. This represents the size of the smallest possible voxel edges in a reconstruction giving the scanner ample spatial resolution for 3D dosimetric verifications. Since most applications do not require such stringent spatial resolution criteria, generally the images are downsized to give 2 mm pixel edges to save disk space and reduce image noise. After each projection is acquired the dosimeter rotates via a rotation stage, such that a set of projections from many views is acquired to enable tomographic reconstruction.
The DLOS was designed for use with PRESAGE (Heuris Pharma), a radiochromic polyurethane based material. PRESAGE exhibits a linear change in optical-density (ΔOD) when irradiated with ionizing radiation, which is light absorbing in nature, not light scattering.7, 27 A consistent <2% interdosimeter (dosimeter to dosimeter) and <2% intradosimeter (within each dosimeter) response has been observed.7 As of this writing, three commercial formulations are available and this work is done exclusively with formulation #2, designed for use with photon and electron energies >1 MeV with a stable color signal and an Zeff of ∼8.0. Further details can be obtained through Heuris Parma, LLC. The lack of need for an external container for PRESAGE is an important advantage for telecentric scanners. Light rays will deviate from the normal (i.e., parallel to the optical axis) as they traverse the three materials (fluid, container, and presage) due to refractive index mismatch. The telecentric lens only forms an image from light parallel to the axis with a stringent tolerance of 0.1°. Consequently the edge artifacts in optical-CT images are much more pronounced when the dosimeters are encased in containers.
Data acquisition and reconstruction
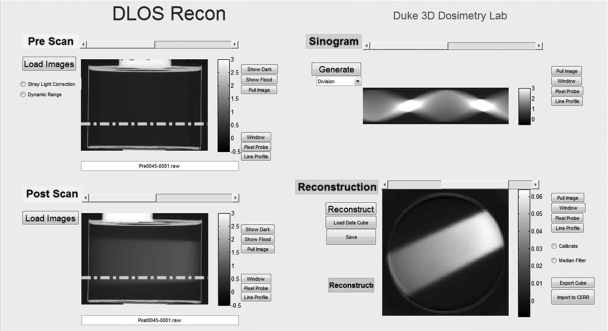
All scans in the present work were acquired according to SOPs to ensure consistency. SOPs specify the number of projection angles based on dosimeter size, desired voxel size, and a 360° scan. They also ensure minimal noise through fluid cleaning, accurate registration of preirradiation and postirradiation scans, and minimal stray-light through the use of light blocks. Figure 2 illustrates general concepts and steps in the data acquisition process. A preirradiation and postirradiation scan is required to obtain the ΔOD, which is proportional to the absorbed dose in the dosimeter.4, 27 The dosimeter is orientated with a docking mechanism on the rotation stage to ensure consistent placement and coregistered data sets between preirradiation and postirradiation scans. 3D data are acquired through the accumulation of projection images at several angles according to Nyquist sampling criteria. Each projection image is captured 20 times and averaged to increase SNR for each projection image. The projection images are dark noise and flood field corrected to reduce the effects of particulates on glass surfaces, nonuniformity of CCD pixel response, dark current, and readout noise. Each preprojection and postprojection image is deconvolved with a measured point-spread-function for a 1st order stray-light correction before sinogram placement.28 A 5 × 5 kernel median filter is then applied to each projection image before it is downsized to the desired pixel∕voxel size. A final, fully corrected reconstruction map of radiation induced ΔOD is obtained in the following way. The stray-light corrected, median filtered, and downsized postirradiation projection images are divided by the corresponding preirradiation projections, to create a division-sinogram shown in the upper right panel of Fig. 2. Accurate placement of the dosimeter during prescan and postscan through the docking mechanism ensures coregistered data such that this division removes any common imperfections in the dosimeter. This works well, and even the edge artifacts are greatly reduced. The division-sinogram is then fed to the MATLAB iradon function with a Ram–Lak filter which reconstructs axial slices of the radiation induced ΔOD through the dosimeter (shown in lower right panel of Fig. 2). Deconvolution can be achieved in ∼15 min on a multicore system with parallel processing. Creating the sinogram and reconstruction typically takes less than a minute.
Figure 2.
DLOS reconstruction graphical user interface. Upper left quadrant displays projection images associated with the preirradiation scan, and the lower left displays projection images of the postirradiation scan. In this example, the dosimeter was irradiated with a single open beam incident on the side of the dosimeter (from right to left in the projection image lower left panel). The stray-light correction is applied to each prescan and postscan projection prior to reconstruction. The right column displays the ratio sinogram (upper panel) with units of μ·x, and reconstructed slice (lower panel) in units of μ (pixel−1) associated with the row indicated by the dashed line on the projection images.
Stray and spectral corrections
Broad-beam telecentric imaging is prone to inaccuracies if care is not taken to ensure the measurements have been properly corrected for stray-light and spectral artifacts.28, 29 The DLOS system has inherently very low scatter by virtue of the matched telecentric source and imaging lenses. Scatter is also low because the PRESAGE dosimeter is highly transparent and does not contain a large scatter component. Nevertheless, the dynamic range of the system without stray-light correction is observed to be less than the camera’s manufacturer specification of ∼60 dB. Investigations revealed the cause to be internal to the imaging lens. High intensity light encompassing a small region of the detector creates a relatively uniform light bath over the entire array giving artificially high readings to the low intensity regions of the camera. To overcome this, a stray-light correction was created which deconvolves a measured, spatially invariant point-spread-function allowing the system to image realizing the full dynamic range of the CCD detector. Details of the method of stray-light correction, and validation tests, are described in a separate article.28
The LED source of the DLOS is polychromatic, and both the absorbance of PRESAGE and the camera sensitivity are wavelength dependent. As light passes through an irradiated dosimeter, the spectrum will change (due to wavelength dependent absorption) and this can lead to spectral artifacts. These effects were eliminated by using a 10 nm band pass filter, although software correction is also possible.29 Recent improvements in manufacturing process of PRESAGE yield dosimeters with reduced Schlieren bands, which enable the use of the narrow band pass filter. In other PRESAGE formulations, the use of narrow band filter may exacerbate the Schlieren bands, and in these cases the software correction may be preferable.
Commissioning tests
Commissioning of the DLOS system consisted of characterizing the dynamic range, spatial resolution, noise, temporal variations in the light source, and the uniformity of the flood field. Tests were performed independently of the dosimeter in order to isolate the performance of the scanner. Basic tests of mechanical accuracy of rotation and geometrical distortion showed errors to be negligible. The dynamic range was determined by placing varying combinations of neutral density absorption filters of known OD in the beam path. Projection images were acquired and comparison of measured and known OD performed. The smallest theoretical spatial resolution is 350 μm (∼175 μm voxel size), but the actual resolution may be less due to system imperfections. This was investigated by measuring a modulation transfer function (MTF) by two independent methods. First, a series of 100 μm wires placed in different spatial frequency groupings was imaged tomographically to determine the line-pair-per-mm resolving power. The second involved imaging one of the wires tomographically, measuring the corresponding impulse response, and converting to an MTF by applying a Fourier transform.
Contrast in the reconstructed image is primarily limited by the dynamic range of the scanner and the size of the dosimeter. When a larger dosimeter is irradiated, the ΔOD per voxel must reduce as not to exceed the dynamic range of the DLOS. In order to predict the contrast to noise ratio for any given irradiation, noise of the scanner must be well understood and characterized. Noise was measured in two scenarios – with and without a dosimeter present in the aquarium. Noise measurements were made on individual projection images and reconstructed images with varying voxel sizes. Instability of the light source could cause inconsistent OD measurements in different projections. Light source temporal variations were studied by obtaining a flood image from the moment the LED was powered on in 1 min intervals for a 1 h period. These images also enabled investigation of flood field uniformity.
Benchmarking tests
Irradiations
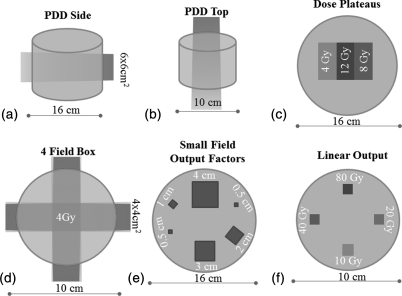
A series of simple irradiations were performed to investigate performance of the DLOS∕PRESAGE system. Six cylindrical dosimeters were irradiated, three 16 cm diameter and three 10 cm diameter. Irradiations were designed to test the accuracy of the system in a variety of different scenarios and regions in the dosimeter (Fig. 3). These included a single open beam irradiation (6 MV, 6 × 6 cm2) incident from the side [Fig. 3a], which tested accuracy close to the edges of the dosimeter, and accuracy when very long path-lengths of the dosimeter (in the axial tomographic plane) have been irradiated. Another single open beam irradiation this time incident on the top surface [6 MV, 4 × 4 cm2 – Fig. 3b], tested accuracy near the top and bottom flat surfaces of the dosimeter, and when shorter path-lengths are irradiated to higher doses. In the third irradiation [Fig. 3c], two square beams (6 MV, 6 × 6 cm2) were incident on the top surface but spatially separated by 3 cm. The two beams were given different doses, 4 and 8 Gy, respectively, at dmax, such that three dose plateau regions were created in the axial plane. This pattern enabled investigation of accuracy in regions of very steep gradients interspersed with very flat plateau regions. The fourth irradiation consisted of a simple four-field-box delivery, without any modulation or wedges, which enabled testing of a more clinically relevant geometry. The first four benchmark irradiations represent the simplest of deliveries, such that a commissioned Eclipse treatment planning system (AAA algorithm) could be used to calculate the gold standard 3D dose distribution against which to compare the DLOS∕PRESAGE measured 3D distributions. It is critical that a 3D dosimetry system can accurately reproduce such simple deliveries.
Figure 3.
Benchmarking irradiation tests. A series of six irradiations were performed on two different sized dosimeters to characterize the agreement between measured and simple known dose distributions.
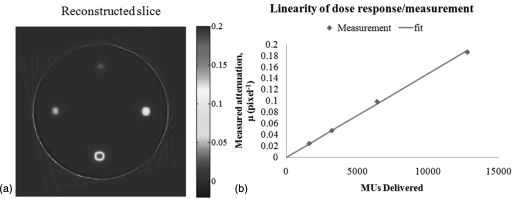
The two remaining benchmark irradiations involved delivering various small radiosurgery fields from a Varian Trilogy machine. In Fig. 3e, a range of small fields were delivered in exactly the same pattern as that studied extensively by Clift et al.30 Clift et al. determined output factors in a PRESAGE dosimeter of the same size, but imaged with the OCTOPUS optical-CT scanner from MGS Research.11, 31, 32 Excellent agreement in small field output factor determination was obtained between OCTOPUS∕PRESAGE and independent EBT film and the initial commissioning measurements (radiosurgery ion-chamber and diodes). The OCTOPUS is a single scanning laser system, similar to the raster scanning systems described in Sec. 1, and is known to be accurate but very slow. By repeating this experiment imaging with DLOS instead of OCTOPUS, a rigorous test and comparison is conducted on the accuracy and consistency of the two scanners, and also against the independent EBT, chamber, and diode measurements. The key difference between DLOS and OCTOPUS is that the former is potentially more susceptible to stray-light artifacts. An attractive feature of this experiment is that stray-light contamination would be progressively more pronounced in the smaller fields, enabling visualization of any such effect. Small field output factor and PDD measurements are challenging with conventional dosimeters, but should be well suited for 3D dosimetry techniques which lack directional and volume averaging effects, and where positioning errors are eliminated. In the final benchmark irradiation [Fig. 3f] the same small field (6 MV, 1 cm square) is delivered at four equi-spaced locations incident on the top surface, but given widely varying doses, 10, 20, 40, and 80 Gy. This test enabled study of the accuracy and linearity over a wide range of doses, and also would reveal any stray-light or spectral artifacts which would be much more pronounced in the smaller higher dosed fields.
Verification plan
A treatment plan corresponding to each irradiation [Figs. 3a, 3b, 3c, 3d] was created in a commissioned Eclipse treatment planning system (TPS) for independent verification. A CT scan of each dosimeter was imported into the Eclipse for the purpose of dose calculation within the dosimeters. The fields were set up according to the respective delivery and an AAA algorithm calculated the dose onto grid comprised of 2.5 mm voxel edge lengths. The treatment plan was then exported from Eclipse and imported to CERR (Ref. 33) for registration with the measured dose distribution and analysis.
Analysis
The first four benchmark irradiations were compared to the commissioned Eclipse TPS calculation. Reconstructed 3D maps of the radiation induced ΔOD, as described at end of Sec. 2A1 were imported into CERR for registration. The measured data were manually registered and normalized to the calculated plans. The normalization involved taking the median value of a region of interest in the measured distribution and normalizing it to a corresponding median value of the same region of interest in the calculated distribution. This reduced the negative effects noise and dose gradients could have on the normalization process. The TPS dose grid was resampled to match that of the measured grid and a series of NDD (Ref. 34) (normalized dose distribution – see below) analyses were run with different dose difference (ΔD) and distance to agreement (Δd) criteria. The data within 7 mm of the edges were ignored for analysis to avoid edge artifacts. This analysis looked to offer insight in determining the appropriate gamma or modified NDD analysis (ΔD and Δd), and what percentage of passing voxels would constitute “passing” if these techniques were instituted for clinical verification of delivery.
NDD (Ref. 34) is a similar metric to the more commonly used gamma.35 In our implementation, NDD passing values were scaled to range from −1 to +1, where positive∕negative values mean the measured dose is higher∕lower than the planned dose. This is an advantage over the gamma analysis, where this distinction is lost. To fail the NDD metric (i.e., value > + 1 or < − 1) both ΔD and Δd criteria must be exceeded. An important aspect of our NDD analysis is that it was evaluated in 3D. This means that at every point in the planned distribution, NDD is determined from a 3D search in the measured distribution.
For the last two benchmark cases [Figs. 2e, 2f] gold standard values of the output factors were taken from Clift et al. (PMB 55, 2010)30 These included the original commissioned output factors determined by a radiosurgery ion-chamber and diode measurements.
Results and Discussion
Commissioning data
Light source
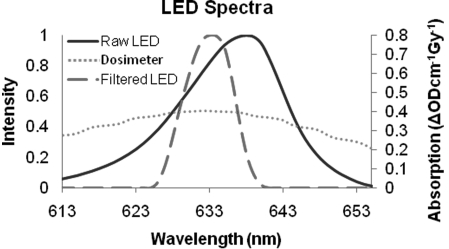
Figure 4 shows the raw LED spectrum (solid-line) exiting the collimation lens as determined by spectrometer. When a narrow band filter (632 ± 5 nm) is placed in-front of the LED, the filtered spectrum is obtained (long dashed line). The short dashed line in Fig. 4 is the absorbance profile of irradiated PRESAGE. Although the band pass filter does not make the spectrum monochromatic, it does make the spectrum narrow relative to the dosimeter response profile, making it an effective solution for spectral artifacts.
Figure 4.
Spectral characteristics of DLOS LED light source and PRESAGE response to dose (ΔODcm−1 Gy−1). It is important to avoid spectral artifacts arising from preferential absorption in PRESAGE of light at different wavelengths. An effective solution is to apply a narrow band-pass filter (Filtered LED) to ensure consistent absorption at all wavelengths [analytic corrections are also described in Thomas et al. (Ref. 29)].
Figure 5 shows characteristics of the flood field obtained with the DLOS system. A mean and standard deviation of 2995 ± 202 are observed, indicating a ±7% variation. It is important that the flood be as uniform as possible, in order to make maximum use of the dynamic range of CCD. Benchmarking the spatial variation of the flood field was important for two reasons. First, any future misalignment between the source and imaging lenses would be easily detectable through comparing the flood field with the original. Second, more informed decisions in regards to fluid tinting can be made from the flood. When the bright spot is more central to the field of view (FOV), tinting the fluid to a similar level to edges of the dosimeter may allow the user to maximize the usable dynamic range of the system. If however, the flood indicates a dull region in the center of the FOV then it may be better to make the fluid darker than the edges of the dosimeter.
Figure 5.
Characteristics of DLOS light source. (A) Temporal variation indicating ∼45 min is needed to stabilize, (B) flood field image of the aquarium containing only refractive index matching fluid, and (C) a line profile from the dashed line in (B) showing the uniformity from one side of the scanner to the other.
The DLOS system data collection generally occurs over a 5–15 min period depending on the number of projections collected. Figure 5a indicates that the light source needs about 45 min to stabilize its output. Without this stabilization period, the scan will be subject to errors and artifacts caused by the light source. Attenuation values could be falsely high or low depending on when the flood field is taken (before or after the scan) since the reconstruction values give attenuation relative to the surrounding medium, which could be higher or lower than the values in the acquisition.
Spatial resolution, dynamic range, and noise
An important question to answer in determining the limitations of the system is the spatial resolution of reconstructed images. The MTF was measured with two different methods to ensure its accuracy. Figure 6a shows the results obtained from both the line pair grouping and the transform of the impulse response. The system is capable of excellent contrast up to a frequency of 1 l p∕mm indicating it has potential for small field dosimetry as well as the typically larger fields in clinical dosimetry. The highest spatial resolution is estimated to be ∼0.5 mm isotropic where the MTF is ∼15%.
Figure 6.
Characteristics of DLOS imaging performance (A) MTF of reconstructed images as measured by line pair groupings of thin wires (blue) and the Fourier transform of the PSF of one thin wire, (B) noise versus reconstructed voxel size for two scenarios, corresponding to with∕without an irradiated dosimeter present in the fluid bath, and (C) scanner accuracy determined by using DLOS to measure the OD of known neutral density filters, in 2D projection images.
Image noise is another important metric to understand for an optical-CT scanner. Image noise gives an important indication of the minimum detectable dose and aids in determining real features from noise discrepancies. The noise present in flood and dark corrected projection images is 0.36% of the pixel value when acquired with 20 averages without the normal practice of applying a 5 × 5 median filter. Noise was determined by sampling regions of interest in the dose plateau benchmark irradiation (Fig. 2). The data set was reconstructed several times with different voxel sizes. Resultant noise in reconstructed images is dependent upon the reconstructed voxel size and a trend can be seen in Fig. 6b. The noise falls off rapidly initially as the voxel size increases but looks to approach an asymptote as the voxel size continues to increase.
Knowing the systems dynamic range guides several decisions in 3D dosimetry. The total dose delivered to the dosimeter can be set (e.g., by delivering multiple fractions) such that the expected maximum line-integral of attenuation matches the dynamic range of the system. The dynamic range of the DLOS system can be taken from Fig. 6c. The plot shows Measured OD values versus nominal ND filter values as obtained by scatter corrected projection images. The system accurately plots the OD up to 3, indicating a dynamic range of at least 60 dB.
Benchmarking data
The agreement between the Eclipse and DLOS∕PRESAGE 3D dose distributions were excellent as shown in Table TABLE I.. The table includes passing NDD rates for several different criteria for ΔD and Δd, all evaluated for any point that received >5% of the maximum dose (i.e., 5% dose threshold). Recent reports conclude that the 3%, 3 mm criteria is most commonly encountered in clinical QA,36 and this row is highlighted in italics. For 3%, 3 mm, the average passing 3D NDD rate was 97.4% ± 0.6% for the 5% threshold. In general the failing regions were located near the edges of the dosimeters. Typical noise values are given, and indicate very low system noise for both dosimeter sizes. A more detailed presentation of the comparison of measured and calculated 3D dose distributions, for each benchmark data set, is given below in the corresponding subsection. In each case, two orthogonal planes through the calculated and measured dose distributions are shown side-by-side to facilitate comparison. Overlay isodose plots (30, 50, 70, 90, and 95%) of each plane are also included, enabling direct comparison of measured (solid-line) and calculated (dashed line) isodoses. The 3D passing NDD rate for 3%, 3 mm criteria 5% dose threshold, is included on the plot for convenience and context. In the available space, this combination of images and plots was felt to best convey the quality of the DLOS∕PRESAGE data, and the quality of the agreement with the Eclipse. A further figure is added at the end of this section to illustrate line-profile agreement and noise.
Table 1.
3D NDD pass rates for four simple benchmark irradiations where the TPS distribution is considered the gold standard. Highlighted in italics are the most commonly used accepted standards in radiation therapy clincs (Ref. 36).
| PDD top | PDD side | Dose plateaus | four-field-box | ||
|---|---|---|---|---|---|
| Diameter (cm) | 10 | 16 | 16 | 10 | |
| Max dose (Gy) | 10 | 6 | 12 | 4 | |
| Noise (cGy∕%) | 9.8∕1.0 | 10.0∕1.7 | 5.2∕0.43 | 7.0∕1.8 | |
| NDD pass rate | 5%, 3 mm | 99.5% | 99.1% | 98.9% | 99.9% |
| 5%, 2 mm | 99.3% | 97.3% | 97.1% | 99.5% | |
| 3%, 3 mm | 97.3% | 96.5% | 97.7% | 97.9% | |
| 3%, 2 mm | 96.3% | 93.6% | 95.3% | 96.2% | |
| 2%, 2 mm | 94.0% | 84.5% | 90.9% | 86.0% |
Benchmark data set 1 – PDD from the side
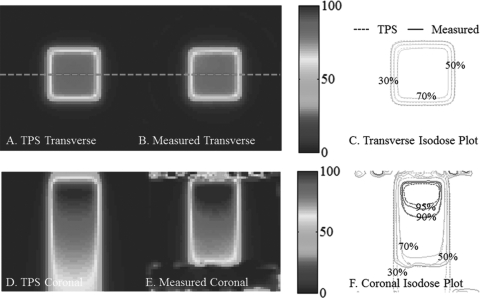
The central coronal and transverse dose-planes through the single beam irradiation incident on the side of the dosimeters is shown in Fig. 7. The open field was 6 × 6 cm2 square, and the dosimeter was 16 cm diameter. Good agreement is observed between measured and calculated isodose lines, as expected from the 97% NDD 3D pass rates. This irradiation tested the system’s accuracy close to the edge of the dosimeter, and when a mix of long and short irradiated path-lengths is present. Good agreement is observed within ∼7 mm of the edge of the dosimeter.
Figure 7.
PDD from the side benchmarking test with a 96.5% pass rate. (A) and (C) Coronal and transverse views of DLOS∕PRESAGE measured dose distributions with normalized dose colormap in percentage maximum dose. (B) and (D) Corresponding measured and calculated isodose-overlay maps.
Benchmark data set 2 - PDD from the top
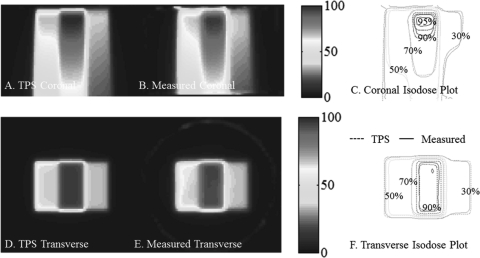
The central transverse and coronal dose-planes through the single beam irradiation incident on the top of the dosimeter is shown in Fig. 8. The open field was 4 × 4 cm2 square, and the dosimeter was 10 cm diameter. Good agreement is observed between measured and calculated isodose lines, as expected from the 97% NDD 3D pass rates. A loss of backscatter is observed to cause discrepancies in isodose lines close to the bottom of the dosimeter. It is not known how well AAA models this region. The DLOS∕PRESAGE system reported slight differences in the buildup region as can be seen from close inspection of the 95% lines.
Figure 8.
PDD from the top benchmarking test with a 97.3% pass rate. (A) and (C) Transverse and coronal views of DLOS∕PRESAGE measured dose distributions with normalized dose colormap in % maximum dose. (B) and (D) Corresponding measured and calculated isodose-overlay maps.
Benchmark data set 3 – dose plateaus
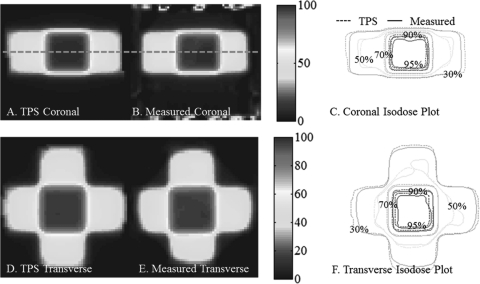
The central coronal and transverse dose-planes through the two-beam dose plateau irradiation incident on the top of the dosimeter are shown in Fig. 9. The open fields were 6 × 6 cm2 square, separated by 3 cm, and the dosimeter was 16 cm diameter. Good agreement is observed between measured and calculated isodose lines, as expected from the 98% NDD 3D pass rates. Slight differences are observed, however, between the high isodose lines. This distribution is sensitive to spectral artifacts which would have a greater affect on higher dose plateaus. The good agreement at all plateaus indicates minimal spectral artifacts. Good agreement is also observed in the gradient regions confirming high-spatial resolution capability.
Figure 9.
Dose Plateaus benchmark tests with a 97.7% 3D NDD pass rate. (A) and (C) Coronal and Transverse views of DLOS∕PRESAGE measured dose distributions with normalized dose colormap in % maximum dose. (B) and (D) Corresponding measured and calculated isodose-overlay maps.
Benchmark data set 4- 4 field box
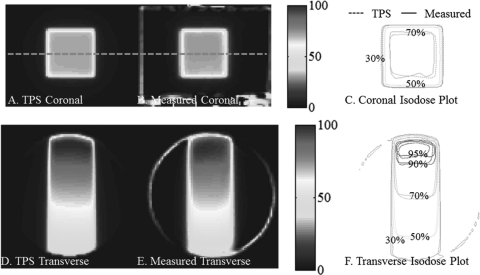
The central coronal and transverse dose-planes through four-field-box irradiation are shown in Fig. 10. The open fields were 4 × 4 cm square, and the dosimeter was 10 cm diameter. Good agreement is observed between measured and calculated isodose lines, as expected from the 98% NDD 3D pass rates. Some meandering of the 50% isodose line is observed, which is likely a consequence of the shallow gradient at this isodose level. The four-field-box plan was the most complex of the 1st four experiments, but represents the most clinically familiar irradiation tested. The plan tests accuracy in the presence of steep dose gradients, dose from edge to edge in the dosimeter, and with a centralized high-dose region.
Figure 10.
Four-field-box benchmarking test with a 97.9% pass rate. (A-B) and (D-E) Coronal and Transverse views of DLOS∕PRESAGE measured dose distributions with normalized dose colormap in % maximum dose. (C) and (F) Corresponding measured and calculated isodose-overlay maps.
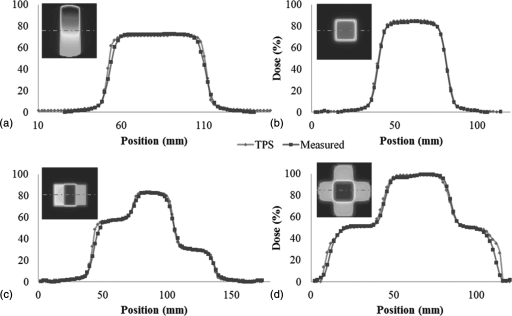
A comparison of line profiles through the first 4 bench-mark tests is shown in Fig. 11.
Figure 11.
Line Profiles through the first four benchmark data sets (Fig. 3) illustrate consistently high quality data, with low noise (Eclipse = diamond markers, DLOS∕PRESAGE = square markers). (A) PDD from the side, (B) PDD from the top, (C) dose plateaus, and (D) four-field-box. These profiles are un-smoothed after reconstruction, although 5 × 5 pixel median filters were applied prior to the downsizing of the original projection images to the reconstruction grid size. All profiles correspond to the middle row of pixels in the upper left panels of the image in each plot as indicated by the dashed line. In each case the noise was <2% of the maximum dose.
Benchmark data set 5 – small field output factors
3D dosimetry is uniquely suited to small field dosimetry because of the potential to eliminate positioning errors, and the lack of volume averaging and directional sensitivity.30, 37 The purpose of this test was to benchmark the accuracy of DLOS∕ PRESAGE to measure small field output factors. By exactly repeating the experiment in Clift et al., but this time with DLOS∕ PRESAGE, an intercomparison between all dosimetry techniques was achieved. The results are shown in Table TABLE II., with the percent differences with respect to the mean commissioning, EBT, and PRESAGE∕OCTOPUS data in the far right column. The results show DLOS∕PRESAGE can accurately measure small field output factors down to 5 mm2, and indicate that the stray-light correction is adequately removing stray signal for the extreme situations of small field dosimetry.
Table 2.
Small field output factors measured by DLOS∕PRESAGE with comparison to the data acquired on the same treatment machine as reported in Clift et al. Following each datum is the uncertainty of each measurement. The final column is a list of the percent difference of the DLOS∕PRESAGE with respect to the mean of commissioning, EBT, and OCTOPUS∕PRESAGE data.
| Field size (mm) | Commissioning data | EBT (Ref. 30) | OCTOPUS∕PRESAGE (Ref. 30) | DLOS∕PRESAGE (this work) | Percent difference |
|---|---|---|---|---|---|
| 30 × 30 | – | 0.892 ± 0.076 | 0.901 ± 0.027 | 0.898 ± 0.027 | 0.7% |
| 20 × 20 | 0.858 | 0.886 ± 0.075 | 0.856 ± 0.026 | 0.890 ± 0.027 | 2.7% |
| 10 × 10 | 0.767 | 0.795 ± 0.066 | 0.789 ± 0.024 | 0.802 ± 0.024 | 2.3% |
| 5 × 5 | 0.626 | 0.636 ± 0.054 | 0.649 ± 0.019 | 0.611 ± 0.018 | 4.0% |
Benchmark data set 6 – linear measurement
The final benchmark test investigated the linearity of dose-response of DLOS∕PRESAGE over a wide range of dose, encompassing the highest doses given in radiosurgery (e.g., ∼80 Gy for trigeminal neuralgia radiosurgery). The result is shown in Figs. 12a, 12b. A highly linear response is observed over the entire dose range tested. This test is potentially sensitive to subtle spectral and scatter artifacts because the fields are all very small (1 cm2), but the OD varies dramatically for the different deliveries. The strong linearity indicates these effects are negligible even in this extreme case when properly accounted for.
Figure 12.
(A) Axial reconstruction (0.5 mm3 resolution) of the 4–1 cm2 small field deliveries to doses of 10, 20, 40, and 80 Gy. The y scale is attenuation coefficient per pixel, showing a factor 10 variation between beams. (B) Four pixel-average region of interest values plotted versus the delivered monitor units, indicating strong linearity up to 80 Gy.
Calibration of DLOS∕ PRESAGE™ to absolute dose
All data presented so far have been relative, in that the measured 3D distribution is normalized to the planned distribution. The strong linearity of PRESAGE dose-response makes this normalization a very simple scaling procedure. However, estimating absolute dose values for 3D PRESAGE distributions is an important goal. Two methods of achieving this have been investigated to-date. In the first, remainder PRESAGE material from the same batch as the experimental dosimeter is poured into ∼6 optical-cuvettes (1 × 1 × 6 cm3 dimensions). The OD of these cuvettes is then measured using a spectrophotometer before and after the cuvettes are irradiated to known doses spanning the dose range delivered to the experimental dosimeter giving the ΔOD·Gy−1·cm−1. The calibration curve obtained from the cuvettes can then be applied to the experimental dosimeter to convert from relative to absolute dose. This method is found to yield absolute dose agreement typically within about 5% of the calculated plan. One possible reason for the discrepancy is the measurement devices. The cuvettes are measured with a spectrophotometer which utilizes a prism to separate out the desired wavelength from a white-light source whereas the dosimeters are measured in the DLOS system which may have a slightly different illumination spectrum causing this discrepancy. Subtle differences have been observed, however, in the ageing and sensitivity characteristics of the very small cuvette volumes and the much larger dosimeter volumes. The precise cause is under investigation, but is believed to be related to the different rate of curing of the polymer in the two cases, and resulting subtle differences in the polymer lattice strength. In the second method, a separate treatment is delivered to an alternate PRESAGE dosimeter which is identical except that it has a central channel to house an ion-chamber. In this instance, however, the absolute dose in PRESAGE has to be determined using a different dosimetry system (e.g., ion-chamber placed inside PRESAGE dosimeter). Until these effects are better understood, the DLOS∕ PRESAGE system is best used in relative mode as described here.
For illustration we do include here the results of absolute dose calibration for the dose plateaus benchmark data set shown in Fig. 9. Four cuvettes from this batch were irradiated to known doses and measured in a spectrophotometer to obtain a measured ΔOD·Gy−1·cm−1. The cuvettes responded with a 0.0203 ΔOD·Gy−1·cm−1which translates to a calibrated dose in the central region of the high-dose plateau of 10.0 Gy for the transverse plane shown in Fig. 9. Eclipse’s AAA algorithm calculates a dose of 10.4 Gy, a difference of 4% from Eclipse. The main source of this error is still under investigation, but probably due to the volume effect described above.
Application of 3D clinical data
One of the goals of this work was to determine appropriate NDD∕gamma criteria for use in clinical dosimetric verification of patient QA deliveries. To investigate this, multiple analysis were performed where the ΔD and Δd criteria were varied (the 5% dose threshold was kept constant). Table TABLE I. displays the results. A recent survey found for the most common criteria in current use for planar devices is 3% ΔD, 3 mm Δd. A greater than 90% passing rate (evaluated for all voxels receiving >5% dose threshold) was required to qualify as passing the QA test. From Table TABLE I., a 3%, 2 mm analysis will meet the 90% cutoff pass rate for the benchmark sets. The 2%, 2 mm criteria would be too stringent.
CONCLUSION
This work represents a key milestone for the DLOS∕PRESAGE 3D dosimetry system. All components in the DLOS imaging chain are optimized, and this, coupled with improved quality of PRESAGE dosimeters (resulting from improved manufacturing processes leading to reduced Schlieren bands and more transparent dosimeters), has created a uniquely useful tool for 3D dosimetry. The telecentric nature of the DLOS system proved key to achieving high accuracy with low noise over short imaging times (<15 min). Telecentric imaging brings two advantages, both of which help reduce the problem of stray-light, which can be a major source of error and challenge for fast broad-beam scanning systems.38, 39, 40, 41 First the amount of scattered light in projection images is small due to the telecentric acceptance criteria of 0.1°. Second, the residual stray-light, originating mostly from refraction and reflection within the imaging lens, behaves in a manner that can be accurately corrected using a spatially invariant point-spread-function deconvolution.28
DLOS∕PRESAGE has now been commissioned and benchmarked for clinical application for the dosimeters studied in this work (10 and 16 cm diameter). The system was shown to be accurate for relative 3D dosimetry, with low noise (<2% of maximum dose). When applied to the verification of unknown complex dose distributions, NDD passing rates of >90% (3%, 2 mm) or >95% (3%, 3 mm) are shown to be appropriate thresholds.
References
- Doran S., “The history and principles of optical computed tomography for scanning 3-D radiation dosimeters,” J. Phys.: Conf. Ser. 56, 45–57 (2006). 10.1088/1742-6596/56/1/005 [DOI] [Google Scholar]
- Guo P., Adamovics J., and Oldham M., “A practical three-dimensional dosimetry system for radiation therapy,” Med. Phys. 33, 3962–3972 (2006). 10.1118/1.2349686 [DOI] [PMC free article] [PubMed] [Google Scholar]
- Oldham M., “3D dosimetry by optical-CT scanning,” J. Phys.: Conf. Ser. 56, 58–71 (2006). 10.1088/1742-6596/56/1/006 [DOI] [PMC free article] [PubMed] [Google Scholar]
- Oldham M., Guo P., Gluckman G., and Adamovics J., “IMRT verification using a radiochromic/optical-CT dosimetry system,” J. Phys.: Conf. Ser. 56, 221–224 (2006). 10.1088/1742-6596/56/1/033 [DOI] [PMC free article] [PubMed] [Google Scholar]
- Oldham M., Sakhalkar H., Guo P., and Adamovics J., “An investigation of the accuracy of an IMRT dose distribution using two- and three-dimensional dosimetry techniques,” Med. Phys. 35, 2072–2080 (2008). 10.1118/1.2899995 [DOI] [PMC free article] [PubMed] [Google Scholar]
- Sakhalkar H., Sterling D., Adamovics J., Ibbott G., and Oldham M., “Investigation of the feasibility of relative 3D dosimetry in the Radiologic Physics Center Head and Neck IMRT phantom using presage/optical-CT,” Med. Phys. 36, 3371–3377 (2009). 10.1118/1.3148534 [DOI] [PMC free article] [PubMed] [Google Scholar]
- Sakhalkar H. S., Adamovics J., Ibbott G., and Oldham M., “A comprehensive evaluation of the PRESAGE/optical-CT 3D dosimetry system,” Med. Phys. 36, 71–82 (2009). 10.1118/1.3005609 [DOI] [PMC free article] [PubMed] [Google Scholar]
- Sakhalkar H. S., Adamovics J., Ibbott G., and Oldham M., “An investigation into the robustness of optical-CT dosimetry of a radiochromic dosimeter compatible with the RPC head-and-neck phantom,” J. Phys.: Conf. Ser. 164, 012059 (2009). 10.1088/1742-6596/164/1/012059 [DOI] [PMC free article] [PubMed] [Google Scholar]
- Sakhalkar H. S. and Oldham M., “Fast, high-resolution 3D dosimetry utilizing a novel optical-CT scanner incorporating tertiary telecentric collimation,” Med. Phys. 35, 101–111 (2008). 10.1118/1.2804616 [DOI] [PMC free article] [PubMed] [Google Scholar]
- Baldock C., De Deene Y., Doran S., Ibbott G., Jirasek A., Lepage M., McAuley K. B., Oldham M., and Schreiner L. J., “Polymer gel dosimetry,” Phys. Med. Biol. 55, R1–63 (2010). 10.1088/0031-9155/55/5/R01 [DOI] [PMC free article] [PubMed] [Google Scholar]
- Gore J. C., Ranade M., Maryanski M. J., and Schulz R. J., “Radiation dose distributions in three dimensions from tomographic optical density scanning of polymer gels: I. Development of an optical scanner,” Phys. Med. Biol. 41, 2695–2704 (1996). 10.1088/0031-9155/41/12/009 [DOI] [PubMed] [Google Scholar]
- Maryanski M. J., Zastavker Y. Z., and Gore J. C., “Radiation dose distributions in three dimensions from tomographic optical density scanning of polymer gels: II. Optical properties of the BANG polymer gel,” Phys. Med. Biol. 41, 2705–2717 (1996). 10.1088/0031-9155/41/12/010 [DOI] [PubMed] [Google Scholar]
- Wolodzko J. G., Marsden C., and Appleby A., “CCD imaging for optical tomography of gel radiation dosimeters,” Med. Phys. 26, 2508–2513 (1999). 10.1118/1.598772 [DOI] [PubMed] [Google Scholar]
- Doran S. J., Koerkamp K. K., Bero M. A., Jenneson P., Morton E. J., and Gilboy W. B.,“A CCD-based optical CT scanner for high-resolution 3D imaging of radiation dose distributions: Equipment specifications, optical simulations and preliminary results,” Phys. Med. Biol. 46, 3191–3213 (2001). 10.1088/0031-9155/46/12/309 [DOI] [PubMed] [Google Scholar]
- Brady S. L., Brown W. E., Clift C. G., Yoo S., and Oldham M., “Investigation into the feasibility of using PRESAGE/optical-CT dosimetry for the verification of gating treatments,” Phys. Med. Biol. 55, 2187–2201 (2010). 10.1088/0031-9155/55/8/005 [DOI] [PMC free article] [PubMed] [Google Scholar]
- Thomas A. and Oldham M., “Fast, large field-of-view, telecentric optical-CT scanning system for 3D radiochromic dosimetry,” J. Phys.: Conf. Ser. 250, 1–5 (2010). [DOI] [PMC free article] [PubMed] [Google Scholar]
- Thomas A., Pierquet M., and Oldham M., “Achieving accurate radiochromic optical-CT imaging when using a polychromatic light source,” J. Phys.: Conf. Ser. 250, 210–214 (2010). [DOI] [PMC free article] [PubMed] [Google Scholar]
- Duthoy W., De Gersem W., Vergote K., Boterberg T., Derie C., Smeets P., De Wagter C., and De Neve W., “Clinical implementation of intensity-modulated arc therapy (IMAT) for rectal cancer,” Int. J. Radiat. Oncol., Biol., Phys. 60, 794–806 (2004). 10.1016/j.ijrobp.2004.04.016 [DOI] [PubMed] [Google Scholar]
- Duthoy W., De Gersem W., Vergote K., Coghe M., Boterberg T., De Deene Y., De Wagter C., Van Belle S., and De Neve W., “Whole abdominopelvic radiotherapy (WAPRT) using intensity-modulated arc therapy (IMAT): First clinical experience,” Int. J. Radiat. Oncol., Biol., Phys. 57, 1019–1032 (2003). 10.1016/S0360-3016(03)00663-1 [DOI] [PubMed] [Google Scholar]
- Gustavsson H., Karlsson A., Back S. A., Olsson L. E., Haraldsson P., Engstrom P., and Nystrom H., “MAGIC-type polymer gel for three-dimensional dosimetry: Intensity-modulated radiation therapy verification,” Med. Phys. 30, 1264–1271 (2003). 10.1118/1.1576392 [DOI] [PubMed] [Google Scholar]
- Karaiskos P., Petrokokkinos L., Tatsis E., Angelopoulos A., Baras P., Kozicki M., Papagiannis P., Rosiak J. M., Sakelliou L., Sandilos P., and Vlachos L., “Dose verification of single shot gamma knife applications using VIPAR polymer gel and MRI,” Phys. Med. Biol. 50, 1235–1250 (2005). 10.1088/0031-9155/50/6/013 [DOI] [PubMed] [Google Scholar]
- Low D. A., Dempsey J. F., Venkatesan R., Mutic S., Markman J., Mark Haacke E., and Purdy J. A., “Evaluation of polymer gels and MRI as a 3-D dosimeter for intensity-modulated radiation therapy,” Med. Phys. 26, 1542–1551 (1999). 10.1118/1.598650 [DOI] [PubMed] [Google Scholar]
- Papagiannis P., Karaiskos P., Kozicki M., Rosiak J. M., Sakelliou L., Sandilos P., Seimenis I., and Torrens M., “Three-dimensional dose verification of the clinical application of gamma knife stereotactic radiosurgery using polymer gel and MRI,” Phys. Med. Biol. 50, 1979–1990 (2005). 10.1088/0031-9155/50/9/004 [DOI] [PubMed] [Google Scholar]
- Vergote K., De Deene Y., Claus F., De Gersem W., Van Duyse B., Paelinck L., Achten E., De Neve W., and De Wagter C., “Application of monomer/polymer gel dosimetry to study the effects of tissue inhomogeneities on intensity-modulated radiation therapy (IMRT) dose distributions,” Radiother. Oncol. 67, 119–128 (2003). 10.1016/S0167-8140(02)00376-6 [DOI] [PubMed] [Google Scholar]
- Vergote K., De Deene Y., Vanden Bussche E., and De Wagter C., “On the relation between the spatial dose integrity and the temporal instability of polymer gel dosimeters,” Phys. Med. Biol. 49, 4507–4522 (2004). 10.1088/0031-9155/49/19/005 [DOI] [PubMed] [Google Scholar]
- Gorjiara T., Hill R., Kuncic Z., Adamovics J., Bosi S., Kim J.-H., and Baldock C., “Investigation of radiological properties and water equivalency of PRESAGE dosimeters,” Med. Phys. 38, 2266–2274 (2011). 10.1118/1.3561509 [DOI] [PubMed] [Google Scholar]
- Guo P. Y., Adamovics J. A., and Oldham M., “Characterization of a new radiochromic three-dimensional dosimeter,” Med. Phys. 33, 1338–1345 (2006). 10.1118/1.2192888 [DOI] [PMC free article] [PubMed] [Google Scholar]
- Thomas A., Newton J., and Oldham M., “A method to correct for stray light in telecentric optical-CT imaging of radiochromic dosimeters,” Phys. Med. Biol. 56(14), 4433–4451 (2011). 10.1088/0031-9155/56/14/013 [DOI] [PMC free article] [PubMed] [Google Scholar]
- Thomas A., Pierquet M., Jordan K., and Oldham M., “A method to correct for spectral artifats in optical-CT dosimetry,” Phys. Med. Biol. 56, 3403–3416 (2011). 10.1088/0031-9155/56/11/014 [DOI] [PMC free article] [PubMed] [Google Scholar]
- Clift C., Thomas A., Adamovics J., Chang Z., Das I., and Oldham M., “Toward acquiring comprehensive radiosurgery field commissioning data using the PRESAGE/optical-CT 3D dosimetry system,” Phys. Med. Biol. 55, 1279–1293 (2010). 10.1088/0031-9155/55/5/002 [DOI] [PMC free article] [PubMed] [Google Scholar]
- Xu Y., Wuu C. S., and Maryanski M. J., “Performance of a commercial optical CT scanner and polymer gel dosimeters for 3-D dose verification,” Med. Phys. 31, 3024–3033 (2004). 10.1118/1.1803674 [DOI] [PubMed] [Google Scholar]
- Islam K. T., Dempsey J. F., Ranade M. K., Maryanski M. J., and Low D. A., “Initial evaluation of commercial optical CT-based 3D gel dosimeter,” Med. Phys. 30, 2159–2168 (2003). 10.1118/1.1593636 [DOI] [PubMed] [Google Scholar]
- Deasy J. O., Blanco A. I., and Clark V. H., “CERR: A computational environment for radiotherapy research,” Med. Phys. 30, 979–985 (2003). 10.1118/1.1568978 [DOI] [PubMed] [Google Scholar]
- Jiang S. B., Sharp G. C., Neicu T., Berbeco R. I., Flampouri S., and Bortfeld T., “On dose distribution comparison,” Phys. Med. Biol. 51, 759–776 (2006). 10.1088/0031-9155/51/4/001 [DOI] [PubMed] [Google Scholar]
- Low D. A., Harms W. B., Mutic S., and Purdy J. A., “A technique for the quantitative evaluation of dose distributions,” Med. Phys. 25, 656–661 (1998). 10.1118/1.598248 [DOI] [PubMed] [Google Scholar]
- Nelms B. E. and Simon J. A., “A survey on planar IMRT QA analysis,” J. Appl. Clin. Med. Phys. 8(3), pp. 76–90 (2007). [DOI] [PMC free article] [PubMed] [Google Scholar]
- Babic S., McNiven A., Battista J., and Jordan K., “Three-dimensional dosimetry of small megavoltage radiation fields using radiochromic gels and optical CT scanning,” Phys. Med. Biol. 54, 2463–2481 (2009). 10.1088/0031-9155/54/8/014 [DOI] [PubMed] [Google Scholar]
- Bosi S. G., Naseri P., and Baldock C., “Light-scattering-induced artifacts in a complex polymer gel dosimetry phantom,” Appl. Opt. 48, 2427–2434 (2009). 10.1364/AO.48.002427 [DOI] [PubMed] [Google Scholar]
- Olding T. and Schreiner L. J., “Cone-beam optical computed tomography for gel dosimetry II: Imaging protocols,” Phys. Med. Biol. 56, 1259–1279 (2011). 10.1088/0031-9155/56/5/003 [DOI] [PubMed] [Google Scholar]
- Bosi S. G., Brown S., Sarabipour S., De Deene Y., and Baldock C., “Modelling optical scattering artefacts for varying pathlength in a gel dosimeter phantom,” Phys. Med. Biol. 54, 275–283 (2009). 10.1088/0031-9155/54/2/007 [DOI] [PubMed] [Google Scholar]
- Olding T., Holmes O., and Schreiner L. J., “Cone beam optical computed tomography for gel dosimetry I: Scanner characterization,” Phys. Med. Biol. 55, 2819–2840 (2010). 10.1088/0031-9155/55/10/003 [DOI] [PubMed] [Google Scholar]


