

Abstract
In Staphylococcus aureus, the SaeRS two-component system (TCS) encoded by the saePQRS operon controls expression of major virulence factors, such as coagulase and alpha-hemolysin. The saePQRS operon has two promoters: P1 and P3. The P1 promoter, a strong promoter, is autoinduced and can transcribe all four genes. Compared with P1, P3 shows fairly low but constitutive promoter activity, and it transcribes only saeR and saeS, the two genes encoding response regulator SaeR and sensor kinase SaeS. However, the role of each promoter in sae signaling has not been rigorously defined. In this study, we found that the genuine transcription start site (TSS) of P3 is located 78 nucleotides downstream of the previously reported TSS. Subsequently, the P3 promoter sequence was identified and validated by mutagenesis analyses. Deletion of the saePQ region including the P1 promoter did not significantly alter the expression patterns of coagulase and alpha-hemolysin, two well-known sae target genes. Due to its L18P substitution in a transmembrane domain, SaeS in strain Newman has a constitutive kinase activity. Interestingly, the mutation also rendered the protein unstable, but the protein stability was restored by SaeQ, suggesting a possible SaeQ-SaeS interaction. Ironically, the same mutation seems to increase mRNA stability. SaeR appears to be stabilized by SaeS, possibly by a protein-protein interaction. Chromosomal mutation of P1 did not affect the expression pattern of coagulase and alpha-hemolysin. Based on these results, we conclude that transcription of saeRS from P3 is sufficient for target gene activation and that P1 is not involved in the activation.
INTRODUCTION
Staphylococcus aureus is an important human pathogen that causes various diseases, ranging from soft tissue infections to pneumonia and toxic shock syndrome (2, 28). The pathogenic versatility of the bacterium is, at least in part, due to the production of numerous virulence factors. The expression of these virulence factors is under the control of a network of transcription factors (e.g., SigB, Rot, MgrA, and SarA) and two-component regulatory systems (e.g., agr, srrAB, arlRS, vraSR, and saeRS) (8, 9, 11, 14, 23, 34, 47).
In bacteria, the two-component system (TCS) is a primary signal transduction mechanism by which bacteria adapt to environmental changes in response to various cues, such as nutrient concentrations, ionic strength, and membrane disturbances (5, 18). A typical TCS consists of a sensor histidine kinase (HK), commonly located in the membrane, and a response regulator (RR), which, in most cases, is a DNA binding protein in the cytoplasm (18). Upon receiving a cognate signal, HK autophosphorylates a conserved His residue; then, the phosphate group is transferred to a conserved Asp residue in the cognate RR. The phosphorylation of the RR most often alters the DNA binding activity of the RR, which, in turn, leads to changes in gene expression (18, 45).
Among the 16 TCSs in S. aureus, the SaeRS TCS plays a key regulatory role in the production of important virulence factors, such as coagulase (Coa), alpha-hemolysin (Hla), and fibronectin binding proteins (14, 16, 27, 34, 46). The TCS has been shown to contribute to in vivo survival of the bacterium and to the apoptosis of lung epithelial cells (27, 44). The sae operon, which encodes the SaeRS TCS, consists of four genes: saeP, saeQ, saeR, and saeS (Fig. 1) (13, 34). saeP and saeQ are predicted to produce a lipoprotein (146 amino acids [aa]) and a membrane protein (157 aa), respectively. However, the function of the proteins is unknown except for the fact that saePQ is dispensable for sae signaling (1, 30). The genes saeR and saeS encode the RR and HK, respectively. SaeR recognizes the binding sequence GTTAAN6GTTAA (where N represents any nucleotide) and, for DNA binding, needs to be phosphorylated by SaeS (35, 42). SaeS is a 351-aa polypeptide and is predicted to have two transmembrane helices at the N terminus. The two helices are separated by only 9 aa of extracellular residues. Since the extracellular domain is too small to be a signal binding domain, SaeS is regarded as an intramembrane-sensing HK (31). The saeS gene in strain Newman has a missense mutation (T53C), which leads to amino acid substitution L18P at the protein level (1). The L18P mutation is predicted to change the first transmembrane helix to a beta-sheet (1). Due to this mutation, Newman SaeS shows constitutive kinase activity (1, 30, 38). Interestingly, Schafer et al. showed that the biocide Perform and the detergent sodium dodecyl sulfate (SDS) activate sae signaling only in strain Newman, suggesting that the SaeS mutation also altered its sensing specificity (38). Herein, the saeS gene and SaeS protein in strain Newman are referred to as saeSP and SaeSP (where P is proline), respectively, while those in other strains without the mutation are referred to as saeSL and SaeSL (where L is leucine).
Fig. 1.

Identification of transcription start site of P3 promoter in the sae operon. (A) Physical map of the sae operon, with the DNA sequence given for the P3 promoter region. ORFs are shown as thick arrows, with their names given. Stem-loop structures are also indicated, with lollipop shapes. In the DNA sequence, two transcription start sites (TSSs) of P3 are indicated by bent arrows. Of the arrows, the boldface arrow indicates the TSS newly identified in this study, while the other arrow shows the previously identified TSS. The putative −10 and −35 sequences are underlined. The TG sequence of the “TGN” motif near the −10 region is in boldface. The sequence of P697, the primer used for amplification of P3L, is shown as an arrow. A, AleI. (B) Three transcriptional lacZ fusions for the P3 promoter. The DNA fragments (P3L, P3s, and P3t) indicated with solid lines under the ORF map were inserted into the promoterless reporter plasmid pYJ-lacZ. The relative LacZ activity of each fusion is shown to the right of the map. The assay was repeated three times, with similar results. Error bars represent standard deviations. A, AleI.
The sae operon has two promoters: P1 and P3 (Fig. 1A) (12). P3, also called PA or P2, resides in saeQ and produces an approximately 2-kb transcript encoding SaeR and SaeS (1, 12, 26). Although its activity is slightly autorepressed, the promoter is fairly constitutive, and the transcripts from the promoter are observed throughout growth phases (1, 12). On the other hand, the P1 promoter has two SaeR binding sites and requires the SaeRS TCS for its transcriptional activity (autoinduction) (12, 15, 34, 42). The P1 promoter activity is 2 to 30 times higher than that of the P3 promoter (12, 26). P1 transcription is affected by several global regulators. The quorum-sensing TCS agr and transcription regulator SarA positively regulates P1, while rot and sigB negatively regulate it (12, 26, 34). P1 has also been reported to be affected by several environmental stressors. A high NaCl concentration and acidic conditions repress the promoter activity, while subinhibitory concentrations of beta-lactam antibiotics, hydrogen peroxide, or human neutrophil peptides activate it (12, 22). Sometimes, these modulations of P1 activity were interpreted as a functional control of the SaeRS TCS. For example, rot was suggested to downregulate hla expression by repressing P1 activity (26).
For the SaeRS TCS, two distinct groups of target genes were identified: class I and class II (30). The induction of class I targets (e.g., coa, sae P1 promoter, fnbA, and eap) required a high level of phosphorylated SaeR (P-SaeR), while class II targets (e.g., hla and hlb) could be induced even at a basal level of P-SaeR (30), implying that the levels of affinity to P-SaeR vary among sae target genes. Intriguingly, when saeRS was overexpressed by an inducible promoter, the expression of both class I and class II targets was not significantly changed (30), suggesting that the overall sae signaling is not affected by the expression level of the signal transduction components. This dosage independence of the SaeRS TCS prompted us to define the role of the sae promoters in signaling, because the modulation of P1 activity has often been interpreted or implied as functional control of the SaeRS TCS. Since P1 activity is affected by multiple global regulators, clarifying its role in sae signaling will lead us to better understanding of the complex regulatory network in S. aureus.
MATERIALS AND METHODS
Bacterial strains, plasmids, and culture conditions.
The bacterial strains and plasmids used in this study are listed in Table 1. Escherichia coli and S. aureus were grown in Luria-Bertani broth and tryptic soy broth (TSB), respectively. However, for transduction of plasmids, heart infusion broth (HIB) supplemented with 5 mM CaCl2 was used. When necessary, antibiotics were added to the growth media at the following concentrations: ampicillin, 100 μg/ml; erythromycin, 10 μg/ml; and chloramphenicol, 5 μg/ml.
Table 1.
Bacterial strains and plasmids used in this study
| Strain/plasmid | Relevant characteristic | Source or reference |
|---|---|---|
| Strains | ||
| E. coli DH5α | Plasmid free, Lac− | Stratagene |
| S. aureus | ||
| RN4220 | Restriction deficient, prophage cured | 21 |
| Newman | Clinical isolate, L18P substitution in SaeS | 10 |
| USA300-0114 | Clinical isolate | NARSAa |
| USA300-P23 | USA300-0114 without plasmids 2 and 3 | This study |
| NMΔsae | sae operon deletion mutant of Newman | 42 |
| NM-P1m | Newman with P1 mutation | This study |
| USA-P1m | USA300-P23 with P1 mutation | This study |
| Plasmids | ||
| pYJ-lacZ | pYJ335 carrying a promoterless lacZ | 42 |
| pYJ-P3L-lacZ | pYJ-lacZ carrying P3L fragment | This study |
| pYJ-P3s-lacZ | pYJ-lacZ carrying P3s fragment | This study |
| pYJ-P3t-lacZ | pYJ-lacZ carrying P3t fragment | This study |
| pYJ-P3s10 m-lacZ | pYJ-P3s-lacZ with −12 and −13 substitutions | This study |
| pYJ-P3s35 m-lacZ | pYJ-P3s-lacZ with −35 and −36 substitutions | This study |
| pYJ-P3sTm-lacZ | pYJ-P3s-lacZ with −12, −13, −35, and −36 substitutions | This study |
| pCL-P3sGm-lacZ | pCL-P3s-lacZ with −9 substitution | This study |
| pCL-RSP | pCL55 carrying saeRS from Newman | This study |
| pCL-PQRSP | pCL55 carrying sae operon from Newman | 41 |
| pCL-RSL | pCL55 carrying saeRS from USA300 | This study |
| pCL-PQRSL | pCL55 carrying sae operon from USA300 | This study |
| pCL-R | pCL55 carrying saeR | This study |
| pCL-lacZ | pCL55 carrying promoterless lacZ | 42 |
| pYJ-Pcoa-lacZ | pCL-lacZ containing coagulase promoter | This study |
| pYJ-Phla-lacZ | pCL-lacZ containing alpha-hemolysin promoter | This study |
| pKOR1 | Allelic replacement plasmid | 3 |
| pKOR1-P1 m | pKOR1 carrying mutated P1 promoter fragment | This study |
| pAT18 | Shuttle vector for Gram-negative and Gram-positive organisms | 43 |
| pAT-P1-saeP | pAT18 carrying saeP under P1 promoter | This study |
| pAT-P1-saeQ | pAT18 carrying saeQ under P1 promoter | This study |
| pAT-P1-saePQ | pAT18 carrying saePQ under P1 promoter | This study |
| pKT25-saeR | pKT25 carrying saeR | This study |
| pUT18C-saeS | pUT18C carrying saeS | This study |
NARSA, Network on Antimicrobial Resistance in Staphylococcus aureus.
DNA manipulation and amplification.
Unless stated otherwise, all restriction enzymes and DNA modification enzymes were purchased from New England BioLabs. Plasmids and genomic DNA were extracted with a Zippy plasmid miniprep kit (Zymo Research) and a GenElute bacterial genomic DNA kit (Sigma-Aldrich), respectively, according to the manufacturers' instructions. Plasmid DNA was introduced into E. coli by the method of Hanahan and Meselson (17) and into S. aureus RN4220 by electroporation (20) with a gene pulser (Bio-Rad). Transduction into target strains of S. aureus was carried out with φ85 (32).
P3 promoter-lacZ fusion plasmid construction.
The P3L, P3s, and P3t fragments shown in Fig. 1B were PCR amplified with the following pairs of primers: P697/P698, P697/P1075, and P672/P1075 (Table 2 ). The PCR products were digested with EcoRI and KpnI and inserted into pYJ-lacZ (42), resulting in pYJ-P3L-lacZ, pYJ-P3s-lacZ, and pYJ-P3t-lacZ.
Table 2.
Oligonucleotides used in this study
| Oligonucleotide | Sequence (5′→ 3′)a | Usage |
|---|---|---|
| P672 | CAAGGTACCAACCTAATCCAATTGCAATCTCTC | P3 promoter |
| P697 | ATCGGTACCTTCACCTCTGTTCTTACGACCTC | P3 promoter |
| P698 | CTAGAATTCGTGAAACTGTTGAAGGTAAAGCTG | P3 promoter |
| P1075 | GATGAATTCGAGTGGTATAAGTGGTTTTTCG | P3 promoter |
| RNA oligo primer | GGTATTGCGGTACCCTTGTAC | 5′-RACE |
| RNA oligo | CUAGUACUCCGGUAUUGCGGUACCCUUGUACGCCUGUUUUAUA | 5′-RACE |
| P708 | GAAATTGCTTCTTTACCGCT | 5′-RACE |
| P3-10 m-F | GCTAAGATATAATTCGTCATAACAAAGG | P3 mutagenesis |
| P3-10 m-R | CCTTTGTTATGACGAATTATATCTTAGC | P3 mutagenesis |
| P3-35 m-F | CAAAGGCTTCCAAAGAGGCTAGCAGCA | P3 mutagenesis |
| P3-35 m-R | TGCTGCTAGCCTCTTTGGAAGCCTTTG | P3 mutagenesis |
| P3-TATAm-F | ATAATTCGTCATAACAAAGGCTTCCAAAGAGGC | P3 mutagenesis |
| P3-TATAm-R | GCCTCTTTGGAAGCCTTTGTTATGACGAATTAT | P3 mutagenesis |
| P639 | CCCGGTACCCTGAGCTGACTATACGTGTTTTC | Phla promoter |
| P640 | CCCGGTACCGAGTTTATAATATTATTCAACTCTGTC | Phla promoter |
| P1161 | GGAATTCGAATTGTAAATACTTTCTAATC | Pcoa promoter |
| P1162 | GGGGTACCGCGCCTAGCGAAATTATTTGC | Pcoa promoter |
| P904 | AATGGATCCCTCGATACGACGCCAATAATG | saeR downstream |
| P905 | GAGTGGTATAAGTGGTTTTTCG | saeR upstream |
| P796 | CTTAGCCCATGATTTAAAAACACC | saeS |
| P848 | TGTATTTAAAGTGATAATATGAGTC | saeS |
| P648 | TCCCTTGGACTAAATGGTTTTTTGAC | saeR |
| P688 | ACTTACTGATCGTGGATGATG | saeR |
| P934 | CCTTACCAAATCTTGACATCC | 16S rRNA |
| P935 | GTGTAGCCCAAATCATAAGG | 16S rRNA |
| P1574 | GGGCTGCAGGGACCCACTTACTGATCGTGGAT | saeR upstream |
| P1217 | TGAATTCGATTATGACGTAATGTCTAATTTGTG | saeS downstream |
| P1575 | CACTGCAGGATCATTATTGGCGTCGTATCGAGT | saeS upstream |
| P671 | AACGAATTCTTTGGTACTTGTATTTAATCGTCTATC | P1 promoter |
| P665 | CTAGGGGGGCTGTGAAATCATAC | saeP downstream |
| P669 | ATAGGATCCATTCATGCTAACTCCTCATTTCTTC | P1 promoter |
| P874 | ATAGGATCCACACACAATAAATAGAAAGAATGTG | saeQ upstream |
| P1021 | TTCGGATCCGGTTTGACAAATGTCTACAATGTC | saeQ downstream |
| P1376 | CATATTATTTGCCTTCATTTTAAACTTAAC | P1 mutagenesis |
| P1254 | GCCATTAACTAATTCTTGGCTTCGTTTA | P1 mutagenesis |
| P1377 | GGGGTACCGGGGACCACTTTGTACAAGAAAGCTGGGTGTTATGCAAAGTAATGATATGAATCAC | P1 mutagenesis |
| P1378 | GGGACAAGTTTGTACAAAAAAGCAGGCTGTGAACAGGAAGTGTTTGAGCTCA | P1 mutagenesis |
Restriction sites are underlined.
Determination of transcription start site (TSS) for P3 promoter.
Total RNA from USA300-P23 and the sae deletion mutant NMΔsae carrying pCL-RSL (Table 1) was extracted with a FastRNA Pro Blue kit (MP Bio) (41). The 5′ end of the transcripts from the P3 promoter was determined as described by Bensing et al. (7), with minor modifications. First, the mRNA species carrying a monophosphate group at the 5′ end was eliminated by treating the purified total RNA (6 μg) with 1 unit of Terminator 5′-phosphate-dependent exonuclease (Epicentre Technologies) at 37°C for 30 min. Then, the RNA was treated with 5 units of tobacco acid pyrophosphatase (TAP; Epicentre Technologies) at 37°C for 60 min, converting the triphosphate group to a monophosphate. A control RNA was incubated under the same conditions in the absence of TAP. Reactions were stopped by phenol-chloroform extraction, and RNA was precipitated with sodium acetate-ethanol treatment. Precipitated RNA was dissolved in water and ligated with 500 pmol of 5′ RNA oligo (Table 2) at 37°C for 1 h with 120 units of T4 RNA ligase (New England BioLabs). The RNA was extracted with phenol-chloroform and precipitated with ethanol. From the purified RNA, cDNA was generated with the primer P708 (Table 2) and Superscript III reverse transcriptase (Invitrogen). The cDNA was used for PCR amplification with the RNA oligo primer and the primer P708 (Table 2). PCR conditions were as follows: 94°C for 30 s, 60°C for 30 s, and 72°C for 40 s, 30 cycles. Products were separated on 3% Nusieve agarose gels, and bands of interest were excised, gel eluted (QIAex II; Qiagen), and sequenced.
Site-directed mutagenesis of P3s.
Two DNA fragments were generated from Newman genome DNA by PCR amplification with the forward primer pair (P3-10m-F, P3-35m-F, or P3-TATAm-F)/P1075 for the first fragment and the complement primer pair (P3-10m-R, P3-35m-R, or P3-TATAm-R)/P697 for the second fragment (Table 2). The first and second fragments were mixed and further subjected to PCR amplification with primers P697 and P1075. The final PCR products were digested with EcoRI and KpnI and inserted into pYJ-lacZ, resulting in pYJ-P3s10m-lacZ (10m, mutant with a mutation in the −10 region), pYJ-P3s35m-lacZ (35m, mutant with a mutation in the −35 region), and pYJ-P3sTm-lacZ (Tm, mutant with a mutation in both regions).
Random mutagenesis of P3s.
The P3s fragment (Fig. 1B) was PCR amplified with a GeneMorph II random mutagenesis kit (Stratagene) with primers P697/P1075 according to the manufacturer's recommendations. The mutated P3 promoter fragments were digested with EcoRI and KpnI and ligated with pCL-lacZ digested with the same enzymes (42). The ligation product was introduced into E. coli DH5α; then, the pool of the resulting plasmid, pCL-P3s-lacZ, was purified from the transformation plate and electroporated into S. aureus RN4220. The transformants were spread on a tryptic soy agar (TSA) plate containing chloramphenicol and 5-bromo-4-chloro-3-indolyl-β-d-galactopyranoside (X-gal). From colonies showing a darker blue color, the P3s region was PCR amplified and sequenced.
LacZ reporter plasmid for coa and hla.
The coagulase promoter (Pcoa) and the alpha-hemolysin promoter (Phla) were PCR amplified with the primer pairs P1161/P1162 and P639/P640, respectively (Table 2). After digestion with either EcoRI/KpnI (for Pcoa) or KpnI (for Phla), the PCR products were ligated with pYJ-lacZ digested with the same enzymes, resulting in pYJ-Pcoa-lacZ and pYJ-Phla-lacZ.
Construction of complementation plasmids.
pCL-PQRS contains the entire sae operon in the integration plasmid pCL55 (25), and its construction was described in our previous study, in which the plasmid is referred to as pCL55-sae (41). To generate the pCL-RS plasmid, pCL-PQRS was digested upstream of saeP with EcoRI and then treated with Klenow fragment. The resulting plasmid was further digested with AleI, located in saeQ, and self-ligated with T4 ligase. The ligation product was transformed into E. coli DH5α and subsequently into RN4220 and then into the sae deletion mutant NMΔsae (41). To generate the pCL-R plasmid, the saeR gene was amplified with primers P904/P905. The amplified fragments were digested with BamHI and then inserted between the BamHI and SmaI sites of pCL55, resulting in pCL-R. To generate complementation plasmids for saeP and saePQ, the corresponding genes were PCR amplified with primers P671/P665 and P671/P1021, respectively. The amplified fragments were digested with EcoRI/BamHI (saeP fragment) or EcoRI (saePQ fragment) and then inserted into pAT18 (43) between the EcoRI and BamHI sites or the EcoRI and SmaI sites, resulting in pAT-P1-saeP and pAT-P1-saePQ. To generate a saeQ complementation plasmid, where saeQ is transcribed by its natural promoter P1, the P1 promoter region and saeQ were amplified with primers P671/P669 and P874/P1021, respectively. Each product was digested with BamHI and ligated together. The P1-saeQ fusion product was PCR amplified again with the ligation product as a template and the primers P671 and P1021 (Table 2). The amplified P1-saeQ fusion product was digested with EcoRI and inserted between the EcoRI and SmaI sites in pAT18, resulting in pAT-P1-saeQ. The plasmids were transformed into DH5α and subsequently electroporated into strain RN4220. Finally, the plasmids were transduced with φ85 from RN4220 into the target strain NMΔsae(pCL-RSP).
Protein identification.
Target protein bands were excised from an SDS-polyacrylamide gel and sent to the Proteomics Core Facility of Indiana University, Indianapolis, IN, where the samples were digested with trypsin and analyzed with an LTQ Orbitrap (Thermo-Fisher) and a nano-ultraperformance liquid chromatography (UPLC) system (Waters).
Catalase assay.
The test strains NMΔsae(pCL-RSP) and NMΔsae(pCL-PQRSP) were grown in TSB for 8 h to reach to stationary growth phase; then, culture supernatant was collected and normalized by optical density at 600 nm (OD600). A catalase assay was carried out with a catalase assay kit (ab83464; Abcam) according to the manufacturer's recommendations. The assay was repeated twice, with similar results.
Bacterial two-hybrid protein interaction assay.
The saeR and saeS genes were PCR amplified with primer pairs P904/P1574 and P1217/P1575 (Table 2). The amplified saeR gene was digested with PstI and BamHI and then inserted into the same sites of pKT25 to generate pKT25-saeR. The amplified saeS gene was digested with PstI and EcoRI and ligated with pUT18C digested with the same enzymes, generating pUT18C-saeS. The resulting plasmids were cotransformed into the host strain E. coli DHM1; then, binding of SaeR and SaeS was measured by the β-galactosidase activity of the strain.
β-Galactosidase assay.
The β-galactosidase assay was carried out as described previously (41), with minor modifications. After a 1:100 dilution of overnight culture into fresh TSB, cells were grown at 37°C for 2 h (exponential growth phase) or 6 h (stationary growth phase) with shaking (250 rpm). The LacZ activity was normalized by OD600. The assay was repeated at least twice, with similar results.
Cell fractionation and Western blot hybridization.
Western blot analysis of proteins was carried out as described previously (41). The alpha-hemolysin antibody was purchased from Sigma. The antibodies for SaeR and SaeS were generated in our laboratory. All other antibodies were generated by Genscript.
Protein stability measurement.
The test strains were grown in TSB with shaking at 37°C to exponential growth phase (OD600 of 0.5); then, protein synthesis was stopped with erythromycin (10 μg/ml). Cells were collected by centrifugation at time points 0, 5, 10, 20, and 30 min and normalized to OD600 of 0.6. SaeS and SaeR were detected by Western blot analysis, and the half-life (t1/2) of the protein was determined by densitometry.
Real-time quantitative reverse transcription-PCR (qRT-PCR).
Total RNA was purified as described above. From 100 ng of the purified RNA, cDNAs were produced with Superscript III reverse transcriptase (Invitrogen) and a random primer. The resulting cDNA was used for PCR amplifications with the following primers: P648/P688 for saeR, P848/P796 for saeS, and P934/P935 for 16S rRNA (Table 2). SYBR advantage qPCR premix (Clontech) and a 7900 HT Fast real-time PCR system (Applied Biosystems) were used for the amplification. The experiments were performed in triplicate, with 16S rRNA used as an internal control. We analyzed the results using the comparative threshold cycle CT (i.e., 2−ΔΔCT) method (39). To calculate the half-life of transcripts, cells were grown in TSB to exponential growth phase (OD600 of 0.5); then, rifampin (3 μg/ml) was added to block transcription. Cells were collected at 0, 1, 2, 4, and 8 min posttreatment and further processed as described above.
Construction of chromosomal mutation of P1.
Two DNA fragments (1 kb each) were amplified with the primer pairs P1254/P1377 and P1376/1378, respectively. The 5′ end of P1376 was modified with a phosphate group. The two PCR products were ligated and then inserted into pKOR1 using the BP clonase (Invitrogen) (3). The resulting plasmid, pKOR1-P1m, was introduced into Newman and USA300-P23. The mutagenesis was carried out as described previously (3).
RESULTS
Identification of TSS of P3 promoter in the sae operon.
Although the P1 promoter sequence has been identified and verified (12, 40, 42), the exact sequence of the P3 promoter has not been determined. The sae regions showing P3 promoter activity and the transcription start site (TSS) of the P3 promoter have been reported previously (12, 40). To further narrow down the minimal sequence for P3, we constructed three lacZ reporter fusions using the following DNA fragments: P3L, P3s, and P3t (Fig. 1B). In the previous study, the P3L fragment exhibited full P3 promoter activity (12). When an 865-bp upstream sequence was deleted from the P3L fragment, the resulting P3s fragment still showed similar promoter activity (Fig. 1B), suggesting that the minimal promoter sequence is in this P3s fragment. However, when the P3s fragment was further deleted at the previously determined TSS, the resulting P3t fragment lost promoter activity (Fig. 1B), implying that the region deleted from P3s contains DNA sequence critical for the promoter activity.
Since the previous TSS was determined by primer extension, which cannot distinguish nascent transcripts from processed ones, it is possible that the reported TSS is an RNA processing site. Therefore, we redetermined the TSS of P3 by tobacco acid pyrophosphatase (TAP)-mediated rapid amplification of 5′ cDNA ends (5′-RACE) (7). The method is based on the fact that nascent RNA transcripts carry a triphosphate group at the 5′ end and cannot be ligated to an RNA primer unless the triphosphate group is converted to a monophosphate by a pyrophosphatase, such as TAP. In our TSS determination, first we purified total RNA from USA300-P23 and NMΔsae(pCL-RSL) and eliminated processed transcripts, which carry a monophosphate group at their 5′ end, with exonuclease treatment. Then, the resulting RNA was further treated with TAP and ligated to an RNA primer. cDNA was generated with a primer recognizing saeR (P708) (Table 2), followed by a PCR amplification with the primer and a primer complementary to the RNA primer. As shown in Fig. 2A, a 0.3-kb DNA band was produced only from the TAP-treated RNA samples. The DNA sequencing analysis of the PCR product showed that the TSS of the P3 promoter is located 78 nucleotides (nt) downstream of the previously reported TSS (Fig. 1A), explaining the absence of promoter activity in the P3t fragment. The result also suggests that the previously reported TSS is probably a processing site of mRNA transcribed from P1. Subsequently, −35 and −10 regions for P3 were identified (Fig. 1A). The identified promoter sequence shows 60% homology with the prokaryotic −35 and −10 consensus hexamers (36). Previously, in Bacillus, the presence of a strongly conserved “TGN” sequence motif preceding the −10 region was reported (33). This motif is strongly conserved in Gram-positive bacteria (4). Indeed, a TGN sequence was also found in front of the −10 region of the P3 promoter (Fig. 1A).
Fig. 2.

Confirmation of the P3 promoter sequence. (A) Identification of transcription start site of P3 by TAP-mediated 5′-RACE. M, 100-bp DNA ladder; USA, USA300-P23; Δ(pCL-RSL), sae deletion mutant NMΔsae carrying pCL-RSL; Exo, exonuclease; TAP, tobacco acid pyrophosphatase; +, presence; −, absence. (B) DNA sequences of P3 promoter mutants. The consensus sequence for −10 and −35 regions in E. coli is shown in boldface. The mutated nucleotides are boldface and underlined. WT, wild-type P3 promoter; 10m, mutant with a mutation in the −10 region; 35m, mutant with a mutation in the −35 region; Tm, mutant with a mutation in both the −10 and the −35 region; Gm, gain-of-function mutant isolated by random mutagenesis. (C) P3 promoter loss-of-function mutants. The P3s fragment was mutated by PCR-mediated site-directed mutagenesis. The wild-type and mutated P3s fragments (10m, 35m, and Tm) were inserted into pYJ-lacZ; then, the relative LacZ activity of the P3s-lacZ fusions in strain RN4220 was measured. The LacZ assays were repeated three times, with similar results. Error bars represent standard deviations. (D) P3 promoter gain-of-function mutant. Randomly mutated P3s fragments were inserted into pCL-lacZ. A pCL-P3s-lacZ mutant conferring dark-blue color to strain RN4220 on an X-gal plate was isolated and sequenced. Activity of the mutant promoter (Gm) was compared with that of the wild-type promoter (WT) by LacZ assays. The assays were repeated three times, with similar results. Error bars represent standard deviations.
Confirmation of the P3 promoter sequence.
If the identified sequences constitute the P3 promoter, mutational changes of the sequences should affect the promoter activity. To confirm the promoter sequence, first we made knockout mutations by changing the first two conserved nucleotides of the −10 region (TA → CG) and the −35 region (TT → CC) in P3s (Fig. 2B); then, the effect of the mutations was measured by lacZ reporter assays. As can be seen in Fig. 2C, the mutation in the −35 region (35m mutant) greatly reduced the promoter activity. More importantly, the −10 region mutation (10m mutant) or the combination of both mutations (Tm mutant) abolished the P3 promoter function (Fig. 2C), demonstrating that the identified sequences constitute the P3 promoter. To further confirm the promoter sequence, we also took a gain-of-function approach. We amplified P3s fragments with an error-prone DNA polymerase and constructed P3s-lacZ plasmids. Subsequently, we identified a mutant showing darker blue color on tryptic soy agar (TSA) containing X-gal. DNA sequencing analysis of the mutated P3s fragment revealed that the mutant has a T→A transversion in the −10 region (TAAATT→TAAAAT), increasing the homology with the prokaryotic −10 consensus hexamer (Gm in Fig. 2B). In a lacZ reporter analysis, the mutant promoter showed activity approximately 15 times higher than that of the original P3s fragment (Fig. 2D), indicating that the increased homology to the consensus sequence made the promoter stronger. Based on these results, we concluded that the newly identified sequences constitute the genuine P3 promoter of the sae operon.
P1 promoter is not required for expression of coagulase or alpha-hemolysin.
Since we identified the genuine P3 promoter, next we examined the role of the P1 and P3 promoters in sae signaling. pCL-PQRS, a plasmid carrying the entire sae operon (Fig. 3A), was previously shown to complement the sae deletion mutation (41). Due to the polymorphism of saeS, we made two pCL-PQRS plasmids: pCL-PQRSP and pCL-PQRSL. pCL-PQRSP produces SaeSP, the hyperactive mutant SaeS found in strain Newman. On the other hand, pCL-PQRSL produces SaeSL, the wild-type SaeS found in most other strains. Then, we deleted saePQ regions including P1 at the AleI site in saeQ, generating pCL-RSP and pCL-RSL, respectively (Fig. 3A). Since the P3 promoter sequence is located downstream of the enzyme site, both saeR and saeS are expected to be transcribed from the promoter. The plasmids were integrated into the geh gene of the sae deletion mutant NMΔsae. Then, we compared the sae signaling functionalities of the strains by measuring the promoter activities of coa, a class I target, and hla, a class II target, with promoter-lacZ fusion constructs. Both promoters showed a growth-phase-dependent promoter activity: the promoter activity of coa was higher at exponential growth phase, while that of hla was higher at stationary growth phase (Fig. 3B). In addition, the coa promoter activity was elevated in strains carrying saeSP, while the hla promoter activity was not significantly affected by the saeS alleles, confirming the previous report that the saeSP allele affects only the expression of class I target genes (30). More importantly, however, no significant difference was observed between the complementation capabilities of plasmids pCL-PQRS and pCL-RS (PQRSP versus RSP or PQRSL versus RSL in Fig. 3B), suggesting that the saePQ region including P1 is not required for the expression of both target genes.
Fig. 3.

P1 promoter is not required for expression of coagulase or alpha-hemolysin. (A) Map of the complementation plasmids pCL-RS and pCL-PQRS. The DNAs shown as solid lines were inserted into pCL55, an integration plasmid for S. aureus. A, AleI. (B) Effect of the complementation plasmids on the transcription activity of coa and hla promoters. The promoterless reporter plasmid pYJ-lacZ was used to generate the promoter-lacZ fusions. LacZ activity was measured at both exponential and stationary growth phases. NM, wild-type strain; Δ, sae deletion mutant NMΔsae; RSP, NMΔsae(pCL-RSP); PQRSP, NMΔsae(pCL-PQRSP); RSL, NMΔsae(pCL-RSL); PQRSL, NMΔsae(pCL-PQRSL). Error bars represent standard deviations. (C) Effect of the complementation plasmids on the expression of coagulase (Coa) and alpha-hemolysin (Hla). Exoproteins were precipitated from culture supernatants with trichloroacetic acid, and the expression of Coa and Hla was analyzed by Western blot analysis. Sortase A (SrtA) in the cell pellet was used as a loading control. (D) Effect of the complementation plasmids on exoprotein production. Exoproteins were precipitated from culture supernatants with trichloroacetic acid; then, the precipitated proteins were analyzed by SDS-PAGE, followed by Coomassie staining. The triangles indicate proteins missing in NMΔsae(pCL-RSP).
To verify the LacZ assay results at a protein level, Coa and Hla were analyzed by Western blot analysis. Again, no significant difference was observed between the strains complemented either by pCL-PQRS or by pCL-RS (Fig. 3C). As reported previously (30), Coa was not expressed in the strains carrying the saeSL allele, while the expression of Hla was independent from the saeS allele. To further compare sae signaling at a global level, we analyzed exoprotein profiles of the complemented strains by SDS-PAGE and Coomassie blue staining analysis. Although no significant difference between strains carrying pCL-PQRS or pCL-RS was observed at exponential growth phase, at the stationary growth phase, pCL-RSP did not fully complement the expression of at least two proteins (triangles in Fig. 3D). Mass spectrometry analysis revealed that the higher-molecular-weight protein is autolysin and the lower-molecular-weight protein is either coagulase or catalase. Since the Western blot analysis results in Fig. 3C showed that coagulase was produced at a similar level in the test strains, it is more likely that the lower-molecular-weight protein is catalase. To confirm the conjecture, we measured the catalase activity in the supernatants of the test strains. Indeed, the catalase activity in the culture supernatant of NMΔsae(pCL-PQRSP) was 2.9 times higher than that in the culture supernatant of NMΔsae(pCL-RSP) (8.3 mU ml−1 versus 2.9 mU ml−1, respectively), indicating that the lower-molecular-weight protein band is most likely catalase. Since the genes encoding autolysin or catalase do not contain SaeR binding sites, the apparent regulation of the genes by pCL-PQRSP must be indirect. These results imply that, although the region encompassing P1 and saePQ is not required for the expression of coa and hla, it is required for full function of sae signaling in the saeSP background.
SaeSP is unstable.
To investigate the reason why pCL-RSP failed to fully restore the exoprotein production, we measured the signal transducing proteins SaeS and SaeR in the test strains by Western blot analysis. Surprisingly, the level of SaeS was greatly reduced in the strain carrying the pCL-RSP plasmid (Fig. 4A). Although the reduction was observed in both growth phases, it was more prominent in exponential growth phase. Noticeably, although not as prominent as in the strain carrying pCL-RSP, the SaeS level also appeared to be slightly lower in the strain carrying pCL-RSL. These results suggest that the saePQ region can affect the level of SaeS, especially in the saeSP allele background, and that the incomplete complementation by pCL-RSP shown in Fig. 3D is probably due to the decreased level of the SaeS protein in the strain.
Fig. 4.

SaeSP is unstable. (A) Expression of SaeS and SaeR proteins from the complementation plasmids. Cells were collected at both exponential and stationary growth phases. SaeS and SaeR in the cells were analyzed by Western blot analysis. The sortase A protein (SrtA) was used as a loading control. NM, wild-type strain; Δ, sae deletion mutant NMΔsae; RSP, NMΔsae(pCL-RSP); PQRSP, NMΔsae(pCL-PQRSP); RSL, NMΔsae(pCL-RSL); PQRSL, NMΔsae(pCL-PQRSL). (B) Comparison of saeS transcript levels produced by the complementation plasmids. Total RNA was extracted from the indicated cells; then, the levels of saeS transcripts were compared by real-time qRT-PCR. As a control, 16S rRNA was used. Error bars represent standard deviations. (C) Comparison of the half-lives of SaeSP and SaeSL. Protein synthesis in strains NMΔsae(pCL-PQRSP), NMΔsae(pCL-PQRSL), and NMΔsae(pCL-RSL) was blocked with erythromycin; then, the expression level of SaeS was measured by Western blot analysis at the time points indicated. Half-life was calculated by densitometry analysis.
To examine whether lower transcription is responsible for the decreased level of SaeS in the strain carrying pCL-RSP, we compared the levels of saeS transcript among the complemented strains by real-time qRT-PCR. As shown in Fig. 4B, no significant difference was observed between the strains carrying pCL-RSP or pCL-PQRSP, demonstrating that the reduction of SaeSP in the strain carrying pCL-RSP is due to a posttranscriptional event. Interestingly, however, a strong allele-specific difference was observed: the level of saeS transcripts was 20 to 30 times higher in the saeSP allele background.
Since there was no significant difference at the transcript level, we suspected that the reduced level of SaeSP was caused by instability of the protein, especially in the absence of saePQ. However, despite our repeated trials, we failed to measure the half-life of SaeSP in NMΔsae(pCL-RSP) because the initial level of SaeSP was too low to be measured reproducibly. Therefore, as an alternative method, we compared the stability of SaeS in NMΔsae(pCL-PQRSP) with that in NMΔsae(pCL-PQRSL). After protein synthesis was blocked by erythromycin, cells were collected at the time points indicated in Fig. 4C, and SaeS was detected by Western blot analysis; then, the half-life of the protein was calculated by densitometry analysis. As can be seen in Fig. 4C, the half-life of SaeSP (16.5 min) was approximately half that of SaeSL (35.5 min), showing that SaeSP is less stable even in the presence of saePQ. In the strain carrying pCL-RSP, the instability was probably accelerated due to the absence of saePQ.
In Fig. 4A, the level of SaeSL appears to be slightly lower in NMΔsae(pCL-RSL) than in NMΔsae(pCL-PQRSL), especially in stationary growth phase, indicating that saePQ might enhance the SaeS stability in the saeSL allele background as well. To test this idea, we measured the half-life of SaeSL in NMΔsae(pCL-RSL) and compared it with that in NMΔsae(pCL-PQRSL). In fact, in the absence of saePQ, the half-life of SaeSL was decreased by 37% (from 35.5 min to 22.7 min) (PQRSL versus RSL in Fig. 4C).
saeSP transcripts are more stable than saeSL transcripts.
The real-time qRT-PCR analysis results in Fig. 4B showed that the levels of saeS transcripts in NMΔsae carrying the saeSP allele were significantly higher than those in the strain carrying the saeSL allele (RSP and PQRSP versus RSL and PQRSL). To examine whether saeS alleles affect transcription from P3, we measured P3 promoter activity in the test strains by lacZ fusion assays. As shown in Fig. 5A, no significant difference was observed among the strains complemented with plasmids, showing that saeS alleles do not affect the P3 promoter activity. The only significant difference observed was the 30% higher P3 activity in the sae deletion mutant (NM versus Δ in Fig. 5A), confirming the autorepression phenomenon of P3 reported by Geiger et al. (12).
Fig. 5.

saeSP transcripts are more stable than saeSL transcripts. (A) Comparison of P3 promoter activities by lacZ reporter assays. NM, wild-type strain; Δ, sae deletion mutant NMΔsae; RSP, NMΔsae(pCL-RSP); PQRSP, NMΔsae(pCL-PQRSP); RSL, NMΔsae(pCL-RSL); PQRSL, NMΔsae(pCL-PQRSL). (B) Determination of saeS tran- script stability by real-time qRT-PCR. NMΔsae(pCL-RSP) and NMΔsae(pCL-RSL) were grown to exponential growth phase; then, transcription was blocked by rifampin. Cells were collected at the time points indicated, and total RNA was purified. The level of saeS transcripts was measured by real-time qRT-PCR. 16S rRNA was used as a control. Error bars represent standard deviations.
An alternative explanation for the elevated level of saeSP transcripts is that the T53C missense mutation in the allele stabilizes the transcript. To test this hypothesis, after blocking transcription initiation with rifampin, we measured the level of saeS transcripts by real-time qRT-PCR for 8 min. Extrapolation of the results shown in Fig. 5B revealed that the half-life of saeSP transcripts is 18 min while that of saeSL transcripts is 9 min. These results indicate that the T53C missense mutation in saeSP renders its transcripts more stable, and this enhanced stability, at least in part, explains the increased transcript level of saeSP.
SaeQ stabilizes SaeSP.
The level of SaeS was much higher in NMΔsae(pCL-PQRSP) than in NMΔsae(pCL-RSP) (PQRSP versus RSP in Fig. 4A), suggesting that the stability of SaeSP was increased by the presence of saePQ. To determine which genetic determinant is responsible for the increased stability, saeP, saeQ, or saePQ was cloned under the control of the P1 promoter, and the resulting plasmids were inserted into NMΔsae(pCL-RSP). As can be seen in Fig. 6, a significant level of SaeSP was detected only when saeQ was present, implying that SaeQ stabilizes SaeSP.
Fig. 6.
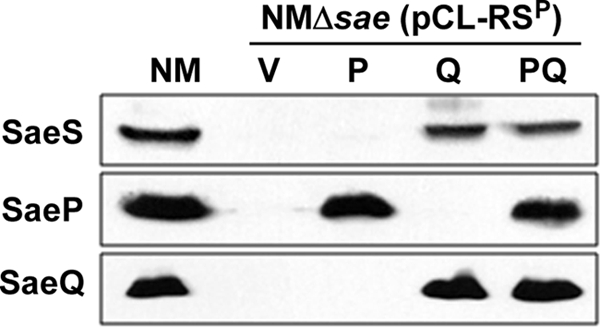
SaeQ stabilizes SaeSP. The complementation plasmids pAT-P1-saeP, pAT-P1-saeQ, and pAT-P1-saePQ were inserted into NMΔsae(pCL-RSP). Cells were grown to exponential growth phase; then, the effect of the plasmids on the stability of SaeSP was analyzed by Western blot analysis. NM, wild-type strain; V, pAT18; P, pAT-P1-saeP; Q, pAT-P1-saeQ; PQ, pAT-P1-saePQ.
SaeS stabilizes SaeR.
The Western blot analysis in Fig. 4A also shows that in the absence of saePQ the level of SaeR was also decreased. As with saeS transcripts, real-time qRT-PCR analysis showed no drastic difference between the plasmids pCL-RS and pCL-PQRS (Fig. 7A), suggesting that the reduction of SaeR is probably a posttranscriptional event.
Fig. 7.
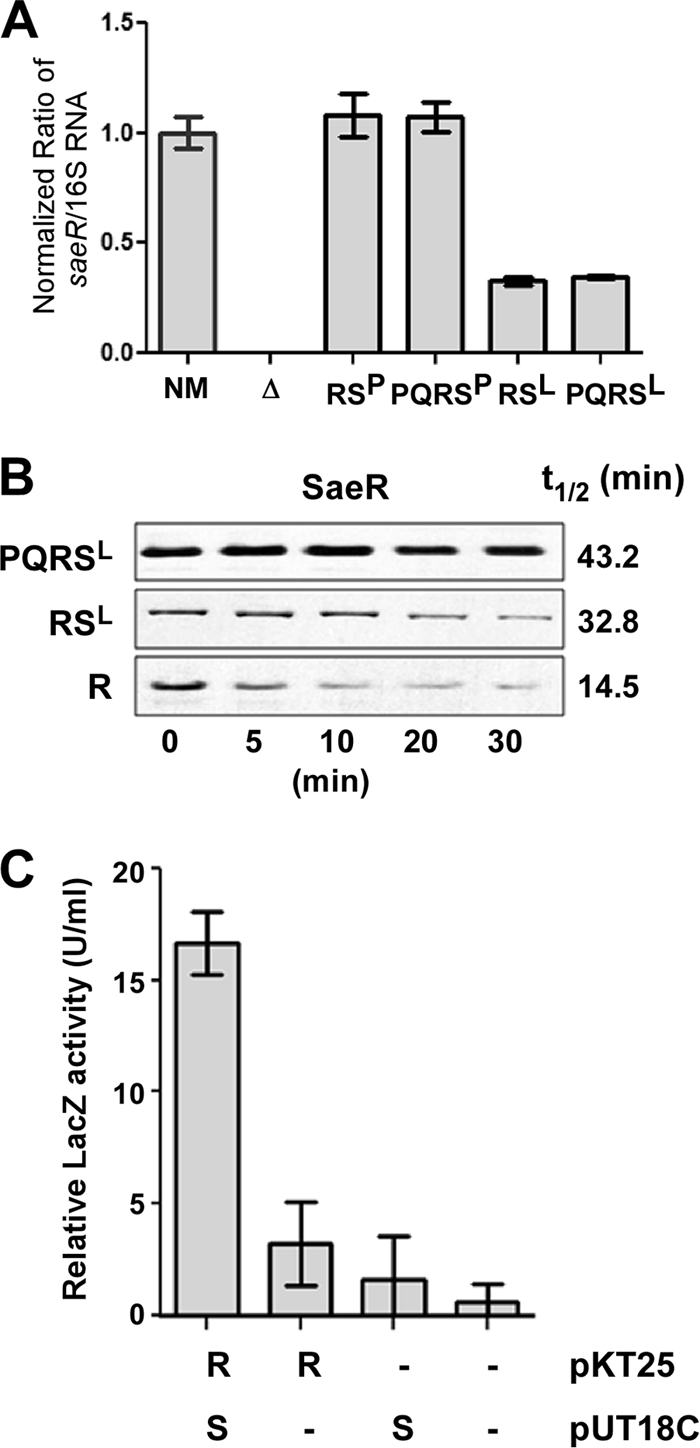
SaeS stabilizes SaeR. (A) Comparison of the levels of saeR transcripts by real-time qRT-PCR. NM, wild-type strain; Δ, sae deletion mutant NMΔsae; RSP, NMΔsae(pCL-RSP); PQRSP, NMΔsae(pCL-PQRSP); RSL, NMΔsae(pCL-RSL); PQRSL, NMΔsae(pCL-PQRSL). (B) Determination of SaeR half-life. Protein synthesis was blocked with erythromycin in the strains NMΔsae(pCL-PQRSL), NMΔsae(pCL-RSL), and NMΔsae(pCL-R); then, the level of SaeR was measured by Western blot analysis at the time points indicated. Half-life was calculated by densitometry analysis. (C) Bacterial two-hybrid assays for SaeR-SaeS interaction. The saeR and saeS genes were fused to the T25 or T18 fragment of Bordetella pertussis adenylate cyclase. Then, the activity of β-galactosidase was measured as an indicator for a protein-protein interaction. pKT25, vector for T25 fusion; pUT18C, vector for T18 fusion. Error bars represent standard deviations.
SaeR and SaeS are in the same signal transduction pathway; therefore, we suspected that the SaeR-SaeS interactions might protect SaeR from degradation by proteases. To test this hypothesis, we decided to measure the half-life of SaeR. For the measurement, we did not use saeSP allele strains because the steady-state level of SaeSP in the strain carrying pCL-RSP could not be measured. Therefore, instead, we used the following three strains: NMΔsae(pCL-PQRSL), NMΔsae(pCL-RSL), and NMΔsae(pCL-R). If SaeS can stabilize SaeR by a protein-protein interaction, SaeR will have the longest half-life in NMΔsae(pCL-PQRSL), because the half-life of SaeS is longest in this strain (t1/2 of 35.5 min). On the other hand, the half-life of SaeR is expected to be the shortest in NMΔsae(pCL-R) because the strain does not produce SaeS. As can be seen in Fig. 7B, indeed, the half-life of SaeR was longest in NMΔsae(pCL-PQRSL), at 43.2 min, while it was shortest in NMΔsae(pCL-R), at 14.5 min. It should be noted that, since the plasmids are integrated into the chromosome, disparity in plasmid stability cannot be responsible for the distinct protein stability. The half-life of SaeR in NMΔsae(pCL-RSL), where the half-life of SaeS is 22.7 min, was between the half-lives of the other two strains (32.8 min).
The apparent stabilizing effect of SaeS on SaeR suggests direct interactions between the two proteins even without exogenous stimuli. To examine the possibility, we employed the bacterial adenylate cyclase-based two-hybrid (BACTH) system. This two-hybrid system utilizes two complementary fragments (T25 and T18) of the catalytic domain of Bordetella pertussis adenylate cyclase (19). In this system, the interaction of the two test proteins results in restoration of the enzyme activity of adenylate cyclase, which, in turn, leads to expression of β-galactosidase by relaxing carbon catabolite repression. As can be seen in Fig. 7C, only when both SaeR and SaeS are coexpressed does the host E. coli strain show a significant β-galactosidase activity, confirming that SaeS can directly bind to SaeR even without exogenous stimuli.
Disruption of P1 promoter in the chromosome does not affect the production of Coa and Hla.
The results from Fig. 3 showed that the P1 promoter is not required for the production of Coa and Hla. However, since the experiments were carried out with a sae deletion mutant complemented with plasmid constructs (i.e., pCL-PQRS and pCL-RS), it is important to verify that the same results can be reproduced with chromosomal mutants. In addition, because Coa was not expressed in the strains carrying the saeSL allele, the independence of Coa expression from P1 had not yet been proven. Therefore, we made two transition mutations in the primary SaeR binding site of P1 in the chromosome of Newman, a saeSP allele strain, and USA300-P23, a saeSL allele strain (Fig. 8A). Each nucleotide was previously shown to be essential for the promoter activity of P1 (42). The mutations were verified by DNA sequencing analysis. In addition, the absence of P1 promoter activity in the mutant strains was confirmed by measuring the level of saeP transcripts by real-time qRT-PCR: no saeP transcripts were detected in the mutant strains (data not shown). As shown in Fig. 8B, Hla was expressed at the wild-type level in both mutant strains (i.e., NM-P1m and USA-P1m). On the other hand, Coa was expressed at the wild-type level only in NM-P1m: as expected, Coa was not expressed in the strains with the wild-type saeSL allele [i.e., USA, NMΔsae(pCL-RSL), and USA-P1m]. Notably, the level of SaeS was almost undetectable in NM-P1m, recapitulating the instability of SaeSP in the absence of SaeQ. To further investigate the role of the P1 promoter in Coa expression in the saeSL background, we activated the saeSL strains with human neutrophil peptide 1 (HNP-1), a known sae signaling activator (12). As can be seen in Fig. 8C, when induced by HNP-1, all strains carrying saeSL produced Coa at the wild-type level, demonstrating that the P1 promoter is dispensable for Coa expression, not only in the saeSP background but also in the saeSL background.
Fig. 8.
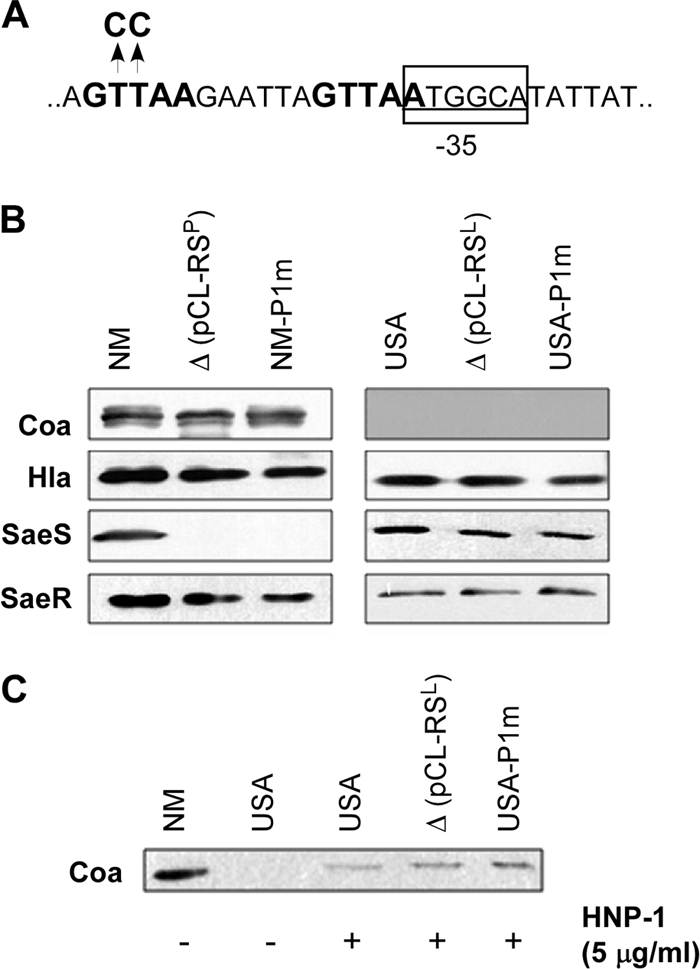
Disruption of the P1 promoter in the chromosome does not affect the production of Coa and Hla. (A) Nature of the P1 mutation in the chromosome. Two nucleotides in the SaeR binding site, which were previously shown to be essential for P1 function, were mutated with pKOR1. The SaeR binding sequences are boldface, while promoter sequences are underlined and indicated with a rectangle. (B) Effect of the P1 mutation on expression of Coa and Hla. Cells were grown to exponential growth phase; then, the proteins Coa, Hla, SaeS, and SaeR were detected by Western blot analysis. NM, wild-type strain; Δ(pCL-RSP), NMΔsae(pCL-RSP); NM-P1m, strain Newman with the chromosomal P1 mutation; USA, USA300-P23; Δ(pCL-RSL), NMΔsae(pCL-RSL); USA-P1m, USA300-P23 with the chromosomal P1 mutation. (C) Effect of the P1 mutation on Coa expression upon induction by human neutrophil peptide 1 (HNP-1). Cells were grown to exponential growth phase and then induced with HNP-1 for 2 h. Coa in culture supernatant was analyzed by Western blot analysis.
DISCUSSION
It is well established that the sae operon has two promoters. However, the roles of the promoters in sae signaling have not been rigorously tested. In particular, the stronger promoter, P1, has been implicated in regulation of the SaeRS TCS. However, in the present study, we demonstrated that P1 is not involved in the target gene expression and that the saeRS transcription from the P3 promoter is sufficient for expression of both class I and class II target genes. In addition, we provided indirect evidence for SaeQ-SaeS interactions, which, in future, could shed light on the role of the two proteins SaeP and SaeQ in sae signaling.
Primer extension is a technique commonly used to identify transcription start sites. However, without further experimental validation, primer extension results can be misleading because the technique cannot differentiate nascent mRNA from processed. Indeed, the previously reported TSS of the P3 promoter seems to be an RNA processing site, not the real TSS (40). If it were a real TSS, the P3t fragment, which contains 86 nt upstream of the site, would be expected to maintain promoter activity (Fig. 1). In addition, the results from the P3 mutagenesis experiments in Fig. 2 clearly demonstrate that the P3 sequence identified in the present study is responsible for the promoter activity. Interestingly, in the previous report, a DNA fragment containing the P3s fragment (Fig. 1) did not show significant promoter activity (12), although Li and Cheung also demonstrated that a DNA fragment encompassing the P3s fragment had promoter activity (26). Since there is no sequence difference in P3 promoter regions between strain Newman and the strain used in the previous study, the conflicting results cannot be attributed to sequence polymorphism, and it remains to be determined why the contradictory results were obtained.
The L18P substitution confers SaeSP unique characteristics, such as constitutive kinase activity and altered ligand specificity (1, 30, 38). In this study, we showed that the mutation also drastically decreased the stability of SaeSP. In a Western blot analysis, almost no SaeS was detected in NMΔsae(pCL-RSP) (Fig. 4). Interestingly, however, the expression of Coa and Hla was not significantly affected in the strain (Fig. 3C), suggesting that the high kinase activity of SaeSP overcame the low steady-state level of the protein. Since dramatic instability was seen only with SaeSP, the L18P mutation seems to render SaeSP structurally more vulnerable to cleavage by a hitherto unknown protease. The stabilization effect of SaeQ on SaeSP shown in Fig. 6 implies that the SaeQ forms a complex with SaeSP and protects SaeSP from cleavage by the unknown protease. Likewise, the SaeS interaction with SaeR seems to protect SaeR from degradation by proteases (Fig. 7). Recently, Luong et al. showed that clpC could activate the sae system in strain Newman (29). In this strain, the clpC mutation abolished P1 transcription and downregulated 18 other sae target genes, demonstrating that the clpC mutation indeed negatively affected the activity of the sae signaling system (29). Interestingly, the sae activation by clpC was not observed in strain UAMS-1, an S. aureus strain with the saeSL allele, suggesting that the sae activation by clpC is dependent on the saeSP allele (29). Since, as the authors also noted, ClpC is not a DNA-binding protein, ClpC might activate sae signaling in strain Newman by interfering with the proteolytic activity of the unknown protease. This possibility is currently being investigated in our laboratory.
One of the unexpected findings in the study is the saeS allele effect on the steady-state level of the saeRS transcript (Fig. 4B and 7A). Real-time qRT-PCR results show that the transcript level was approximately 3 (saeR) or 20 to 30 (saeS) times higher in the saeSP allele background. Since the deletion of the P1 promoter did not significantly affect the transcript level and P3 promoter activities were similar in both allele backgrounds (Fig. 5A), we suspect that the T53C missense mutation in the saeSP allele altered the mRNA conformation such that the mutant mRNA became more resistant to degradation by nucleases. Indeed, the half-life of the mutant mRNA was twice as long as that of the wild-type mRNA (18 min versus 9 min, respectively) (Fig. 5B). In addition, although saeR and saeS are cotranscribed, the allele-specific effect was more pronounced in saeS transcripts (compare Fig. 4B and Fig. 7A), suggesting that the T53C mutation protects mainly the saeS part of the saeRS transcripts from nuclease attacks. Intriguingly, despite the fact that the level of saeS transcript was 20 to 30 times higher in the saeSP allele background (Fig. 4B), the level of SaeS protein was not significantly increased (Fig. 4A). Parts of this discrepancy can be explained by the instability of SaeSP. In addition, since SaeS is translationally coupled with SaeR, it is possible that the translation coupling in the T53C mutant transcripts is less efficient, and the lower translational coupling might contribute to the discrepancy. Certainly, more works are required to address the translational coupling hypothesis.
Multiple lines of evidence support the idea that the P1 promoter is not involved in the expression of sae target genes. First, disruption of the P1 promoter does not significantly affect the expression of Coa (a class I target) and Hla (a class II target) (Fig. 3 and Fig. 8). The incomplete complementation of the sae deletion mutation by pCL-RSP (Fig. 3D) can be explained by the reduced stability of SaeSP, especially in the absence of SaeQ (Fig. 4 and Fig. 6). Second, Mainiero et al. showed that overexpression of saeRS by an inducible promoter does not alter expression of sae target genes, such as coa, hla, and eap (30), suggesting that elevation of saeRS transcription by P1, if there were any, would not alter the overall sae signaling. Finally, since saeP and saeQ, the two genes transcribed only by the P1 promoter, are dispensable in target gene expression (1, 30), the transcription of the genes by P1 would not have any effect on expression of target genes. Therefore, in S. aureus, the target gene expression of the SaeRS TCS is more likely regulated by the kinase/phosphatase activity of SaeS and not by the overall transcription of saeRS.
If the P1 promoter is not involved in target gene expression, then what can be the role of the P1 promoter? We think that the primary role of the P1 promoter in sae signaling is to provide SaeP and SaeQ proteins when the sae system is activated. As a lipoprotein and a membrane protein, respectively, both SaeP and SaeQ are expected to reside in the membrane. The stabilization effect of SaeQ on SaeSP also suggests that SaeQ directly interacts with SaeS (Fig. 6). Since neither saeP nor saeQ is required for expression of target genes (Fig. 3 and Fig. 8), they might be involved in postactivation events. One of the possibilities is that SaeP and SaeQ assist the activated sae system to return to the prestimulus state either by decreasing SaeS kinase activity or by increasing SaeS phosphatase activity. In many TCSs, HK possesses not only a kinase activity but also a phosphatase activity. The phosphatase activity is critical to return the activated TCS to the prestimulus state or to balance the signaling activity (37). However, in our previous study, we did not observe significant phosphatase activity in the cytoplasmic domain of SaeS, which is expected to have the enzyme activity (42). When mixed with P-SaeR, the cytoplasmic domain of SaeS did not significantly dephosphorylate P-SaeR up to 4 h. Even when the reaction was extended to 20 h, complete dephosphorylation was not observed (42). This is in stark contrast to the VraSR system, the TCS sensing the cell wall stresses in S. aureus (23, 24), where VraS completely dephosphorylated P-VraR within 5 min (6). Therefore, it is possible that the role of SaeP and SaeQ is to inhibit phosphorylation of SaeR or to activate dephosphorylation of P-SaeR so that the activated SaeRS TCS can return to the prestimulus state.
The existence of two different groups of sae target genes (i.e., class I and class II) suggests that the target genes' binding affinity to P-SaeR is heterogeneous. In fact, the numbers of SaeR binding sites and the distances from the binding site to promoter sequence vary among sae regulons. For example, the P1 promoter, a class I target, has two SaeR binding sites (primary and secondary), and the primary binding site overlaps with the −35 region by 1 nucleotide (42). On the other hand, the hla promoter, a class II target, has only one SaeR binding site, which is 22 nt apart from the −35 region of the promoter. Since the expression of most virulence factors is controlled by multiple regulators, the interplay among the regulators in the target promoter regions may also affect the overall affinity of the promoters to P-SaeR. Our current model for the SaeRS TCS is summarized in Fig. 9. The model is based on our hypothesis that SaeP, SaeQ, and SaeS form a ternary complex, in which SaeP/SaeQ reduces SaeS function. Certainly, more works are required to identify the exact functions of SaeP and SaeQ in sae signaling.
Fig. 9.

Working model for sae signal transduction. Without exogenous stimuli, saeRS is transcribed by P3, and due to the low kinase activity of SaeS, a very low level of P-SaeR is produced. Under this condition, P-SaeR binds mainly to class II targets, which have high affinity to P-SaeR, and as a result, the class II targets are expressed normally. On the other hand, due to their low affinity to P-SaeR, class I targets such as Coa and SaePQ are produced at a very low level. When SaeS is activated by its cognate ligands, such as human neutrophil peptides, a high level of P-SaeR is produced. As a result, P-SaeR can bind not only to the class II targets but also to the class I targets, including P1, resulting in the production of SaeP and SaeQ at higher levels. Then, SaeP and SaeQ are translocated into the cytoplasmic membrane and form a complex with SaeS, inhibiting generation of P-SaeR by an as yet unknown mechanism. As a result, the activated SaeRS TCS returns to its prestimulus state, and overactivation of the system is prevented. Promoters are indicated with bent arrows. Phosphate groups are shown by black dots containing a white P. CM, cytoplasmic membrane; S, SaeS; R, SaeR; P, SaeP; Q, SaeQ.
Acknowledgements
We thank Meagan King for her editorial support. Staphylococcus aureus NRS384 (USA300-0114) was obtained through the Network on Antimicrobial Resistance in Staphylococcus aureus (NARSA) program, which is supported under NIAID/NIH contract no. HHSN272200700055C.
This study is supported by Scientist Development grant 0835158N from the American Heart Association and AI077564 from the National Institute of Allergy and Infectious Diseases to T.B.
Footnotes
Published ahead of print on 15 July 2011.
REFERENCES
- 1. Adhikari R. P., Novick R. P. 2008. Regulatory organization of the staphylococcal sae locus. Microbiology 154:949–959 [DOI] [PubMed] [Google Scholar]
- 2. Archer G. L. 1998. Staphylococcus aureus: a well-armed pathogen. Clin. Infect. Dis. 26:1179–1181 [DOI] [PubMed] [Google Scholar]
- 3. Bae T., Schneewind O. 2006. Allelic replacement in Staphylococcus aureus with inducible counter-selection. Plasmid 55:58–63 [DOI] [PubMed] [Google Scholar]
- 4. Bashyam M. D., Tyagi A. K. 1998. Identification and analysis of “extended −10” promoters from mycobacteria. J. Bacteriol. 180:2568–2673 [DOI] [PMC free article] [PubMed] [Google Scholar]
- 5. Beier D., Gross R. 2006. Regulation of bacterial virulence by two-component systems. Curr. Opin. Microbiol. 9:143–152 [DOI] [PubMed] [Google Scholar]
- 6. Belcheva A., Golemi-Kotra D. 2008. A close-up view of the VraSR two-component system. A mediator of Staphylococcus aureus response to cell wall damage. J. Biol. Chem. 283:12354–12364 [DOI] [PubMed] [Google Scholar]
- 7. Bensing B. A., Meyer B. J., Dunny G. M. 1996. Sensitive detection of bacterial transcription initiation sites and differentiation from RNA processing sites in the pheromone-induced plasmid transfer system of Enterococcus faecalis. Proc. Natl. Acad. Sci. U. S. A. 93:7794–7799 [DOI] [PMC free article] [PubMed] [Google Scholar]
- 8. Bischoff M., et al. 2004. Microarray-based analysis of the Staphylococcus aureus sigmaB regulon. J. Bacteriol. 186:4085–4099 [DOI] [PMC free article] [PubMed] [Google Scholar]
- 9. Cheung A. L., Nishina K. A., Trotonda M. P., Tamber S. 2008. The SarA protein family of Staphylococcus aureus. Int. J. Biochem. Cell Biol. 40:355–361 [DOI] [PMC free article] [PubMed] [Google Scholar]
- 10. Duthie E. S., Lorenz L. L. 1952. Staphylococcal coagulase; mode of action and antigenicity. J. Gen. Microbiol. 6:95–107 [DOI] [PubMed] [Google Scholar]
- 11. Fournier B., Klier A., Rapoport G. 2001. The two-component system ArlS-ArlR is a regulator of virulence gene expression in Staphylococcus aureus. Mol. Microbiol. 41:247–261 [DOI] [PubMed] [Google Scholar]
- 12. Geiger T., Goerke C., Mainiero M., Kraus D., Wolz C. 2008. The virulence regulator Sae of Staphylococcus aureus: promoter activities and response to phagocytosis-related signals. J. Bacteriol. 190:3419–3428 [DOI] [PMC free article] [PubMed] [Google Scholar]
- 13. Giraudo A. T., Calzolari A., Cataldi A. A., Bogni C., Nagel R. 1999. The sae locus of Staphylococcus aureus encodes a two-component regulatory system. FEMS Microbiol. Lett. 177:15–22 [DOI] [PubMed] [Google Scholar]
- 14. Giraudo A. T., Cheung A. L., Nagel R. 1997. The sae locus of Staphylococcus aureus controls exoprotein synthesis at the transcriptional level. Arch. Microbiol. 168:53–58 [DOI] [PubMed] [Google Scholar]
- 15. Giraudo A. T., Mansilla C., Chan A., Raspanti C., Nagel R. 2003. Studies on the expression of regulatory locus sae in Staphylococcus aureus. Curr. Microbiol. 46:246–250 [DOI] [PubMed] [Google Scholar]
- 16. Goerke C., et al. 2005. Role of Staphylococcus aureus global regulators sae and sigmaB in virulence gene expression during device-related infection. Infect. Immun. 73:3415–3421 [DOI] [PMC free article] [PubMed] [Google Scholar]
- 17. Hanahan D. 1983. Studies on transformation of Escherichia coli with plasmids. J. Mol. Biol. 166:557–580 [DOI] [PubMed] [Google Scholar]
- 18. Hoch J. A. 2000. Two-component and phosphorelay signal transduction. Curr. Opin. Microbiol. 3:165–170 [DOI] [PubMed] [Google Scholar]
- 19. Karimova G., Pidoux J., Ullmann A., Ladant D. 1998. A bacterial two-hybrid system based on a reconstituted signal transduction pathway. Proc. Natl. Acad. Sci. U. S. A. 95:5752–5756 [DOI] [PMC free article] [PubMed] [Google Scholar]
- 20. Kraemer G. R., Iandolo J. J. 1990. High-frequency transformation of Staphylococcus aureus by electroporation. Curr. Microbiol. 21:373–376 [Google Scholar]
- 21. Kreiswirth B. N., et al. 1983. The toxic shock syndrome exotoxin structural gene is not detectably transmitted by a prophage. Nature 305:709–712 [DOI] [PubMed] [Google Scholar]
- 22. Kuroda H., Kuroda M., Cui L., Hiramatsu K. 2007. Subinhibitory concentrations of beta-lactam induce haemolytic activity in Staphylococcus aureus through the SaeRS two-component system. FEMS Microbiol. Lett. 268:98–105 [DOI] [PubMed] [Google Scholar]
- 23. Kuroda M., et al. 2003. Two-component system VraSR positively modulates the regulation of cell-wall biosynthesis pathway in Staphylococcus aureus. Mol. Microbiol. 49:807–821 [DOI] [PubMed] [Google Scholar]
- 24. Kuroda M., Kuwahara-Arai K., Hiramatsu K. 2000. Identification of the up- and down-regulated genes in vancomycin-resistant Staphylococcus aureus strains Mu3 and Mu50 by cDNA differential hybridization method. Biochem. Biophys. Res. Commun. 269:485–490 [DOI] [PubMed] [Google Scholar]
- 25. Lee C. Y., Buranen S. L., Ye Z. H. 1991. Construction of single-copy integration vectors for Staphylococcus aureus. Gene 103:101–105 [DOI] [PubMed] [Google Scholar]
- 26. Li D., Cheung A. 2008. The repression of hla by rot is dependent on sae in Staphylococcus aureus. Infect. Immun. 76:1068–1075 [DOI] [PMC free article] [PubMed] [Google Scholar]
- 27. Liang X., et al. 2006. Inactivation of a two-component signal transduction system, SaeRS, eliminates adherence and attenuates virulence of Staphylococcus aureus. Infect. Immun. 74:4655–4665 [DOI] [PMC free article] [PubMed] [Google Scholar]
- 28. Lowy F. D. 1998. Staphylococcus aureus infections. N. Engl. J. Med. 339:520–532 [DOI] [PubMed] [Google Scholar]
- 29. Luong T. T., et al. 2011. Staphylococcus aureus ClpC divergently regulates capsule via sae and codY in strain Newman but activates capsule via codY in strain UAMS-1 and in strain Newman with repaired saeS. J. Bacteriol. 193:686–694 [DOI] [PMC free article] [PubMed] [Google Scholar]
- 30. Mainiero M., et al. 2010. Differential target gene activation by the Staphylococcus aureus two-component system saeRS. J. Bacteriol. 192:613–623 [DOI] [PMC free article] [PubMed] [Google Scholar]
- 31. Mascher T. 2006. Intramembrane-sensing histidine kinases: a new family of cell envelope stress sensors in Firmicutes bacteria. FEMS Microbiol. Lett. 264:133–144 [DOI] [PubMed] [Google Scholar]
- 32. McNamara P. J. 2008. Genetic manipulation of Staphylococcus aureus, p. 89–129 In Lindsay J.(ed.), Staphylococcus molecular genetics. Caister Academic Press, Norfolk, United Kingdom [Google Scholar]
- 33. Moran C. P., Jr., et al. 1982. Nucleotide sequences that signal the initiation of transcription and translation in Bacillus subtilis. Mol. Gen. Genet. 186:339–346 [DOI] [PubMed] [Google Scholar]
- 34. Novick R. P., Jiang D. 2003. The staphylococcal saeRS system coordinates environmental signals with agr quorum sensing. Microbiology 149:2709–2717 [DOI] [PubMed] [Google Scholar]
- 35. Nygaard T. K., et al. 2010. SaeR binds a consensus sequence within virulence gene promoters to advance USA300 pathogenesis. J. Infect. Dis. 201:241–254 [DOI] [PMC free article] [PubMed] [Google Scholar]
- 36. Paget M. S., Helmann J. D. 2003. The sigma70 family of sigma factors. Genome Biol. 4:203. [DOI] [PMC free article] [PubMed] [Google Scholar]
- 37. Russo F. D., Silhavy T. J. 1993. The essential tension: opposed reactions in bacterial two-component regulatory systems. Trends Microbiol. 1:306–310 [DOI] [PubMed] [Google Scholar]
- 38. Schafer D., et al. 2009. A point mutation in the sensor histidine kinase SaeS of Staphylococcus aureus strain Newman alters response to biocide exposure. J. Bacteriol. 191:7306–7314 [DOI] [PMC free article] [PubMed] [Google Scholar]
- 39. Schmittgen T. D., Livak K. J. 2008. Analyzing real-time PCR data by the comparative C(T) method. Nat. Protoc. 3:1101–1108 [DOI] [PubMed] [Google Scholar]
- 40. Steinhuber A., Goerke C., Bayer M. G., Doring G., Wolz C. 2003. Molecular architecture of the regulatory locus sae of Staphylococcus aureus and its impact on expression of virulence factors. J. Bacteriol. 185:6278–6286 [DOI] [PMC free article] [PubMed] [Google Scholar]
- 41. Sun F., et al. 2010. Aureusimines in Staphylococcus aureus are not involved in virulence. PLoS One 5:e15703. [DOI] [PMC free article] [PubMed] [Google Scholar]
- 42. Sun F., et al. 2010. In the Staphylococcus aureus two-component system sae, the response regulator SaeR binds to a direct repeat sequence and DNA binding requires phosphorylation by the sensor kinase SaeS. J. Bacteriol. 192:2111–2127 [DOI] [PMC free article] [PubMed] [Google Scholar]
- 43. Trieu-Cuot P., Carlier C., Poyart-Salmeron C., Courvalin P. 1991. Shuttle vectors containing a multiple cloning site and a lacZ alpha gene for conjugal transfer of DNA from Escherichia coli to gram-positive bacteria. Gene 102:99–104 [DOI] [PubMed] [Google Scholar]
- 44. Voyich J. M., et al. 2009. The SaeR/S gene regulatory system is essential for innate immune evasion by Staphylococcus aureus. J. Infect. Dis. 199:1698–1706 [DOI] [PMC free article] [PubMed] [Google Scholar]
- 45. West A. H., Stock A. M. 2001. Histidine kinases and response regulator proteins in two-component signaling systems. Trends Biochem. Sci. 26:369–376 [DOI] [PubMed] [Google Scholar]
- 46. Xiong Y. Q., Willard J., Yeaman M. R., Cheung A. L., Bayer A. S. 2006. Regulation of Staphylococcus aureus alpha-toxin gene (hla) expression by agr, sarA, and sae in vitro and in experimental infective endocarditis. J. Infect. Dis. 194:1267–1275 [DOI] [PubMed] [Google Scholar]
- 47. Yarwood J. M., McCormick J. K., Schlievert P. M. 2001. Identification of a novel two-component regulatory system that acts in global regulation of virulence factors of Staphylococcus aureus. J. Bacteriol. 183:1113–1123 [DOI] [PMC free article] [PubMed] [Google Scholar]