Abstract
Photoacoustic tomography (PAT) is based on the generation of ultrasound waves by heating an object with short light pulses. A three-dimensional image of the distribution of absorbed energy within the object is reconstructed from signals measured around the object with either point like or extended, linear sensors. Limited angle artefacts arise when the curve or surface connecting neighbouring detectors is not closed around the object. For this case there exists a “detection region” in which all boundaries of an object are visible in the reconstruction. All straight lines passing through each point in this region intersect the detection curve or surface at least once. Although for these points an accurate reconstruction is possible, direct back projection leads to artefacts when some of the straight lines intersect the detection surface twice and others just once. In this work special weight functions for direct, non iterative back projection are presented that reduce these kinds of artefacts. A clear improvement of image quality is shown in simulations for three-dimensional (3D) imaging with point detectors and for two-dimensional (2D) imaging using line detectors compared to reconstruction without weight factors. For the 2D case also an experiment is shown. The presented weight factors make commonly used back projection formulas suitable for more accurate reconstruction of the initial pressure distribution in cases where the detection aperture only covers a limited angle and the region of interest lies within the detection region.
Keywords: thermoacoustic, optoacoustic, imaging
1. Introduction
Photoacoustic or thermoacoustic tomography is an imaging technique to visualize structures with contrast for electromagnetic wave absorption in semitransparent media (Xu and Wang, 2006). Short pulses of electromagnetic radiation from a laser or a pulsed radio frequency (RF) or microwave source are directed at an object and cause a spatially varying temperature rise. Due to the short heating time this results in a distribution of overpressure that is proportional to the locally absorbed volumetric energy density. During relaxation of the overpressure ultrasound waves are emitted that propagate to the surface of the object, where they are measured with broad bandwidth ultrasound detectors. From the received signals the distribution of absorbed energy density (or of initial pressure p0) is reconstructed. This method has great potential in medical imaging because structures with strong optical contrast like blood vessels are clearly seen in the energy density images. Moreover, by using different electromagnetic frequencies also functional information such as blood oxygenation levels can be obtained (Laufer et al., 2005, Esenaliev et al., 2002, Wang et al., 2006). It is common practice to use the term “photoacoustic tomography” (PAT) or “optoacoustic tomography” (OAT) for the case of visible or near infrared excitation, whereas “thermoacoustic tomography” is reserved for RF or microwave excitation. The findings of the present study are valid for both cases because they only deal with ultrasound detection and image reconstruction. For the sake of brevity the term “photoacoustic tomography” (PAT) will be used throughout this article.
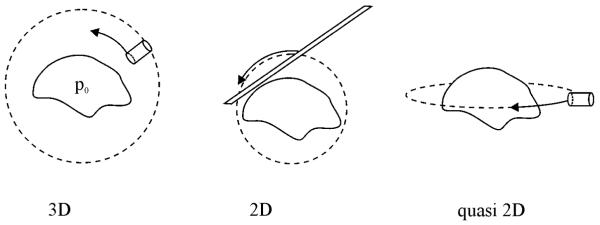
The practical implementations of photoacoustic tomography setups can be classified in three categories, depending on the kind and distribution of ultrasound sensors (figure 1). In three-dimensional (3D) PAT small, point like detectors are distributed on a surface surrounding the object (Kruger et al., 2003, Kruger et al., 99). Two-dimensional (2D) PAT uses detectors having the shape of a thin line, and signals are received by an array of such lines distributed on a curve in a plane perpendicular to the line. The curve encloses the projection of the initial pressure distribution in the object along the line direction. Due to the integrating effect of the line the imaging problem is strictly two-dimensional (Burgholzer et al., 2005, Paltauf et al., 2007b, Paltauf et al., 2007a) but can also result in a 3D image as will be shown below. Finally, in quasi 2D PAT small detectors are distributed on a curve that surrounds a 3D object. Usually this curve lies in a plane and is a circle. To limit the imaging zone to a slab close to the plane of the circle, the detector is equipped with a cylindrical lens that narrows its directivity to the required zone (Wang et al., 2003). In each case either a single scanning detector or a detector array is employed, or a combination of both where a small array is scanned around the object. Image reconstruction differs for these three types of setups. In 3D tomography the inversion of 3D wave propagation is achieved by a filtered back projection algorithm that distributes the pressure measured at a point on the detection surface at time t over the surface of a sphere with radius cst (where cs is the speed of sound) and the point in the centre (Xu and Wang, 2005). From this algorithm a formula can be derived for the 2D case employing line detectors (Burgholzer et al., 2007), where back projection is performed over the area of a circle surrounding the detection point with a radius dependent weight that peaks at the circumference of the circle. A similar formula was found for the quasi 2D case, which is not governed by the inversion of the 2D wave propagation but rather by inversion of the circular means operator (Finch et al., 2007). For 3D imaging also frequency-domain algorithms are known, giving an exact reconstruction for either an infinite planar, cylindrical or a spherical distribution of point receivers (Kostli et al., 2001, Xu et al., 2002, Xu and Wang, 2002, Xu et al., 2002). The algorithm for the planar detection surface can be easily adapted to the 2D case, where it is valid for an infinite detection line (Kostli and Beard, 2003, Paltauf et al., 2007a).
Figure 1.
Common setups for photoacoustic tomography. Left: 3D imaging using a point detector scanning over a surface enclosing the object. Middle: 2D imaging using a line detector scanning along a curve around the object. Right: Quasi 2D imaging with a focused point detector scanning along a curve in a plane, surrounding the object.
The 3D and the quasi 2D imaging configurations give the desired image information, the 3D distribution of initial pressure p0 or the distribution of p0 in a slice, after applying the suitable algorithm. The strict 2D case gives, for a defined orientation of the line detectors, an image corresponding to a linear projection of p0 on a plane perpendicular to the line. A 3D image can then be obtained by rotating the orientation of the line detectors relative to the object and by taking a complete set of projections, from which a 3D image is obtained by applying the standard inverse Radon transform (Paltauf et al., 2007b, Paltauf et al., 2007a, Burgholzer et al., 2005).
The mentioned reconstruction algorithms are only exact if the detection surface or curve completely surrounds the object. Any deviation from the ideal closed detection geometry gives rise to what is called a limited view or limited angle problem for which limitations exist concerning the exactness and stability of the reconstructions. Such deviations arise, for example, in 3D imaging, if the receiving detection surface is a finite plane. Because of its importance for breast imaging the image reconstruction from data measured on a half circular or hemispherical detector distribution has received much attention (Andreev et al., 2002, Popov and Sushko, 2004). For partly closed detection geometry, where a part of the reconstructed zone is enclosed by the detection surface or curve, it can be shown that sufficient data for a stable reconstruction of all object boundaries are present in a “detection region” (Louis and Quinto, 2000, Xu et al., 2004). The requirement for this region is that the detection view angle, defined as the angle (or solid angle for 3D imaging) occupied by the detection curve (or surface) when seen from the reconstruction point, should be at least π or 2π for 2D and 3D imaging, respectively. In other words, the detection region is enclosed by the detection curve or surface in a way that all straight lines going through each point in this region should intersect the detection curve or surface at least once.
In limited angle PAT the missing data leads to artefacts that can be categorized as follows: (1) Missing information outside the detection region leads to locally varying blurring of reconstructed images. (2) Points receiving different weight due to different detection view angles are reconstructed with wrong relative amplitude. (3) Inside the detection region, artefacts arise from duplicate directions. With “directions” we mean for a specific reconstruction point the direction of the tangent (or tangential plane) of the back projection circle (or sphere) that is centred at a detector and goes through this point. Duplicate directions occur when directions from two detectors coincide at a detection point. This happens in the detection region when two detectors are on opposite sides of the detection curve or surface with respect to the reconstruction point. Since from a range of detectors only one direction contributes to the reconstruction, there appears shading in the background of the image. Artefacts (2) and (3) are both caused by the spatially varying detection view angle and are therefore closely related. There have been attempts to regain missing information using data completion (Patch, 2004, Patrickeyev I. and Oraevsky A.A., 2004). The variable weight can be corrected by applying a posteriori a weight factor that is given by the total detection view angle (2π or 4π for 2D and 3D imaging, respectively) divided by the spatially variable actual detection view angle (Xu et al., 2004). Finally, the artefacts arising from duplicate directions are in PAT reduced by the use of iterative reconstruction techniques (Pan et al., 2003, Haltmeier et al., 2007, Xu et al., 2004, Paltauf et al., 2007a). Recently, also a non-iterative algorithm was presented that is based on filter functions precomputed for certain detector geometries (Kunyansky, 2008).
Inspired by the similarity to fan beam reconstruction (Kak, A. C. and Slaney, M., 88), we are in this work seeking a method for direct, non iterative back projection reconstruction for limited angle photoacoustic imaging. We propose appropriate weight factors that reduce artefacts due to variable detection view angle and duplicate directions. In this study we will concentrate on 2D and 3D imaging and the situation where all reconstruction points lie within the detection region.
2. Back projection with weight factors
The photoacoustic tomography problem can be generalized for the 2D and 3D cases in the following way. Detectors are distributed at positions r0 on a curve C0 or surface S0 for the 2D and 3D case, respectively, and receive time dependent signals p(r0,t). The universal back projection formula established by Xu and Wang (Xu and Wang, 2005) gives an estimate of the initial pressure at point r,
| (1) |
where d = r − r0, d = |d|, cs is the speed of sound and the integration goes over the total solid angle (or angle in 2D) Ω0 of the detection aperture. This formula states that the initial pressure can be obtained by back projecting a quantity b derived from the measured signals with appropriate time delays, weighted with dΩ0, which is the (solid) angle of one detection element with respect to the reconstruction point r. For the 3D case, b and dΩ0 are given by
| (2) |
where dS0 is the surface element on the detection surface and is the normal unit vector perpendicular to S0, pointing towards the photoacoustic source. For the 2D case these two quantities are defined by
| (3) |
Now, dC0 is the line element on the detection curve and dΩ0 is an angle element. It could be shown that the universal back projection (UBP) formula is exact for detection surfaces in the shape of a sphere, an infinite cylinder or an infinite plane for 3D, and for a circle or an infinite line in 2D (Burgholzer et al., 2007). For sphere and cylinder Ω0 = 4π, for infinite plane and for circle Ω0 = 2π and for the infinite line Ω0 = π. If the detection aperture is limited, e.g. for a hemisphere, different points r will see different total solid angles, which will result in spatially varying weight and wrong relative amplitudes of reconstructed points. A way to correct for this artefact is to use for each point the actual total angle Ω0(r) (Xu et al., 2004). Since it only depends on the reconstruction point r, this weight factor can be applied to the reconstructed image.
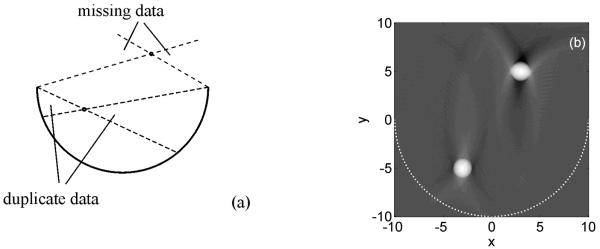
The effects of missing data for positions outside the detection region and of duplicate data inside are illustrated in figure 2. Boundaries of an object outside the detection region will appear blurred if they are located in the range of missing data because waves that propagate perpendicularly to the boundary do not reach the detection aperture. The resulting distortion of the object is demonstrated in figure 2b, showing a 2D image of two uniformly heated spheres lying outside and inside the detection arc. The upper sphere is slightly smeared in horizontal direction. Duplicate directions in reconstructions appear if Ω0(r) > π (2D) or Ω0(r) > 2π (3D). All boundaries appear sharp but the simultaneous occurrence of single and duplicate directions causes shading in the background (figure 2b).
Figure 2.
PAT with half circular or hemispherical detector distributions. (a) Waves originating at a point and propagating in the indicated ranges are either not detected (missing data) or are detected twice (duplicate data). (b) Simulation of 2D PAT with spherical sources lying inside and outside the detection region. The arc shaped detection curve is indicated as a dashed white line.
We now concentrate on the reduction of artefacts in the detection region and show how weight factors w(r, r0) can be defined that simultaneously correct for variable detection view angle and duplicate data. These weight factors are multiplied with the integrand b(r0,t) in equation (1). In an earlier work we used truncation of back projection arcs with a 1-0 window (Paltauf et al., 2007a) to avoid data overlap and could show that the smearing artefacts can be reduced. In the case of an arc-shaped detection curve shown in figure 2 such a window can be implemented by using only data from points in the detection curve below the reconstruction point, leading to a “dynamic aperture length” (DAL) correction. However, such truncation is known to induce high frequency artefacts and also does not use all available data. A better solution is to use smooth weight functions that are defined in a similar way as in limited angle fan and cone beam x-ray computed tomography (Kak, A. C. and Slaney, M., 88). Appropriate filter functions for back projection should satisfy the following two conditions: (1) Outside the zone of duplicate directions the detector signals are back projected with weight 1. In the zone where duplicate directions exist, weight factors are defined that complement each other to 1. (2) The functions defining the weight factors should be smooth in the whole range, and should therefore be continuous and have continuous first derivative.
The following weight functions for 2D PAT fulfil these requirements. They are given as a function of angle β, defined in figure 3a.
| (4) |
Figure 3.
Smooth weight factors can be either defined (a) as a function of angle β denoting a direction of propagation in the zone of data overlap or (b) of depths z and z0 in the detection region.
Data ranges A and B have overlapping information for the depicted reconstruction point and receive complementary weight factors wA and wB, whereas no overlap is caused by data in range C. It has to be noted that these weight factors do not depend on the actual shape of the detection curve, but only on the angle β. The same factors could therefore also be used for an open box as detection curve or for some other practically feasible shape.
Another strategy for finding weight factors satisfying the conditions above is to define a smooth weight function w1 for detector points r0,1 lying above the reconstruction point r in figure 3b. These points are defined by z0,1 < z, where z is the coordinate of the reconstruction point and z0 the position on the detection surface. The detector points r0,2 lying on the opposite side of the detection surface with respect to r then receive the complementary weight w2.
| (5) |
The factor 0.5 in front of sin2 leads to equal weight from opposite points for z = z0. This kind of weight function is used for 3D imaging, where it is easier to implement than the weight factors in equation (4).
3. Simulation
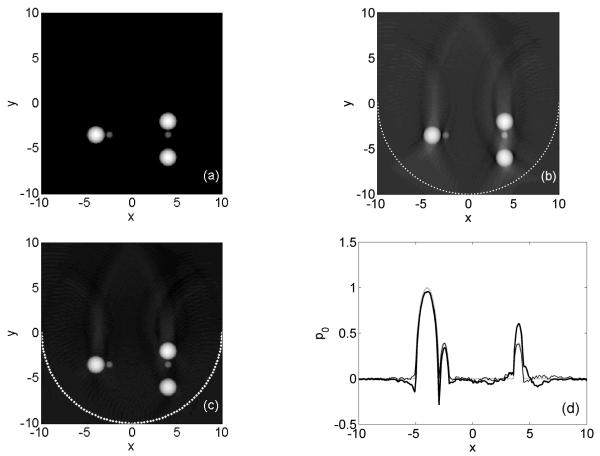
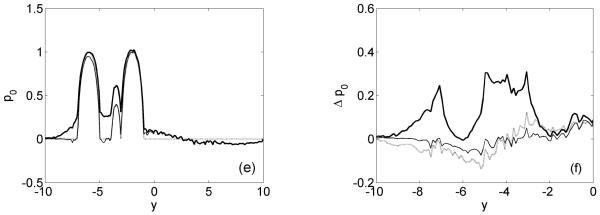
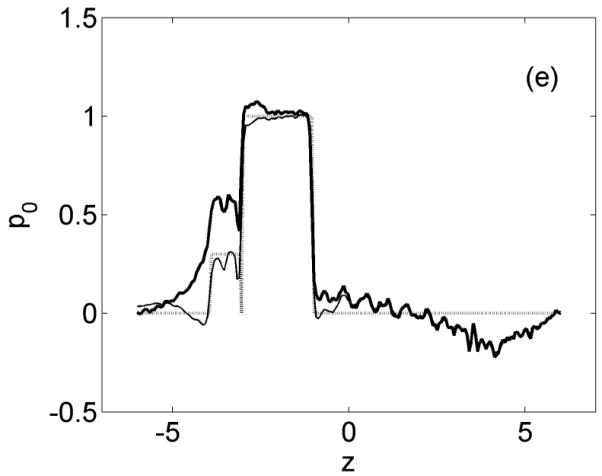
Simulations were performed with phantoms consisting of several uniformly heated spheres. For this kind of photoacoustic source an analytical solution of the wave equation is available for the 3D case (Diebold et al., 91), from which an analytical 2D solution can be obtained by integration over a line. When simulating signals for the line detector, the 2D source is a projection of the uniformly heated sphere in line direction. Figure 4 shows the 2D imaging case for a half-circular detection curve (π-arc) with radius R = 10 and its centre at x = y = 0, shown as dotted white line in figure 4(b) and (c). The source distribution is shown in (a). The reconstruction using solely equation (1) but with varying total detection view angle Ω0(r) is shown in (b), and a reconstruction employing the weight factors introduced in equation (4) in image (c). Images (d, e) show profiles along horizontal (at y = −3.5) and vertical (at x = 4) directions through the centres of the spheres. The rounded tops indicate that the reconstructed sources are actually projections of uniformly heated spheres. The typical artefacts for an open detection curve can be seen in (b), (d) and (e), namely vertical streaks in the background and negative image values next to the spheres in horizontal direction. Both effects, the vertical streaks and the negative areas have influence on neighbouring objects such as the two smaller spheres, which appear with wrong amplitudes. All these artefacts are reduced to a large degree after applying the appropriate weight factors. The major effect is the extinction of the strong vertical streak artefact between the spheres at position x = 4. The difference between reconstructed and original pressure is plotted in Fig. 4(f), again as a profile at x = 4. Also included is a result obtained with the 1-0 window mentioned earlier (Paltauf et al., 2007a), which is more accurate than the 1/Ω0(r) weighted reconstruction, but slightly less accurate than the result obtained with smooth weight factors.
Figure 4.
Simulation of 2D imaging. (a) Original phantom. Image reconstruction (b) with 1/Ω0(r) weighting and (c) with smooth weight factors. The arc shaped detection curve is indicated as a dashed white line. (d) Horizontal profile at y = −3.5. (e) Vertical profile at x = 4. Dotted line: original, bold solid line: with 1/Ω0(r) weight, thin solid line: with smooth weight factors. (f) Difference Δp0 between vertical profiles of reconstructed and original pressure for y < 0. Bold solid line: 1/Ω0(r) weight, dotted line: 1-0-window, thin solid line: with smooth weight factors.
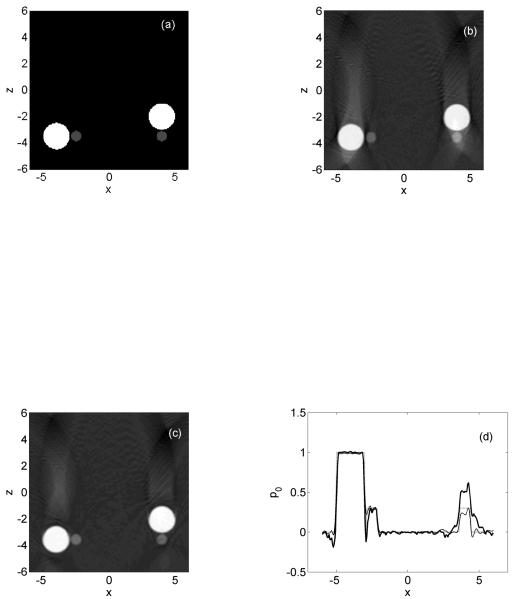
Figure 5 shows the 3D results for a similar phantom as in the 2D case. The detection surface is now a hemisphere with R = 10, centred at r = (0, 0, 0). Image (a) shows a section of the 3D source at y = 0, the plane containing the centres of the spheres. The image in (b) was corrected a posteriori using the correct detection solid angle Ω0(r). The vertical streak artefacts are clearly seen in this image and in the corresponding profiles in (d), (e). Also, the small sphere next to the bigger one on the right hand side at position (4, 0, −3.5) is reconstructed with wrong amplitude. In the reconstruction (c) with weight factors from equation (5) not only the artefacts are strongly reduced but also the spheres appear with their correct amplitudes. Note that in 3D imaging the original source is reconstructed. Spheres appear therefore with sharp edges when displaying them as section image and the corresponding profiles have rectangular shape, as opposed to the rounded shape in 2D imaging.
Figure 5.
Simulation of 3D imaging. (a) Original phantom. Image reconstruction (b) with 1/Ω0(r) weighting and (c) with smooth weight factors. (d) Horizontal profile at z = −3.5. (e) Vertical profile at x = 4. Dotted line: original, bold solid line: with 1/Ω0(r) weight, thin solid line: with smooth weight factors.
4. Experiment
Testing of the proposed weight factors for experimental data was performed in a setup for two-dimensional imaging, using a Mach-Zehnder interferometer as acoustic line detector as described in detail elsewhere (Paltauf et al., 2007b). In brief, a focused laser beam forming one arm of a Mach-Zehnder interferometer passes a water bath near the imaging object. Photoacoustically excited sound waves crossing the light beam cause an optical phase change that is converted into an amplitude modulation of the intensity after recombination of the two beams. The signal received by a fast photodetector is proportional to the integral of the acoustic pressure (the difference to ambient pressure) along the optical light path. This integration gives rise to a strict two-dimensional imaging problem. In the vicinity of the optical focus a temporal resolution of about 25 ns for the acoustic detector was achieved, given by the optical beam diameter of 38 μm (full width at half maximum). In the present experiments a phantom formed by black spheres embedded in light scattering gelatine was used as imaging object. The spheres were droplets of Castor oil mixed with black pigment. The gelatine was prepared by mixing 16% dry gelatine powder with 79% water and 5% Intralipid 20, a soy bean emulsion containing 20% fat. The phantom had the shape of a cylinder with a diameter of 13 mm and a height of 10 mm. Along its circumference the gelatine cylinder was held by a transparent, thin plastic sheet. Laser pulses with a duration of 10 ns and a wavelength of 500 nm irradiated either side of the phantom in direction of the line detector. Because the droplets were optically thick, only an outer shell was heated by the laser radiation. The 2D projection along line direction should therefore appear as a solid disk. The phantom was scanned in the water bath relative to the interferometer beam in order to achieve data acquisition along a π-arc with 10 mm radius. Signals were acquired with an angular increment of 2° at 91 positions along the scanning curve, using an average over 10 laser pulses.
5. Results
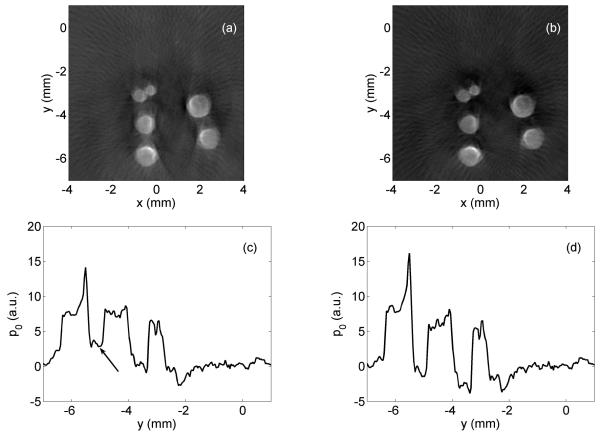
Figure 6 shows the reconstruction of the phantom using the back projection algorithm from equations (1), (3). In part (a) only the variable detection view angle Ω0(r) was used, whereas part (b) shows a reconstruction employing weight factors from equation (4). Position (0, 0) denotes the centre of the arc shaped detection curve with a total angle of π, covering the range with negative y. The centre of the cylindrical phantom was below the centre of the π-arc, approximately at position (0, −2). The main difference between the two reconstructions can be seen in the region between the two spheres at positions (−0.5, −6) and (−0.5, −4.5). Here the contrast between the objects and the background is reduced due to the strong streak artefact, which is also seen in the vertical profile at x = −0.5 mm (arrow in figure part (c)). Artefacts are reduced to a large degree by use of the weight factors, as can be seen in figures 6(b) and (d).
Figure 6.
Experimental 2D imaging of a phantom containing black spheres in light scattering gelatine. (a) Reconstruction using 1/Ω0(r) a posteriori weighting. (b) Reconstruction using smooth weight factors w(r, r0). (c) Vertical profile of image (a) at x = −0.5 mm. The arrow indicates the streak artefact. (d) Vertical profile of image (b) at x = −0.5 mm.
6. Discussion
In limited angle PAT there is a fundamental difference between regions inside and outside the detection region. Inside this zone where the detection view angle is larger than π or 2π for 2D and 3D imaging, respectively, always a stable reconstruction of all object boundaries is possible, outside not (Xu et al., 2004). This means that sufficient data is present to reconstruct sharp boundaries of an object, since acoustic waves propagating in direction perpendicular to the boundaries always hit the detection aperture in at least one direction of propagation. The fact that reconstruction is possible does not mean that a certain algorithm will work. Although it could be shown that the universal back projection formula gives an exact reconstruction for a closed detection surface or curve (Xu and Wang, 2005), a reconstruction from limited angle data suffers from artefacts caused by duplicate data. It could be shown that such artefacts can be avoided by use of iterative methods, which means in practice a greater computational effort since the same back projection procedure has to be repeated for many iterations. The weight factors demonstrated in the present work, on the other hand, enable a one-step, non iterative reconstruction by reducing the weight of parts of the detection array that contain the duplicate data.
A very promising application of PAT is breast imaging for the detection of early cancer. Due to enhanced vascularisation and differences in blood oxygenation in and around such a tumour compared to normal tissue, a clear contrast for the detection of such lesions is expected (Manohar et al., 2005, Andreev et al., 2000). This is also a typical example of a limited angle problem. The limited accessibility leads to imaging configurations in the shape of a hemisphere (Kruger et al., 99) or of an arc array (Andreev et al., 2000). One of the strengths of PAT is its ability to provide the oxygen saturation of individual vessels from small changes of image amplitudes with varying optical excitation wavelength. It is therefore of great importance to obtain not only the correct position of the blood vessels but also to reconstruct them with correct amplitude. As could be seen in the simulations, streak artefacts due to duplicate data affect mainly structures located close to each other, causing erroneous amplitudes of these structures. For example, in Fig. 4d the amplitude of the projected sphere at x = −2.5 is underestimated by about 12%, whereas the sphere at x = 4 appears with about 60% too high amplitude. After applying the proper weight factors the error relative to the original source could be kept below 4%. This demonstrated that it is possible to obtain accurate results without the need for time consuming iterative algorithms.
The proposed weight factors are not applicable to planar or linear arrays, where no duplicate directions exist. Because of the finite size of such arrays there always appear more or less strong artefacts due to the missing data. A simple way to complement the data is to add one or more additional arrays, for instance by adding data from two linear arrays arranged in an “L” configuration for improved 2D imaging (Paltauf et al., 2007a). In such a configuration there is again a range of duplicate data for which the proposed weight factors could be applied.
In conclusion, weight factors for limited angle photoacoustic imaging can be simply implemented in existing back projection algorithms and lead to a clear improvement of imaging results without the need for time consuming iterative methods.
Acknowledgment
This work has been supported by the Austrian Science Fund (FWF), project number S10502-N20.
Footnotes
PACS: 43.35.Ud, 43.60.Pt
References
- Andreev VA, Karabutov AA, Solomatin SV, Savateeva EV, Aleynikov V, Zhulina YV, Fleming RD, Oraevsky AA. Opto-acoustic tomography of breast cancer with arc-array-transducer. Biomedical Optoacoustics Proc. SPIE. 2000;3916:36–47. [Google Scholar]
- Andreev VA, Popov DA, Sushko DV, Karabutov A, Oraevsky A. Image reconstruction in 3D optoacoustic tomography system with hemispherical transducer array. Biomedical Optoacoustics III Proc. SPIE. 2002;6418:137–145. [Google Scholar]
- Burgholzer P, Bauer-Marschallinger J, Grun H, Haltmeier M, Paltauf G. Temporal Back-Projection Algorithms for Photoacoustic Tomography With Integrating Line Detectors. Inverse Problems. 2007;23:65–80. [Google Scholar]
- Burgholzer P, Hofer C, Paltauf G, Haltmeier M, Scherzer O. Thermoacoustic tomography with integrating area and line detectors. IEEE Trans. Ultrason., Ferroelect., Freq. Contr. 2005;52:1577–1583. doi: 10.1109/tuffc.2005.1516030. [DOI] [PubMed] [Google Scholar]
- Diebold GJ, Sun T, Khan MI. Photoacoustic monopole radiation in one, two, and three dimensions. Phys. Rev. Lett. 1991;67:3384–3387. doi: 10.1103/PhysRevLett.67.3384. [DOI] [PubMed] [Google Scholar]
- Esenaliev R, Larina IV, Larin KV, Deyo DJ, Motamedi M, Prough DS. Optoacoustic technique for noninvasive monitoring of blood oxygenation: a feasability study. Appl. Opt. 2002;41:4722–4731. doi: 10.1364/ao.41.004722. [DOI] [PubMed] [Google Scholar]
- Finch D, Haltmeier M, Rakesh Inversion of spherical means and the wave equation in even dimensions. SIAM Journal on Applied Mathematics. 2007 to appear. [Google Scholar]
- Haltmeier M, Kowar R, Leitao A, Scherzer O. Kaczmarz methods for regularizing nonlinear ill-posed equations II: Applications. Inverse Problems and Imaging. 2007;1:507–523. [Google Scholar]
- Kak AC, Slaney M. Principles of Computerized Tomographic Imaging. IEEE Press; New York: 1988. [Google Scholar]
- Kostli KP, Beard PC. Two-Dimensional Photoacoustic Imaging by Use of Fourier-Transform Image Reconstruction and a Detector With an Anisotropic Response. Applied Optics. 2003;42:1899–1908. doi: 10.1364/ao.42.001899. [DOI] [PubMed] [Google Scholar]
- Kostli KP, Frenz M, Bebie H, Weber HP. Temporal Backward Projection of Optoacoustic Pressure Transients Using Fourier Transform Methods. Physics in Medicine and Biology. 2001;46:1863–1872. doi: 10.1088/0031-9155/46/7/309. [DOI] [PubMed] [Google Scholar]
- Kruger RA, Kiser WL, Reinecke DR, Kruger GA, Miller KD. Thermoacoustic Molecular Imaging of Small Animals. Molecular Imaging. 2003;2:113–123. doi: 10.1162/15353500200303109. [DOI] [PubMed] [Google Scholar]
- Kruger RA, Kopecky KK, Aisen AM, Reinecke DR, Kruger GA, Kiser WL. Thermoacoustic CT with RadioWaves: A Medical Imaging Paradigm. Radiology. 1999;211:275–278. doi: 10.1148/radiology.211.1.r99ap05275. [DOI] [PubMed] [Google Scholar]
- Kunyansky L. Thermoacoustic tomography with detectors on an open curve: an efficient reconstruction algorithm. Inverse Problems. 2008;24:055021. [Google Scholar]
- Laufer J, Elwell C, Delpy D, Beard P. In Vitro Measurements of Absolute Blood Oxygen Saturation Using Pulsed Near-Infrared Photoacoustic Spectroscopy: Accuracy and Resolution. Physics in Medicine and Biology. 2005;50:4409–4428. doi: 10.1088/0031-9155/50/18/011. [DOI] [PubMed] [Google Scholar]
- Louis AK, Quinto ET. Local tomographic methods in SONAR. In: Colton D, Engl H, Louis A, McLaughlin J, Rundell W, editors. Surveys on solution methods for inverse problems. Springer; Vienna: 2000. [Google Scholar]
- Manohar S, Kharine A v H J C G, Steenbergen W, Van Leeuwen TG. The Twente Photoacoustic Mammoscope: system overview and performance. Phys. Med. Biol. 2005;50:2543–2557. doi: 10.1088/0031-9155/50/11/007. [DOI] [PubMed] [Google Scholar]
- Paltauf G, Nuster R, Haltmeier M, Burgholzer P. Experimental evaluation of reconstruction algorithms for limited view photoacoustic tomography with line detectors. Inverse Problems. 2007a;23:S81–S94. [Google Scholar]
- Paltauf G, Nuster R, Haltmeier M, Burgholzer P. Photoacoustic tomography using a Mach-Zehnder interferometer as acoustic line detector. Appl. Opt. 2007b;46:3352–3358. doi: 10.1364/ao.46.003352. [DOI] [PubMed] [Google Scholar]
- Pan XC, Zou Y, Anastasio MA. Data Redundancy and Reduced-Scan Reconstruction in Reflectivity Tomography. Ieee Transactions on Image Processing. 2003;12:784–795. doi: 10.1109/TIP.2003.814244. [DOI] [PubMed] [Google Scholar]
- Patch SK. Thermoacoustic Tomography - Consistency Conditions and the Partial Scan Problem. Physics in Medicine and Biology. 2004;49:2305–2315. doi: 10.1088/0031-9155/49/11/013. [DOI] [PubMed] [Google Scholar]
- Patrickeyev I, Oraevsky AA. Removing image artifacts in optoacoustic tomography using virtual transducer restoration. Photons Plus Ultrasound: Imaging and Sensing Proc. SPIE. 2004;5320:249–256. [Google Scholar]
- Popov DA, Sushko DV. Image restoration in optical-acoustic tomography. Problems of Information Transmission. 2004;40:254–278. [Google Scholar]
- Wang XD, Pang YJ, Ku G, Xie XY, Stoica G, Wang LV. Noninvasive Laser-Induced Photoacoustic Tomography for Structural and Functional in Vivo Imaging of the Brain. Nature Biotechnology. 2003;21:803–806. doi: 10.1038/nbt839. [DOI] [PubMed] [Google Scholar]
- Wang XD, Xie XY, Ku GN, Wang LV. Noninvasive Imaging of Hemoglobin Concentration and Oxygenation in the Rat Brain Using High-Resolution Photoacoustic Tomography. Journal of Biomedical Optics. 2006:11. doi: 10.1117/1.2192804. [DOI] [PubMed] [Google Scholar]
- Xu MH, Wang LV. Time-Domain Reconstruction for Thermoacoustic Tomography in a Spherical Geometry. Ieee Transactions on Medical Imaging. 2002;21:814–822. doi: 10.1109/TMI.2002.801176. [DOI] [PubMed] [Google Scholar]
- Xu MH, Wang LV. Universal back-projection algorithm for photoacoustic computed tomography. Phys. Rev. E. 2005;71:016706. doi: 10.1103/PhysRevE.71.016706. [DOI] [PubMed] [Google Scholar]
- Xu MH, Wang LV. Photoacoustic Imaging in Biomedicine. Review of Scientific Instruments. 2006;77:041101. [Google Scholar]
- Xu Y, Feng DZ, Wang LV. Exact Frequency-Domain Reconstruction for Thermoacoustic Tomography - I: Planar Geometry. IEEE Transactions on Medical Imaging. 2002;21:823–828. doi: 10.1109/tmi.2002.801172. [DOI] [PubMed] [Google Scholar]
- Xu Y, Wang LV, Ambartsoumian G, Kuchment P. Reconstructions in limited-view thermoacoustic tomography. Medical Physics. 2004;31:724–733. doi: 10.1118/1.1644531. [DOI] [PubMed] [Google Scholar]
- Xu Y, Xu MH, Wang LV. Exact Frequency-Domain Reconstruction for Thermoacoustic Tomography - Ii: Cylindrical Geometry. IEEE Transactions on Medical Imaging. 2002;21:829–833. doi: 10.1109/TMI.2002.801171. [DOI] [PubMed] [Google Scholar]


