

Abstract
Biological membranes present a highly fluid environment, and integration of proteins within such membranes is itself highly dynamic: proteins diffuse laterally within the plane of the membrane and rotationally about the normal vector of this plane. We demonstrate that whole-body motions of proteins within a lipid bilayer can be determined from NMR 15N relaxation rates collected for different-sized bicelles. The importance of membrane integration and interaction is particularly acute for proteins and peptides that function on the membrane itself, as is the case for pore-forming and fusion-inducing proteins. For the influenza hemagglutinin fusion peptide, which lies on the surface of membranes and catalyzes the fusion of membranes and vesicles, we found large-amplitude, rigid-body wobbling motions on the nanosecond time scale relative to the lipid bilayer. This behavior complements prior analyses where data were commonly interpreted in terms of a static oblique angle of insertion for the fusion peptide with respect to the membrane. Quantitative disentanglement of the relative motions of two interacting objects by systematic variation of the size of one is applicable to a wide range of systems beyond protein–membrane interactions.
Influenza hemagglutinin (HA) is a viral fusion glycoprotein composed of a homotrimer of two subunits, HA1 and HA2, and it is responsible for fusing the membrane of the viral envelope to that of the host-cell endosome.(1) Within the endosome, a decrease in pH induces a conformational change that exposes and anchors the ∼23 N-terminal residues of the HA2 subunit,(2) known as the hemagglutinin fusion peptide or HAfp23, into the endosomal membrane. Even conservative mutations in this N-terminal sequence of hemagglutinin can abrogate its ability to fuse membranes,(3) but the N-terminal peptide alone is sufficient to promote fusion of lipid vesicles.(4)
The HAfp23 domain adopts a tight antiparallel helical hairpin structure with its hydrophobic face buried in the membrane and its more polar face exposed to solvent.(5) The membrane integration of HAfp20, a truncated and less structured peptide lacking three completely conserved C-terminal residues, adopts a more open and dynamically less ordered structure but remains fusogenic.4,6,7 There is considerable evidence that anchoring of the fusion peptide in a lipid bilayer causes the formation of high-curvature states of the membrane surface, which can enable membrane fusion.8,9 Accordingly, there has been keen interest in its specific position and orientation within the membrane, with results suggesting that an oblique angle of insertion is required for fusogenicity of fusion peptides.10,11
Attenuated total reflectance Fourier transform IR spectroscopy (ATR-FTIR) has been particularly fruitful in this pursuit.6,9,10,12,13 This technique measures the dichroic ratios of the amide I′ bands to derive the average peptide group transition dipole orientational order parameter, and thereby the helical axis orientation, relative to the membrane normal. Though there is some disagreement on the exact value of the order parameter for HAfp, results have been interpreted in terms of a static oblique angle of insertion into the membrane under “the simplifying assumption that all peptides [are] aligned at the same angle in a given sample”.(6) Other approaches have relied on neutron diffraction(14) and electron paramagnetic resonance (EPR) to measure immersion depths and angles.(13) These latter studies used paramagnetic probes attached to single cysteine variants of the peptides.(15) Although this approach can precisely ascertain the depth of these probes in the membrane, and from that the orientation of an α-helix, the biological implications of those results are impacted by the finding that such probes can significantly alter the fusion peptide’s location in a lipid bilayer.(16) Moreover, mutations even more conservative than replacement of a cysteine often abolish the fusogenic activity of these peptides.(3) A second problem is that for all of these measurements, it remains difficult to separate the effect of average orientation from the width of the dynamic distribution adopted by the peptide.
NMR spectroscopy is potentially well-suited for answering questions regarding membrane protein topology(17) and dynamics(18) in membrane-mimetic and micellar environments. Here we use a novel approach to evaluate quantitatively the orientational distribution of HAfp23 relative to the planar bilayer component of isotropic bicelles and the rate at which the fusion peptide reorients relative to this bilayer.
Isotropic bicelles are mixed micelles composed of the detergent dihexanoyl phosphatidylcholine (DHPC) or its hydrolysis-resistant, ether-linked analogue dihexyl PC (DOHPC) and dimyristoyl PC (DMPC). Below a [DMPC]/[DHPC] molar ratio (q) of ∼2.5, these bicelles adopt a disk-shaped morphology and tumble freely in solution. The detergent in such bicelles is partitioned on the rim, whereas the plane of the bicelle provides an excellent mimic of a pure DMPC bilayer.19,20 The diameter of these bicelles scales steeply with q.(19,21) Model calculations indicate that the diameter of the planar region of the bicelle increases from ∼40 to ∼100 Å as q increases from 0.2 to 0.7, corresponding to objects that are tens to hundreds of kDa in mass.
Measuring the 15N relaxation rates of HAfp23 in micelles and isotropic bicelles of increasing size allows the effect of overall tumbling of the lipid/peptide complex to be separated from the motion of the HAfp23 within this complex. Prerequisites for this analysis are that the HAfp23 retains the same structure and internal dynamics and that its angular excursions relative to the water–lipid interface are independent of the size and composition of the complex. Strong support for the structural and dynamic invariance of HAfp23 embedded in micelles and bicelles with different sizes is found in the virtually indistinguishable resonance positions in 1H–15N HSQC spectra (Figure 1).
Figure 1.

Superimposed TROSY–HSQC spectra (600 MHz) of HAfp23 in DPC micelles and small (q = 0.29), medium (q = 0.55), and large (q = 0.69) bicelles, recorded at pH 7.3 ± 0.1 and 32 °C using 0.3 ± 0.1 mM HAfp23 and 5% (w/v) DPC or 7–10% (w/v) bicelles.
The 15N relaxation rates of HAfp23 solubilized in DOHPC/DMPC bicelles indicate a strong dependence on q (i.e., on the size of the bicelle) (Figure 2). In addition to the rates previously reported for HAfp23 in DPC micelles,(5) the data include measurements taken for four different sizes of bicelles [small (q = 0.29), medium (0.52 and 0.55), and large (0.69)] and two magnetic fields (600 and 900 MHz 1H frequency). The relaxation rates for residues F3–G12 and W14–Y22, which constitute the two antiparallel α-helices, are highly homogeneous, as expected for 15N–1H amide bonds that are tightly clustered in orientation along the directions of the nearly antiparallel helical axes. G23, which caps the second helix, exhibits increased internal dynamics, as evidenced by depressed 15N-{1H} NOE and R2 [derived from R1ρ; see the Supporting Information (SI)] values. Remarkably, G13 shows a higher R2, in particular for the large bicelles, and this increase is nearly invariant with respect to the magnetic field strength (beyond what is expected on the basis of the increased R2 contribution from 15N chemical shift anisotropy). This increased R2 therefore is not caused by conformational exchange but instead must be due to different dynamic behavior for this 15N–1H pair, whose orientation is roughly orthogonal to the other 15N–1H dipoles.
Figure 2.
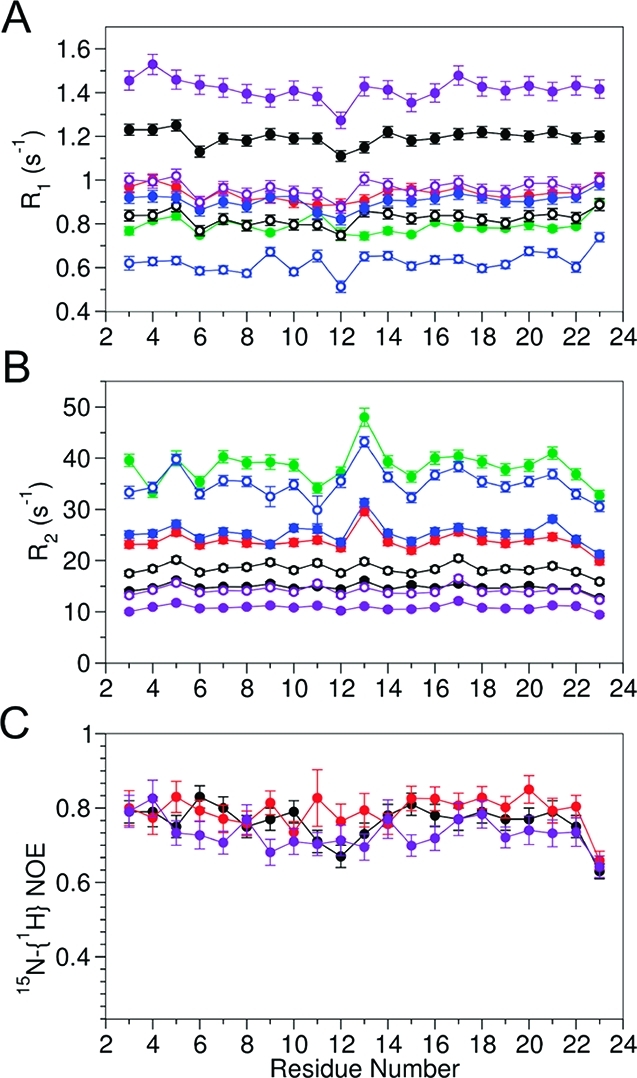
(A, B) 15N relaxation rates R1 and R2 and (C) 15N-{1H} NOEs of HAfp23 in DPC micelles (purple) and DOHPC/DMPC bicelles of different sizes: small (q = 0.29, black); medium (q = 0.52, red; q = 0.55, blue), and large (q = 0.69, green). The q = 0.55 sample was at a lower pH (6.5) than the other samples (7.1–7.4). Data were measured at 600 MHz (solid symbols) and 900 MHz (open symbols).
When fitted separately, the relaxation data acquired for each of the HAfp23/phospholipid complexes can be fit reasonably well with the standard Lipari–Szabo model-free formalism(22) (Table S2 and Figure S2 in the SI). Data recorded for the peptide in DPC micelles and in the smallest bicelles (q = 0.29) show relaxation behavior very similar to that typically seen for a well-structured globular protein, yielding high order parameters (S2 > ∼0.9) with short internal correlation times (τi < ∼1 ns). However, fitting the relaxation rates measured at higher q values (medium and large bicelles) required the inclusion of slower internal motions (in the 2–10 ns range) with lower generalized order parameters (S2 = 0.6–0.8). Thus, the parameters describing the internal dynamics obtained from the separate fits were found to change considerably with bicelle size, in contradiction with the virtually identical resonance positions.
Alternatively, the relaxation data can be analyzed under the assumption that the internal dynamics of HAfp23 is independent of the overall motion of the complex if the overall rotational diffusion rate is treated as an adjustable parameter that depends on the bicelle size. The variation in the fitted S2 and τi values with bicelle size (see above) already indicates that no adequate fit is obtainable with the standard Lipari–Szabo model-free approach in such a simultaneous fit (Figure S3). Instead, the extended Lipari–Szabo model(23) must be used to fit the data, allowing for a fast (picosecond) and slow (nanosecond) internal motion process. Under one scenario (model A), the 15N relaxation data recorded at different q values and magnetic field strengths were fit with a single set of residue-specific order parameters and internal correlation times by minimizing the following χ2 residual:
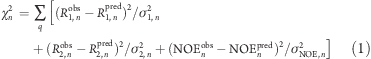 |
where the summation over q includes data measured for the micelle and different bicelle sizes, the index n refers to the residue number, and the predicted relaxation rates R1pred and R2 and NOEpred were calculated with the extended Lipari–Szabo model. Variables in this fit include the fast and slow internal correlation times τf,n and τs,n, their corresponding generalized order parameters Sf,n2 and Ss,n, and the global rotational correlation times τR,q for each bicelle size. Overall rotation was treated as isotropic because the bicelle forms an oblate spheroid with a rotational diffusion anisotropy that does not exceed 1.25,(24) so the entire span in effective tumbling rates for the N–H vectors cannot exceed ±8%. The actual variation in tumbling rates is expected to be much smaller than 8% because the NH vectors span a narrow range of orientations, none parallel to the bilayer normal.(5)
In this fit using model A, residue-specific values for τf,n, τs,n, Sf,n2, and Ss,n were forced to adopt the same value for lipid complexes of all sizes (for details, see the SI). The relaxation rates for the vast majority of residues could be fit nearly as well with this restricted fitting mode (Table S3), despite the inclusion of nearly 5 times fewer adjustable parameters compared with the original fits where the relaxation data obtained for each bicelle size were treated independently. Remarkably, except for residue G13, which separates helices 1 and 2, and the C-terminal residue G23 of helix 2, the best-fit τs and Ss2 values obtained in this manner were found to cluster in narrow ranges: ⟨τs⟩ = 5.1 ± 1.4 ns and Ss = 0.74 ± 0.04.
The narrow clustering of the slow internal motion parameters for the HAfp23 amide protons strongly suggests that these parameters correspond to a single dynamic process, namely, movement of the peptide as a rigid body relative to the more slowly tumbling phospholipid complex. Indeed, under the assumption of identical motional parameters τs and Ss2 for different residues (model B), a fit of all the relaxation data for residues F3–G12 and W14–Y22 (Figure 3) yielded a χ2 nearly as low as that obtained for model A, despite the 2-fold reduction in adjustable parameters (Figure S5). The best-fit common τs and Ss parameters are 5.1 ± 0.6 ns and 0.71 ± 0.03, respectively. F-test statistics indicated that separate internal motion fit parameters are warranted for G13 and G23 (Figure S5). The low 15N-{1H} NOE and R2 values observed for G23 are indicative of relatively large amplitude, high frequency motions for this C-terminal residue of helix 2. The relaxation rates for G13, whose N–H vector is the only one oriented nearly orthogonal to the two HAfp23 helices (Figure 4), were also fit considerably better with model A, which yielded a shorter τs of 2.4 ± 0.3 ns and a higher Ss2 of 0.80 ± 0.01 relative to the helical residues (Table S4).
Figure 3.

Plots of the best-fit predicted (pred) vs observed (obs) (a, b) 15N relaxation rates and (c) 15N-{1H} NOEs for HAfp23 at 600 MHz (solid circles) and 900 MHz (open circles). The results were obtained using the extended Lipari–Szabo model(23) with identical values for the slow internal correlation time (τs = 5.1 ns) and order parameter (Ss2 = 0.71) in all cases for residues Phe3–Gly12 and Trp14–Tyr22 along with uniform, residue-specific fitting parameters τf and Sf for fast internal motion (model B; see Table S4). With the same overall rotational correlation times, the best-fit internal dynamic parameters were τs = 2.4 ns, Ss2 = 0.80 for Gly13 and τs = 3.6 ns, Ss = 0.67 for Gly23. The fitted overall rotational correlation times were 10.9 ns (DPC), 15.1 ns (q = 0.29), 26.6 ns (q = 0.52), 29.0 ns (q = 0.55), and 44.2 ns (q = 0.69). Colors correspond to values measured in DPC (purple) and small (q = 0.29, black), medium (q = 0.52, red; q = 0.55, blue), and large (q = 0.69, green) bicelles.
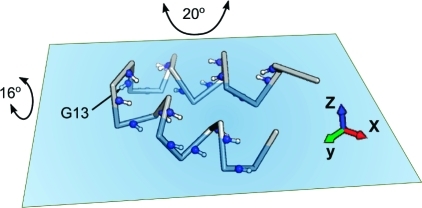
Figure 4.

Cα backbone representation (including backbone amide 15N–1H pairs) for HAfp23 and its approximate location relative to the plane of the water–lipid interface, as previously derived from intermolecular NOE measurements.(5) The axis system shown has its x axis parallel to the average N–H vector orientation of residues 3–12 and 14–22 and its z axis orthogonal to the plane. The Gly13 N–H vector is nearly parallel to the y axis. The indicated amplitudes of motion are the values of Gaussian axial fluctuations(28) about the y and x axes corresponding to Ss2 = 0.71 and 0.80, respectively.
Motions of proteins and peptides in membranes generally fall into two categories:(25) (1) axial diffusion around the membrane director (or normal) axis and (2) off-axis “wobble” diffusion about vectors in the plane of the membrane. The axial rotational diffusion correlation times of a transmembrane helix in DPPC(26) and of gramicidin A in DMPC bilayers(27) are ∼200 ns. The rotational correlation time of HAfp23, which is ∼30% smaller than the gramicidin A dimer, may then be estimated as ∼140 ns; this is considerably beyond even the longest time scale (τR = 44 ns) sampled in the largest bicelles used in our study. Such motion therefore cannot significantly contribute to the rates measured in our 15N relaxation measurements. Moreover, the Lipari–Szabo generalized order parameter for rotational diffusion about the bilayer normal is given by(22)
where θ is the angle between the 1H–15N dipole and the axis of motion. The helices and backbone 1H–15N bond vectors of HAfp23 are nearly parallel to the water–lipid interface,(5) corresponding to θ ≈ 90° or an order parameter of 0.25. Oblique orientations of its two helical axes (within ±50° of the membrane plane) would correspond to order parameters even lower than 0.25. Such axial diffusion therefore is clearly incompatible with the order parameter of 0.71, ruling out axial diffusion as the source of the observed slow internal motion.
The rigid body motion therefore must be dominated by rotations about the x and y axes, chosen to be parallel and orthogonal to the average helix axis orientation, respectively (Figure 4). The helical amide N–H vectors are, on average, oriented parallel to the x axis with a root-mean-square (rms) angle of 18°, whereas the G13 N–H is oriented nearly orthogonal to the x axis with an angle of 91°. When the slow time scale order parameters are modeled in terms of a one-dimensional Gaussian axial fluctuation model,(28)Ss2 = 0.71 corresponds to a Gaussian distribution with an rms fluctuation of σy = 20° around the y axis relative to its time-averaged orientation. Remarkably, use of a slightly smaller amplitude of rocking motions around the x axis can account for the larger R2 for G13, as reflected in its Ss value of 0.80 and compatible with σx = 16°. Modeling the slow order parameters with a cone-diffusion model yields half angles of 27° for the y axis and 22° for the x axis.(22)
The observed HAfp23 wobbling represents motion within the frame of the bicelle. Undulatory and collective motions of lipids could contribute to the observed wobbling, but such motions are far slower than observed here, and their amplitude is much smaller.29,30 Interestingly, a 5 ns time scale has been attributed to local lipid wobbling motions in Lα phase DMPC bilayers,(29) suggesting that the lipid dynamics may drive the rocking motion of the fusion peptide.
Membrane integration lies at the heart of the hemagglutinin fusion peptide’s function. Our results show that the orientation of HAfp23 relative to the water–phospholipid interface is highly dynamic and must be considered when interpreting other types of data that report on the angle of insertion relative to the lipid bilayer. Our analysis probes the relative motions of two objects, HAfp23 and the lipid bilayer, by changing the size of one of the objects (the bicelle or micelle) without impacting the nature of the interaction. This approach is analogous to experiments by Al-Hashimi and co-workers(31) that resolve motional modes in multihelical RNA structures by greatly extending the size of one of the helical stems. Indeed, varying the size of one of the interacting objects in NMR relaxation studies permits enhanced probing of dynamic aspects for a wide range of systems beyond protein–membrane interactions, including motions in multidomain proteins as well as protein–protein and protein–nucleic acid complexes. Whole-body motions of smaller amplitude recently have been observed for a small protein relative to its crystalline lattice, manifesting themselves by their R1 contributions.(32) This corresponds to the upper limit when probing size-dispersed relaxation.
Acknowledgments
We thank Annie Aniana and Jane Sayer for help with protein expression, purification, and mass spectrometry and Dennis Torchia and Attila Szabo for many helpful discussions. This work was funded by the Intramural Research Program of the National Institute of Diabetes and Digestive and Kidney Diseases, National Institutes of Health (NIH), and the Intramural AIDS-Targeted Antiviral Program of the Office of the Director, NIH.
Supporting Information Available
Experimental details regarding sample preparation and NMR measurements; tables and figures with the observed relaxation parameters and fitted data. This material is available free of charge via the Internet at http://pubs.acs.org.
Funding Statement
National Institutes of Health, United States
Supplementary Material
References
- Wiley D. C.; Skehel J. J. Annu. Rev. Biochem. 1987, 56, 365. [DOI] [PubMed] [Google Scholar]
- Carr C. M.; Chaudhry C.; Kim P. S. Proc. Natl. Acad. Sci. U.S.A. 1997, 94, 14306. [DOI] [PMC free article] [PubMed] [Google Scholar]
- Cross K. J.; Langley W. A.; Russell R. J.; Skehel J. J.; Steinhauer D. A. Protein Pept. Lett. 2009, 16, 766. [DOI] [PubMed] [Google Scholar]
- Lear J. D.; Degrado W. F. J. Biol. Chem. 1987, 262, 6500. [PubMed] [Google Scholar]
- Lorieau J. L.; Louis J. M.; Bax A. Proc. Natl. Acad. Sci. U.S.A. 2010, 107, 11341. [DOI] [PMC free article] [PubMed] [Google Scholar]
- Han X.; Bushweller J. H.; Cafiso D. S.; Tamm L. K. Nat. Struct. Biol. 2001, 8, 715. [DOI] [PubMed] [Google Scholar]
- Han X.; Tamm L. K. Proc. Natl. Acad. Sci. U.S.A. 2000, 97, 13097. [DOI] [PMC free article] [PubMed] [Google Scholar]
- Colotto A.; Epand R. M. Biochemistry 1997, 36, 7644. [DOI] [PubMed] [Google Scholar]; Epand R. M.; Epand R. F. Biopolymers 2000, 55, 358. [DOI] [PubMed] [Google Scholar]; Chernomordik L. V.; Frolov V. A.; Leikina E.; Bronk P.; Zimmerberg J. J. Cell Biol. 1998, 140, 1369. [DOI] [PMC free article] [PubMed] [Google Scholar]
- Epand R. M.; Epand R. F.; Martin I.; Ruysschaert J. M. Biochemistry 2001, 40, 8800. [DOI] [PubMed] [Google Scholar]
- Martin I.; Dubois M. C.; Defrisequertain F.; Saermark T.; Burny A.; Brasseur R.; Ruysschaert J. M. J. Virol. 1994, 68, 1139. [DOI] [PMC free article] [PubMed] [Google Scholar]
- Colotto A.; Martin I.; Ruysschaert J. M.; Sen A.; Hui S. W.; Epand R. M. Biochemistry 1996, 35, 980. [DOI] [PubMed] [Google Scholar]; Charloteaux B.; Lorin A.; Brasseur R.; Lins L. Protein Pept. Lett. 2009, 16, 718. [DOI] [PubMed] [Google Scholar]
- Gray C.; Tatulian S. A.; Wharton S. A.; Tamm L. K. Biophys. J. 1996, 70, 2275. [DOI] [PMC free article] [PubMed] [Google Scholar]
- Luneberg J.; Martin I.; Nussler F.; Ruysschaert J. M.; Herrmann A. J. Biol. Chem. 1995, 270, 27606. [DOI] [PubMed] [Google Scholar]
- Bradshaw J. P.; Darkes M. J. M.; Harroun T. A.; Katsaras J.; Epand R. M. Biochemistry 2000, 39, 6581. [DOI] [PubMed] [Google Scholar]
- Macosko J. C.; Kim C. H.; Shin Y. K. J. Mol. Biol. 1997, 267, 1139. [DOI] [PubMed] [Google Scholar]
- Sammalkorpi M.; Lazaridis T. Biophys. J. 2007, 92, 10. [DOI] [PMC free article] [PubMed] [Google Scholar]
- Respondek M.; Madl T.; Gobl C.; Golser R.; Zangger K. J. Am. Chem. Soc. 2007, 129, 5228. [DOI] [PubMed] [Google Scholar]; Dittmer J.; Thogersen L.; Underhaug J.; Bertelsen K.; Vosegaard T.; Pedersen J. M.; Schiott B.; Tajkhorshid E.; Skrydstrup T.; Nielsen N. C. J. Phys. Chem. B 2009, 113, 6928. [DOI] [PubMed] [Google Scholar]
- Papavoine C. H. M.; Remerowski M. L.; Horstink L. M.; Konings R. N. H.; Hilbers C. W.; vandeVen F. J. M. Biochemistry 1997, 36, 4015. [DOI] [PubMed] [Google Scholar]; Park S. H.; Mrse A. A.; Nevzorov A. A.; De Angelis A. A.; Opella S. J. J. Magn. Reson. 2006, 178, 162. [DOI] [PubMed] [Google Scholar]; Hong M. J. Phys. Chem. B 2007, 111, 10340. [DOI] [PubMed] [Google Scholar]; Cady S. D.; Goodman C.; Tatko C. D.; DeGrado W. F.; Hong M. J. Am. Chem. Soc. 2007, 129, 5719. [DOI] [PubMed] [Google Scholar]
- Vold R. R.; Prosser R. S. J. Magn. Reson., Ser. B 1996, 113, 267. [Google Scholar]
- Prosser R. S.; Evanics F.; Kitevski J. L.; Al-Abdul-Wahid M. S. Biochemistry 2006, 45, 8453. [DOI] [PubMed] [Google Scholar]; Poget S. F.; Girvin M. E. Biochim. Biophys. Acta 2007, 1768, 3098. [DOI] [PMC free article] [PubMed] [Google Scholar]
- Lin T. L.; Liu C. C.; Roberts M. F.; Chen S. H. J. Phys. Chem. 1991, 95, 6020. [Google Scholar]; Chou J. J.; Baber J. L.; Bax A. J. Biomol. NMR 2004, 29, 299. [DOI] [PubMed] [Google Scholar]
- Lipari G.; Szabo A. J. Am. Chem. Soc. 1982, 104, 4546. [Google Scholar]
- Clore G. M.; Szabo A.; Bax A.; Kay L. E.; Driscoll P. C.; Gronenborn A. M. J. Am. Chem. Soc. 1990, 112, 4989. [Google Scholar]
- Wright A. K.; Duncan R. C.; Beekman K. A. Biophys. J. 1973, 13, 795. [DOI] [PMC free article] [PubMed] [Google Scholar]
- Cherry R. J. Biochim. Biophys. Acta 1979, 559, 289. [DOI] [PubMed] [Google Scholar]
- Pauls K. P.; Mackay A. L.; Soderman O.; Bloom M.; Tanjea A. K.; Hodges R. S. Eur. Biophys. J. 1985, 12, 1. [DOI] [PubMed] [Google Scholar]
- Macdonald P. M.; Seelig J. Biochemistry 1988, 27, 2357. [DOI] [PubMed] [Google Scholar]
- Bruschweiler R.; Wright P. E. J. Am. Chem. Soc. 1994, 116, 8426. [Google Scholar]
- Mayer C.; Grobner G.; Muller K.; Weisz K.; Kothe G. Chem. Phys. Lett. 1990, 165, 155. [Google Scholar]
- Lindahl E.; Edholm O. J. Chem. Phys. 2001, 115, 4938. [Google Scholar]
- Zhang Q.; Sun X. Y.; Watt E. D.; Al-Hashimi H. M. Science 2006, 311, 653. [DOI] [PubMed] [Google Scholar]; Zhang Q.; Stelzer A. C.; Fisher C. K.; Al-Hashimi H. M. Nature 2007, 450, 1263. [DOI] [PubMed] [Google Scholar]
- Lewandowski J. R.; Sein J.; Blackledge M.; Emsley L. J. Am. Chem. Soc. 2010, 132, 1246. [DOI] [PubMed] [Google Scholar]
Associated Data
This section collects any data citations, data availability statements, or supplementary materials included in this article.