

Abstract
A prominent aqueous cavity is formed by the junction of three identical subunits in the excitatory amino acid transporter (EAAT) family. To investigate the effect of this structure on the interaction of ligands with the transporter, we recorded currents in voltage-clamped Xenopus oocytes expressing EAATs and used concentration jumps to measure binding and unbinding rates of a high-affinity aspartate analog that competitively blocks transport (β-2-fluorenyl-aspartylamide; 2-FAA). The binding rates of the blocker were approximately one order of magnitude slower than l-Glu and were not significantly different for EAAT1, EAAT2, or EAAT3, but 2-FAA exhibited higher affinity for the neuronal transporter EAAT3 as a result of a slower dissociation rate. Unexpectedly, the rate of recovery from block was increased by l-Glu in a saturable and concentration-dependent manner, ruling out a first-order mechanism and suggesting that following unbinding, there is a significant probability of ligand rebinding to the same or neighboring subunits within a trimer. Consistent with such a mechanism, coexpression of wild-type subunits with mutant (R447C) subunits that do not bind glutamate or 2-FAA also increased the unblocking rate. The data suggest that electrostatic and steric factors result in an effective dissociation rate that is approximately sevenfold slower than the microscopic subunit unbinding rate. The quaternary structure, which has been conserved through evolution, is expected to increase the transporters' capture efficiency by increasing the probability that following unbinding, a ligand will rebind as opposed to being lost to diffusion.
Keywords: synaptic transmission, membrane transport
Members of the SLC1 solute carrier family include transporters for acidic (EAAT1–5; SLC1A1–3, 6, 7) and neutral (ASCT1, 2; SLC1A4, 5) amino acids in mammals. Recent phylogenetic studies indicate the existence of at least two additional members of this gene family (SLC1A8, 9) that were lost in the lineage leading to mammals (1). The mammalian excitatory amino acid transporters (EAAT1–5) are secondary active transporters that help terminate glutamatergic synaptic transmission within the central nervous system by removing transmitter (l-Glu) from the extracellular space (2). EAATs can maintain an intracellular-to-extracellular l-Glu concentration ratio exceeding 106 by stoichiometrically coupling l-Glu transport to cotransport of 3 Na+, 1 H+, and 1 l-Glu and countertransport of 1 K+ (3, 4).
The crystal structure of the outward-facing state of the archaeal glutamate transporter homolog GltPh features a prominent aqueous cavity framed by three subunits forming a homotrimer (5, 6). One aspartate/glutamate binding site in each subunit faces the aqueous cavity near its base, approximately halfway across the plane of the lipid bilayer. Functional and biochemical studies of homologous mammalian glutamate transporters are consistent with this trimeric structure and indicate that each subunit functions as an independent transporter (7–9). The recent structural determination of the inward-facing form of GltPh suggests a unique mechanism for alternating access flux coupling that involves a relative motion of the central subunit core, including the substrate binding site, across the bilayer while the intersubunit contacts remain relatively fixed (10). Although the alternating access cycle is significantly slower than the time course of the synaptic transmitter transient, glutamate transporters can also function on faster timescales by buffering transmitter diffusion (2). In this study, we investigated the potential role of the central aqueous cavity in influencing the diffusion of transporter ligands.
The nontransported aspartate analog β-2-fluorenyl-aspartylamide [(S)-4-(9H-fluoren-2-ylamino)-2-amino-4-oxobutanoic acid; 2-FAA] has been reported to block glutamate uptake with nanomolar affinities and 10-fold selectivity for the neuronal transporter EAAT3 over EAAT1 and EAAT2 (11). The effects of 2-FAA concentration jumps on glutamate transporter currents revealed that the macroscopic recovery from block was approximately sevenfold slower than the microscopic unbinding rate from an individual subunit. We hypothesize that the central cavity and symmetrically juxtaposed binding sites enhance the transporters’ capture efficiency by slowing the loss of unbound ligand to the bulk medium.
Results
2-FAA Effects on Steady-State Transport Currents.
In oocytes expressing EAAT3, application of 30 μM l-glutamate induced inward currents that reached steady state within a few seconds, whereas coapplication of l-glutamate with 30 nM 2-FAA induced a fast inward current followed by a slow relaxation to a reduced steady-state level (Fig. 1A). When the oocyte was preequilibrated for 5 min with 30 nM 2-FAA, the slow relaxation phase was absent but an identical fractional block of the steady-state l-glutamate current was observed (Fig. 1B). These data are similar to results seen with the high-affinity EAAT blocker (2S,3S)-3-[3-[4-(trifluoromethyl)benzoylamino]benzyloxy]aspartate (TFB-TBOA) (12), and suggest that a slow 2-FAA block develops concomitantly with activation of the transport current. To more directly observe the pre-steady-state kinetics of the onset and offset of 2-FAA block, it was applied after the current induced by 3 μM l-glutamate reached steady state, and then 2-FAA was washed out in the continued presence of l-Glu (Fig. 1 C and D). The rate at which 2-FAA blocked the steady-state Glu current was notably slower at 10 nM than 300 nM (Fig. 1 C and D).
Fig. 1.

Effects of 2-FAA on EAAT3-mediated glutamate transport currents. (A and B) Application of 30 μM l-Glu alone or coapplied with 30 μM 2-FAA showing transient inward current that decays to steady state (A), whereas prior application of 2-FAA for 5 min (B) results in the same fractional steady-state block without a transient current. (C) Representative recording illustrating block and recovery from block of the steady-state l-Glu current (3 μM) by 2-FAA (300 nM). (D) Onset and recovery from block of steady-state l-Glu current by an 800-s application of 10 nM 2-FAA (note concentration differences). Solution-exchange kinetics show response (inverted) to an 800-s pulse of l-Glu (3 μM; Vm = −60 mV).
2-FAA Blocking Kinetics.
The 2-FAA concentration dependence of the EAAT3 blocking rate was systematically examined by rapidly applying varying concentrations of drug to oocytes preequilibrated with 3 μM l-glutamate and measuring the relaxation of the steady-state transport currents induced by application and washout of the drug (Figs. 1D and 2A). The time constant for solution exchange in the recording chamber was 2–3 s (10–90% rise time 4.0 ± 0.3 s; Fig. 1D Inset), corresponding to a rate ≥10-fold faster than the rate of onset and offset of 2-FAA block at the highest concentration measured (100 nM). Representative experiments measuring the onset of 2-FAA block illustrate that the time dependence of the steady-state current decay was well-fitted by a single exponential process (Fig. 2A). The reciprocals of the mean time constants were proportional to [2-FAA] over the range 3–100 nM (Fig. 2B). At higher concentrations of 2-FAA (300–3,000 nM), the blocking rate plateaued near 0.3 s−1, which reflects the limit of the solution-exchange time constant of the chamber.
Fig. 2.

The blocking kinetics of 2-FAA on EAAT3 transporter currents. (A) Representative traces from a single oocyte showing the decay of the steady-state transport current (3 μM l-Glu) following a jump into 3, 10, 30, or 100 nM 2-FAA (Vm = −60 mV). Data are fit to a single exponential (gray). (B) Linear regression of the blocking rates of the l-Glu (3 μM) transport current as a function of 2-FAA concentration. Fit shows slope of 4.39 ± 0.75 × 10⁵ M−1s−1 (circles) and a y intercept of 0.0038 ± 0.0007 s−1. The recovery from block for EAAT3 was independent of the concentration of 2-FAA at 10, 30, and 100 nM (squares). Each point represents mean and SEM of between 3 and 16 experiments.
At an l-Glu concentration of 3 μM, only a small fraction (∼6%) of the transporter subunits are occupied, assuming an EAAT3 Km of 44 μM (9). If the effect of substrate is neglected, a kinetic analysis of block follows from the simple reaction mechanism
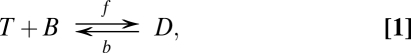 |
where T is the transporter, B is the blocking drug, and D is the blocked transporter, with forward and backward rate constants f and b. The integrated pseudo-first-order rate equation for this mechanism predicts a linear relationship between the blocking rate and the blocker concentration, where the slope is equal to the binding rate f, and the y intercept is equal to the unbinding rate b:
Linear regression of the mean [2-FAA] blocking rate data for EAAT3 represented in Fig. 3B gives a slope of 4.4 × 10⁵ M−1s−1 and a y intercept of 3.8 × 10⁻³ s−1, resulting in a Ki estimate of 8.6 nM (b/f).
Fig. 3.

A slower unbinding of 2-FAA from EAAT3 accounts for the increase in affinity over EAAT1 or EAAT2. (A) The steady-state percent block of 2-FAA for the 3 μM l-Glu transporter current: EAAT1 (diamonds; IC50 = 53.7 ± 6.1 nM), EAAT2 (squares; IC50 = 59.0 ± 6.3 nM), and EAAT3 (circles; IC50 = 5.7 ± 0.5 nM; Vm = −60 mV). Each point represents between 3 and 30 measurements. (B) Representative traces showing the recovery of the steady-state transport current (normalized) from block of 2-FAA. Reciprocal of the single exponential fits gave rates of 0.031 ± 0.002 s−1, 0.028 ± 0.003 s−1, and 0.0040 ± 0.0002 s−1 for EAAT1, 2, and 3, respectively (n = 5).
2-FAA Unbinding and EAAT Subtype Selectivity.
In contrast to the blocking rate, the recovery from block following 2-FAA washout was independent of [2-FAA], as expected for a first-order unbinding reaction. The unblocking rate of 2-FAA was estimated from the least-squares fit of the recovery of the blocked current to its initial steady-state value following drug washout to the following equation:
where I(t) is the current amplitude at time t, I(ss) is the final steady-state current amplitude, and τ is the time constant. The mean value of 1/τ was 4.0 ± 0.2 × 10⁻³ s−1, not significantly different from the value of 3.8 × 10⁻³ s−1 determined from the extrapolated blocking rate data using the pseudo-first-order approximation (Fig. 2B). 2-FAA has been reported to exhibit selectivity for the neuronal glutamate transporter EAAT3 over the glial transporters EAAT1 and EAAT2 (11, 13). The 2-FAA concentration dependence of block of 3 μM l-Glu transporter current reflected these differences for EAAT1, 2, and 3, with IC50 values of 53.7 ± 6.1 nM, 59.0 ± 6.3 nM, and 5.7 ± 0.5 nM, respectively (Fig. 3A). It was not possible to accurately estimate the 2-FAA binding rates for the lower-affinity EAAT1 and EAAT2 transporters because the solution-exchange kinetics limited measurements at higher drug concentrations. However, the rates of recovery from block for EAAT1 and EAAT2 were measured and found to be seven- to eightfold faster than EAAT3 (3.1 ± 0.2 × 10⁻² s−1, 2.8 ± 0.3 × 10⁻² s−1, and 4.0 ± 0.2 × 10⁻³ s−1, respectively; Fig. 3B). After determination of Ki values from the IC50 for the respective transporters using Ki = IC50/(1 + [l-Glu]/Km) (Methods), binding rates for EAAT1 and EAAT2 were estimated to be 6 ± 1 × 10⁵ M−1s−1 and 5 ± 1 × 10⁵ M−1s−1, respectively. These values were similar to the slope measured from the EAAT3 blocking rate (4.4 × 10⁵ M−1s−1; Fig. 2B). Together, these data indicate that the selectivity for EAAT3 is a result of a slower unbinding rate of the drug from EAAT3. The affinity determination of 2-FAA for EAAT3 based on current block was also in good agreement with its block of d-[H3]aspartate uptake (Fig. S1).
Anomalous Unblocking Kinetics.
Unexpectedly, the rate of recovery of the transport current from 2-FAA block exhibited a clear dependence on the l-Glu concentration (Fig. 4A). The ability of l-Glu to accelerate the unbinding of 2-FAA is inconsistent with a first-order kinetic mechanism. There is no evidence for an allosteric glutamate binding site based on structural data (6), and the concentration dependence of steady-state transport also suggests that a single glutamate binding site exists on each subunit that displays no measurable cooperativity with other subunits (9). Computational docking of 2-FAA predicts overlap with the glutamate binding site (see below), and 2-FAA displays competitive inhibition of glutamate transport, as higher concentrations of l-Glu can overcome 2-FAA inhibition (Fig. S1). These data argue against an allosteric linkage that would account for the effect of l-Glu on the 2-FAA unbinding rate. An alternative mechanism is suggested by the fact that the three aspartate/glutamate binding sites line the aqueous cavity formed by the three subunits, which could form an effective diffusion barrier retarding the escape of ligand to the bulk medium. Following ligand unbinding, if the probability of rebinding to the same or other subunits in a trimer were significant relative to the probability of loss to the bulk medium, the presence of l-Glu would increase the apparent unbinding rate of 2-FAA because of competition for rebinding. This model predicts that in the presence of saturating l-Glu, the unblocking rate would approach the true first-order individual subunit unbinding rate because rebinding would be effectively blocked. Consistent with this prediction, the unblocking rate increased with [l-Glu] in a saturable manner, with an EC50 value of 7.4 ± 2.4 μM (Fig. 4B). In addition to increasing the recovery rate as glutamate concentration increased, the time course of unblock became better-fitted with a single exponential decay time constant (χ2 value was reduced from 17.4 at 3 μM to 0.7 at 100 μM l-glutamate; P < 0.001; Fig. 4A). Overall, these data are consistent with a significant probability of ligand rebinding, with reduction to a first-order kinetic scheme when 2-FAA rebinding is prevented by saturating l-Glu.
Fig. 4.

Recovery kinetics depend on [l-Glu]. (A) Recovery from 100 nM 2-FAA block of the normalized steady-state transport current induced by 3, 30, or 100 μM l-Glu. The experiment was performed as in Fig. 1C. Fractional block is normalized to the amplitude of the steady-state current in the presence of 2-FAA and the indicated concentration of l-Glu. The traces were fit to single exponential decay (dashed), and the goodness of fit was quantified by χ2 measurement (3 μM χ2 = 17.4, 30 μM χ2 = 2.2, 100 μM χ2 = 0.7; Vm = −60 mV). (B) Summary of the effect of [l-Glu] on recovery from block (rates determined by single exponential fits) showing a saturable concentration dependence.
Unblocking Kinetics in the Absence of Glutamate.
To further examine the mechanisms underlying the complex 2-FAA unblocking kinetics, recovery from block was measured in the absence of l-glutamate by taking advantage of the fact that nontransported blockers immobilize an Na+-dependent nonlinear capacitive charge movement in the absence of substrate (Fig. 5A) (14, 15). Consistent with earlier studies, the charge blocked by 2-FAA was conserved during equal and opposite voltage steps, and the charge recovery from block could be monitored by integration of the transient currents recorded at intervals following washout of 2-FAA (Fig. 5A Inset). In the same manner, the rate of onset of block was measured, which had a 2-FAA concentration dependence that was not significantly different from the blocking rate of the steady-state glutamate transport current (3.9 ± 0.6 × 10⁵ M−1s−1; Figs. 2 and 5 B and C). However, the unblocking rate was significantly slower than the unblocking rates measured in the presence of glutamate (P < 0.01). The difference in the kinetics of recovery from block in the presence and absence of 100 μM l-glutamate is graphically shown in Fig. 5D. The ratio of the recovery rates in the presence and absence of l-Glu indicates that 100 μM l-Glu accelerated the effective unbinding rate 6.9-fold (7.6 × 10⁻³ s−1/1.1 × 10−3 s−1). To investigate the l-Glu concentration dependence of the recovery from block, pulses of varying [l-Glu] were applied during the 2-FAA washout phase and the recovery of the charge movement was determined after l-Glu washout. The effect of l-Glu on the recovery rate of charge movements was saturable and concentration-dependent, with an EC50 of 10.5 ± 2.6 μM (Fig. 5D Inset).
Fig. 5.

The kinetics of 2-FAA (10 nM) block of transient currents. (A) Capacitive transient currents induced by steps from −80 to +20 mV. Representative traces show blocked currents (Icontrol − I2-FAA) recorded at 3, 15, and 20 min after washout. (Inset Top) Correlation of the 2-FAA-sensitive transient currents for on- and off-voltage steps demonstrating conservation of charge movements. (B) Representative data showing [2-FAA] dependence of rate of charge-movement block for a single oocyte. (C) Linear regression of block and unblock rates; slope = 3.85 ± 0.59 × 10⁵ M−1s−1; y intercept of 0.0012 ± 0.0004 s−1 (n = 3–7). (D) A comparison of the recovery from 100 nM 2-FAA block of the 100 μM l-Glu steady-state current (circles) and the Na+-dependent charge movements (squares). Both datasets are fit to a single exponential decay (τ = 131 s and 917 s, respectively). (Inset) The normalized [l-Glu] dependence of charge-movement recovery measured at 600 s, following a 270-s pulse of l-Glu at the indicated concentrations.
Kinetic Effects of Introducing R447C Mutant Subunits into a Trimer.
To test the possibility that the deviation from first-order unbinding kinetics involved ligand rebinding to neighboring subunits, wild-type EAAT3 subunits were coexpressed with EAAT3 R447C subunits. The R447C mutation targets a residue in the substrate binding site and changes the electrostatics of EAAT3 substrate recognition, converting acidic amino acid selectivity to neutral amino acid selectivity (7, 9, 16). Wild-type EAAT3 does not mediate measurable uptake or display currents in response to 100 μM l-alanine superfusion. In contrast, application of l-alanine induced saturable currents mediated by transporters composed of homotrimers of EAAT3 R447C mutant subunits, and these currents were insensitive to coapplication of 1 μM 2-FAA (Fig. 6A Inset). R447C transporters also mediated uptake of l-[H3]alanine that was similarly insensitive to 2-FAA (Fig. 6A). Furthermore, in the absence of alanine, 500 nM 2-FAA did not block any detectable capacitive charge movement in cells expressing R447C subunits. To examine the effect of changing the number of subunits capable of binding 2-FAA in a trimer, we coinjected oocytes with cRNA composed of 25% wild-type with 75% R447C mutant cRNAs. Assuming a random binomial distribution of subunits in trimers, the expected proportions of trimers containing 3, 2, 1, or 0 wild-type subunits is 0.253 (1.5%), 3⋅0.252⋅0.75 (14.1%), 3⋅0.25⋅0.752 (42.2%), and 0.753 (42.2%), respectively. Thus, of the trimers capable of binding 2-FAA, the majority (73%) have only one wild-type subunit, 24% have two wild-type subunits, and 3% have three wild-type subunits. As would be predicted if ligand rebinding to adjacent subunits occurred with a significant probability, coexpression of R447C with wild-type subunits increased the recovery rate of the transient charge movements in the wild-type subunits following washout of 100 nM 2-FAA (2.7 × 10⁻³ s−1 vs. 1.1 × 10⁻³ s−1, respectively, P < 0.01; Fig. 6B).
Fig. 6.

Incorporation of selectivity mutant R447C subunits into trimers increases the apparent off rate of 2-FAA. (A) Radiolabeled l-[3H]Ala (3 μM) uptake by hEAAT3 R447C is not blocked by 2-FAA (500 nM). (Inset) The hEAAT3 R447C l-Ala current is similarly not blocked by 2-FAA (1 μM). (B) The recovery from 2-FAA (100 nM) block of the Na+-dependent charge movements in oocytes expressing heterotrimers of hEAAT3 and hEAAT3 R447C at a ratio of 1:3 (closed circles; n = 15) compared with oocytes expressing homotrimers of hEAAT3 (data from Fig. 5D; n = 10). Data are fit to single exponential decay functions.
Computational Models of 2-FAA Interactions with EAAT3.
To model the structural and functional interaction of 2-FAA with EAAT3, we performed computational docking and developed a minimal kinetic scheme consistent with the data that explicitly incorporates diffusional effects of the aqueous cavity. 2-FAA and TBOA were computationally docked into a model of EAAT3 based on the GltPh-TBOA structure (17). The crystal structures of GltPh bound with l-aspartate or l-8-Br-TBOA (6) suggest that although both ligands electrostatically interact with an arginine residue in the position equivalent to R447 in EAAT3, l-aspartate is occluded by closure of the HP2 loop structure whereas the arylaspartate blocker prevents loop closure (Movie S1). The computational docking algorithm (Methods) predicted similar electrostatic interactions for aspartate, TBOA, and 2-FAA with EAAT3 R447 and D440, but hydrophobic interactions determining the planar ring orientation of 2-FAA differed significantly from those of TBOA (6). For 2-FAA, which displays approximately two orders of magnitude higher affinity for EAAT3 than TBOA, the most energetically favorable docked structures positioned the aromatic rings in a nonpolar groove lined by residues from TM7, TM8, and the HP2 loop, whereas the benzene ring of the crystal structure of TBOA is oriented toward the solvent-accessible tip of the HP2 loop (Fig. 7A). The ChemScore values from the GOLD docking algorithm for 2-FAA docking in the two positions were 22.4 and 18.9, respectively. A representation of a bound 2-FAA molecule showing the relative scale of the central cavity is shown in Fig. 7B.
Fig. 7.

Computational modeling of 2-FAA interactions with EAAT3. (A) The fluorene group of docked 2-FAA (orange) interacts with polar (green) and nonpolar (gray) residues in TM7, TM8, and in the HP2 loop; the R447 surface charge is highlighted with blue. TBOA (yellow) orientation from the GltPh crystal structure overlaid. (B) Surface rendering of EAAT3 model showing central cavity, blocker, and selectivity site. (C) Kinetic scheme incorporating a central aqueous cavity that acts as a diffusion barrier. The black dots in the model represent a molecule of 2-FAA either bound to a subunit (Dn) or centrally localized to the aqueous cavity (Dn*) of the EAAT3 trimer. (D) Blocking rate and recovery from block data of the Na+-charge movements for 3, 10, and 30 nM concentrations of 2-FAA (open circles) fit to the model (Fig. S2). (Inset) Recovery from 10 nM 2-FAA block comparing the goodness of fit for the first-order reaction scheme from equation 1 (dashed line) with the diffusion barrier model (solid line). (E) Recovery from 10 nM 2-FAA block showing model best fits (95% CI) to the data in the absence (b1 = 0.0078–0.0080 s−1; f2/b2 = 3.04–3.12) or presence of 100 μM l-glutamate (b1 = 0.0078–0.0080 s−1; f2/b2 = 0.04–0.05).
A system of ordinary differential equations was derived for a minimal kinetic model that incorporates an extra state representing unbound 2-FAA occupying the central aqueous cavity. In this model (Fig. 7C), the cavity forms a significant diffusion barrier and a molecule within it can either bind to a transporter subunit at rate f2, or it can exit the cavity to the bulk medium with a rate b2 (Fig. 7C). The value of the intrinsic subunit unbinding rate, b1, was fixed to the unblocking rate measured in saturating concentrations of l-Glu (0.0076 s−1; Fig. 3C). Using the Simplex algorithm (MATLAB Optimization Toolbox; The MathWorks), this model was capable of fitting the data well (Fig. 7D). However, the parameters b2 and f2, the rates for the two routes of ligand exit from the central cavity, could not be reliably defined as independent variables and were instead fitted as a ratio after model reduction using the boundary function method (18) (Fig. S2). The block and unblock data were well-fitted by the model with a ratio f2/b2 = 2.91 [Fig. 7D; 95% confidence interval (CI) 2.80–3.02], suggesting a molecule once in the cavity is more likely to bind to a subunit than be lost to the bulk medium. The model also produced good fits for the unblocking data in both the absence and presence of saturating l-Glu, in contrast to the kinetic model previously assumed to apply (Fig. 7E).
Discussion
Structural and Functional Features of the Aqueous Cavity and Ligand Binding Sites.
A notable structural feature of the trimeric glutamate transporter family is the central cavity formed by the junction of the three wedged-shaped subunits. Because the surface of this water-filled cavity is predominately hydrophilic and it dips approximately halfway into the plane of the membrane, it is possible that it serves to lower the energy barrier for glutamate and cotransported ions to cross the lipid bilayer (5, 19). An additional possible role in modifying ligand diffusion is suggested by the kinetics of 2-FAA interactions with EAAT3 described here. Computational docking results with EAAT3 suggest that 2-FAA interacts specifically with the aspartate/glutamate binding site, although some significant differences with the crystal structure of GltPh complexed with the arylaspartate blocker TBOA were predicted (6). An alteration of the orientation of the tricyclic aromatic group was required to accommodate the 2-FAA molecule in the ligand binding site. This predicted docking orientation preserved the same electrostatic interactions observed in the TBOA complex, but the tricyclic fluorenyl group of 2-FAA fit into a novel hydrophobic groove between TMD7 and the HP2 loop of the transporter (Fig. 7A).
The unique disposition of the three ligand binding sites within the central aqueous cavity suggested the possibility that the cavity might affect the kinetics of solute interaction with the transporters, and we sought to explore this possibility using a perturbation approach (20–25). The slow on and off rates for 2-FAA block of EAAT currents facilitated measurement of the reaction kinetics using a voltage clamp with a standard fast-flow intracellular recording chamber. The steady-state and pre-steady-state data confirm the high affinity and relative selectivity of 2-FAA for EAAT3 (11). Binding rates of 2-FAA at all three EAATs were similar and, as predicted by pseudo-first-order blocking kinetics, the lower equilibrium binding constant of 2-FAA for EAAT3 was proportional to the slower rate of unblock observed at EAAT3 compared with EAAT1 and 2. However, experiments designed to measure first-order unbinding kinetics by rapid washout of blocker led to three unexpected observations that were fundamentally inconsistent with the previously assumed kinetic mechanism. First, the rate of recovery from 2-FAA unblock was increased approximately sevenfold by l-glutamate in a concentration-dependent and saturable manner. Second, the recovery from block following washout of 2-FAA was well-fitted by a single exponential decay with saturating concentrations of glutamate present, but at lower glutamate concentrations the decay was clearly a multiexponential process. Third, trimers formed by coassembly of wild-type and mutant subunits that do not bind ligand exhibited an increased rate of unblock. These behaviors are inconsistent with immediate diffusional loss to the bulk medium after ligand unbinds, suggesting the possibility that the aqueous cavity presents a significant diffusion barrier. This effect does not involve intertrimer interactions because the unblocking kinetics were independent of transporter expression level. The simplest kinetic model that fits the data features a distinct state in which a ligand molecule occupies the aqueous cavity with a lifetime governed by rates f2 and b2, the rates of binding to a subunit and release to the bulk medium, respectively (Fig. 7C). As the ratio of f2 to b2 approaches zero, the model collapses to a pseudo-first-order kinetic scheme. The data and model suggest that the steric and electrostatic features of the cavity and the opposing two binding sites together effectively reduce b2, the diffusional loss of ligand following subunit unbinding. The sevenfold difference in the rate of recovery from 2-FAA block in the absence and presence of saturating l-glutamate indicates a >80% probability of 2-FAA rebinding to the same or other subunits in a trimer following unbinding in the absence of glutamate. Coexpression of nonbinding R447C subunits increased the rate of unblock approximately twofold, significantly less than the sevenfold effect of saturating l-Glu, suggesting that whereas the electrostatics of the binding sites lining the aqueous cavity contribute to retarding ligand loss, steric effects of the cavity itself appear to play a dominant role.
Implications for Substrate Transport.
One measure of the efficiency of membrane transport under physiological conditions is the probability that following binding, a molecule of substrate will be transported to the intracellular space before unbinding to the extracellular space. Concentration jump studies with glutamate transporters in outside-out patches suggest that following binding of glutamate, there is a significant (≥∼0.5) probability of unbinding rather than membrane translocation (2, 22). In general, the probability of unbinding from the initial bound state reflects a balance between the opposing microscopic kinetic requirements for a rapid cycling rate and a high capture efficiency, because a very low unbinding rate reflects an energetically favorable and stable complex, which would tend to slow the turnover rate. A diffusion barrier in the form of an aqueous cavity as proposed here would not slow the microscopic subunit unbinding rate but would result in a kinetic advantage by slowing the effective loss of substrate to the bulk space. At saturating substrate concentrations this advantage will be insignificant, because substrate lost to the bulk would rapidly be replaced by diffusion. However, during the rapid decay of synaptic transmitter transients, this could provide a mechanism to modulate the buffering kinetics (26). In addition, at low ambient substrate concentrations, the advantage of such a diffusion barrier could be significant. In mammalian brain, the ion gradients coupled to glutamate flux can theoretically support low-nanomolar extracellular glutamate concentrations at equilibrium (3, 4). Measurements of basal glutamate receptor activity in hippocampus indicate an ambient glutamate concentration of 25 nM (27), which is within the limits of the transporters’ equilibrium thermodynamics but approximately three orders of magnitude below their Km values. Under these steady-state conditions, the transporters are working at a small fraction of their maximal turnover rates in the face of robust tonic glutamate release (28), suggesting that an increase in capture efficiency could be an important factor in extending the dynamic range of the transporters to prevent tonic receptor activation. It is also tempting to speculate that the early evolutionary appearance of this quaternary feature in transporters of archaeal organisms might have conferred an advantage by increasing efficiency in scavenging dilute amino acids in an environment where substrate diffusion could be rate-limiting.
Methods
Electrophysiology and Radiolabel Uptake.
Approximately 50 ng of human EAAT1, EAAT2, or EAAT3 cRNA was microinjected into stage V–VI Xenopus oocytes and recordings were made 3–5 d later. For coexpression of wild-type and mutant R447C transporter subunits, plasmid DNA was optically quantified, combined, and then linearized and transcribed. The magnitude of oocyte currents elicited by l-Glu or l-Ala application was consistent with binomial dilution ratios (16). Recording solution (frog Ringer) contained 96 mM NaCl, 2 mM KCl, 1 mM MgCl2, 1.8 mM CaCl2, and 5 mM Hepes (pH 7.4). Microelectrodes were pulled to resistances between 1 and 3 MΩ filled with 3 M KCl. Data were recorded with Molecular Devices amplifiers and analog–digital converters interfaced to PC or Macintosh computers. Data were analyzed offline with Axograph X (v. 1.0.8, www.axograph.com) and KaleidaGraph (v. 3.6; Synergy) software. A 3 × 3 × 20-mm recording chamber was fashioned from perspex that allowed high laminar flow rates with continuous perfusion at 16–20 mL/min and rapid valve control to change solution. Solution exchange of the bath was monitored by currents induced in response to solution change to hypertonic Ringer (supplemented with 20 mM KCl) or to 3 μM l-glutamate in normal Ringer. Time constants for the solution exchange were estimated by fitting current amplitude changes to the expression At = A0⋅e−t/τ following solution exchange. Concentrations of drug used for blocking rate measurements were less than 300 nM, resulting in time constants that were at least 10-fold greater than the time constant of the solution exchange. Ki values were estimated from the IC50 for the respective transporters using a modified form of the Cheng–Prusoff equation: Ki = IC50/(1 + [l-Glu]/Km), assuming a Km value for l-Glu of 44 μM (9). Transporter-associated Na+-dependent charge movements were recorded as in ref. 14. Uptake of l-[3H]Ala or d-[3H]Asp into oocytes expressing EAAT3 was measured following preequilibration in Ringer containing the indicated concentration of 2-FAA for 5 min before being transferred to wells containing radiolabeled substrates with the same concentration of 2-FAA. Oocytes were incubated in radiolabel for 5 min and then washed three times in cold Ringer and lysed, and radioactivity was measured (14).
Computational Modeling.
Human EAAT3 sequence (GenBank; http://www.ncbi.nlm.nih.gov) was aligned with the Protein Data Bank (PDB) sequences for GltPh (PDB ID code 2NWW) (5, 6). The EAAT3 homology model was constructed by threading the aligned sequence along 2NWW coordinates using the SwissProt server (http://swissmodel.expasy.org/). The resulting model was optimized through local energy minimizations of regions with high steric and electrostatic interference using the AMBER7 force field in the Tripos SYBYL 8.0 platform. Representations of 2-FAA and TBOA were docked using GOLD v. 3.0.1 (http://www.ccdc.cam.ac.uk) into the EAAT3 model and evaluated using the ChemScore scoring function. Each of the top 30 poses for each of three separate docking runs were evaluated for their capacity to hydrogen bond with EAAT3 R447 and D444 residues. Poses with the lowest estimated ΔG values determined by ChemScore were incorporated into the homology model and visualized using PyMOL v. 1.3 (www.pymol.org).
Kinetic Modeling.
Kinetic models for glutamate transporter block were formulated as systems of ordinary differential equations for fractions of various transporter states and species. Model simulations and fitting of model solution to experimental data with the aim of identifying model parameters were performed using MATLAB software package (v. 7.9.0.529) and MATLAB Optimization and Statistics Toolboxes on a Macintosh computer (The MathWorks). Parameter estimates are given with 95% CI. The boundary function method (18) was used for asymptotic model reductions. In particular, the central-cavity barrier model originally containing seven differential equations and four parameters was reduced to a simpler model containing four differential equations and three parameters using this method, with the assumption that the magnitudes of the diffusional rates f2 and b2 exceeded other rates by >100-fold. The solution of the reduced model was a good approximation of the original model solution with the parameter values estimated from experimental data.
Synthesis of 2-FAA.
N-tBoc-l-aspartate (0.936 g, 4.35 mmol) was dissolved in acetic anhydride (20 mL, 20× wt). The solution was stirred for 6 h at 60 °C. The acetic anhydride was removed in vacuo and consecutive washes with toluene (2 × 10 mL) and hexanes (2 × 10 mL) followed, leaving N-tBoc-l-aspartic anhydride as previously described (29). The crude white solid was used without further purification for nucleophilic addition to the anhydride, similar to the method previously reported (30). The N-tBoc-l-aspartic anhydride was dissolved in anhydrous DMSO (80 mL, ∼0.05 M) followed by addition of 2-aminofluorene (0.684 g, 90%, 0.85 eq), and the solution was stirred at 60 °C overnight. Upon completion as determined by TLC, the reaction solution was diluted with brine (200 mL) and the pH was adjusted to ∼2 by addition of concentrated H3PO4. The aqueous solution was then extracted with CH2Cl2 (400 mL) and washed with brine (6 × 250 mL aliquots) adjusted to pH ∼2 to remove remaining DMSO. The organic layer was then dried over MgSO4, filtered, and concentrated to a dark oil. This oil was separated by silica gel (95% CH2Cl2/4% methanol/1% acetic acid), collecting N-tBoc-2-aminofluorenyl-l-aspartylamide at Rf = 0.15, which was subsequently concentrated to a white solid. The isolated N-tBoc-2-fluorenyl-l-aspartylamide (0.697g, 1.758 mmol) was dissolved in 1:1 CH2Cl2:TFA (6 mL) and allowed to stir at room temperature for 1 h. The solution was aspirated with compressed air until dry, washed three times with 10 mL CH2Cl2, filtered, and again dried. The solid residue was then resuspended into 0.01 M HCl (1.2 eq) via sonication, frozen, and placed in a lyophilizer until dry leaving an off-white solid, 2-fluorenyl-aspartylamide (2-FAA; 0.555 g, 1.67 mmol; Fig. S3).
Supplementary Material
Acknowledgments
This work was supported by National Institutes of Health Grants R01 NS33270 and P30 NS055022.
Footnotes
The authors declare no conflict of interest.
This article is a PNAS Direct Submission.
This article contains supporting information online at www.pnas.org/lookup/suppl/doi:10.1073/pnas.1108785108/-/DCSupplemental.
References
- 1.Gesemann M, Lesslauer A, Maurer CM, Schönthaler HB, Neuhauss SCF. Phylogenetic analysis of the vertebrate excitatory/neutral amino acid transporter (SLC1/EAAT) family reveals lineage specific subfamilies. BMC Evol Biol. 2010;10:117. doi: 10.1186/1471-2148-10-117. [DOI] [PMC free article] [PubMed] [Google Scholar]
- 2.Tzingounis AV, Wadiche JI. Glutamate transporters: Confining runaway excitation by shaping synaptic transmission. Nat Rev Neurosci. 2007;8:935–947. doi: 10.1038/nrn2274. [DOI] [PubMed] [Google Scholar]
- 3.Zerangue N, Kavanaugh MP. Flux coupling in a neuronal glutamate transporter. Nature. 1996;383:634–637. doi: 10.1038/383634a0. [DOI] [PubMed] [Google Scholar]
- 4.Levy LM, Warr O, Attwell D. Stoichiometry of the glial glutamate transporter GLT-1 expressed inducibly in a Chinese hamster ovary cell line selected for low endogenous Na+-dependent glutamate uptake. J Neurosci. 1998;18:9620–9628. doi: 10.1523/JNEUROSCI.18-23-09620.1998. [DOI] [PMC free article] [PubMed] [Google Scholar]
- 5.Yernool D, Boudker O, Jin Y, Gouaux E. Structure of a glutamate transporter homologue from Pyrococcus horikoshii. Nature. 2004;431:811–818. doi: 10.1038/nature03018. [DOI] [PubMed] [Google Scholar]
- 6.Boudker O, Ryan RM, Yernool D, Shimamoto K, Gouaux E. Coupling substrate and ion binding to extracellular gate of a sodium-dependent aspartate transporter. Nature. 2007;445:387–393. doi: 10.1038/nature05455. [DOI] [PubMed] [Google Scholar]
- 7.Grewer C, et al. Individual subunits of the glutamate transporter EAAC1 homotrimer function independently of each other. Biochemistry. 2005;44:11913–11923. doi: 10.1021/bi050987n. [DOI] [PMC free article] [PubMed] [Google Scholar]
- 8.Koch HP, Brown RL, Larsson HP. The glutamate-activated anion conductance in excitatory amino acid transporters is gated independently by the individual subunits. J Neurosci. 2007;27:2943–2947. doi: 10.1523/JNEUROSCI.0118-07.2007. [DOI] [PMC free article] [PubMed] [Google Scholar]
- 9.Leary GP, Stone EF, Holley DC, Kavanaugh MP. The glutamate and chloride permeation pathways are colocalized in individual neuronal glutamate transporter subunits. J Neurosci. 2007;27:2938–2942. doi: 10.1523/JNEUROSCI.4851-06.2007. [DOI] [PMC free article] [PubMed] [Google Scholar]
- 10.Reyes N, Ginter C, Boudker O. Transport mechanism of a bacterial homologue of glutamate transporters. Nature. 2009;462:880–885. doi: 10.1038/nature08616. [DOI] [PMC free article] [PubMed] [Google Scholar]
- 11.Coon TR, et al. Design and synthesis of inhibitors of the neuronal glutamate transporter EAAT3. Soc Neurosci Abstr. 2004 168.10 (abstr) [Google Scholar]
- 12.Shimamoto K, et al. Characterization of novel L-threo-β-benzyloxyaspartate derivatives, potent blockers of the glutamate transporters. Mol Pharmacol. 2004;65:1008–1015. doi: 10.1124/mol.65.4.1008. [DOI] [PubMed] [Google Scholar]
- 13.Dunlop J, Butera JA. Ligands targeting the excitatory amino acid transporters (EAATs) Curr Top Med Chem. 2006;6:1897–1906. doi: 10.2174/156802606778249829. [DOI] [PubMed] [Google Scholar]
- 14.Wadiche JI, Arriza JL, Amara SG, Kavanaugh MP. Kinetics of a human glutamate transporter. Neuron. 1995;14:1019–1027. doi: 10.1016/0896-6273(95)90340-2. [DOI] [PubMed] [Google Scholar]
- 15.Watzke N, Bamberg E, Grewer C. Early intermediates in the transport cycle of the neuronal excitatory amino acid carrier EAAC1. J Gen Physiol. 2001;117:547–562. doi: 10.1085/jgp.117.6.547. [DOI] [PMC free article] [PubMed] [Google Scholar]
- 16.Bendahan A, Armon A, Madani N, Kavanaugh MP, Kanner BI. Arginine 447 plays a pivotal role in substrate interactions in a neuronal glutamate transporter. J Biol Chem. 2000;275:37436–37442. doi: 10.1074/jbc.M006536200. [DOI] [PubMed] [Google Scholar]
- 17.Holley DC, Kavanaugh MP. Interactions of alkali cations with glutamate transporters. Philos Trans R Soc Lond B Biol Sci. 2009;364:155–161. doi: 10.1098/rstb.2008.0246. [DOI] [PMC free article] [PubMed] [Google Scholar]
- 18.Vasil'eva AB, Butuzov VF, Kalachev LV. The Boundary Function Method for Singular Perturbation Problems. Philadephia: SIAM; 1995. [Google Scholar]
- 19.Gouaux E, Mackinnon R. Principles of selective ion transport in channels and pumps. Science. 2005;310:1461–1465. doi: 10.1126/science.1113666. [DOI] [PubMed] [Google Scholar]
- 20.Grewer C, Watzke N, Wiessner M, Rauen T. Glutamate translocation of the neuronal glutamate transporter EAAC1 occurs within milliseconds. Proc Natl Acad Sci USA. 2000;97:9706–9711. doi: 10.1073/pnas.160170397. [DOI] [PMC free article] [PubMed] [Google Scholar]
- 21.Bergles DE, Jahr CE. Synaptic activation of glutamate transporters in hippocampal astrocytes. Neuron. 1997;19:1297–1308. doi: 10.1016/s0896-6273(00)80420-1. [DOI] [PubMed] [Google Scholar]
- 22.Wadiche JI, Kavanaugh MP. Macroscopic and microscopic properties of a cloned glutamate transporter/chloride channel. J Neurosci. 1998;18:7650–7661. doi: 10.1523/JNEUROSCI.18-19-07650.1998. [DOI] [PMC free article] [PubMed] [Google Scholar]
- 23.Otis TS, Jahr CE. Anion currents and predicted glutamate flux through a neuronal glutamate transporter. J Neurosci. 1998;18:7099–7110. doi: 10.1523/JNEUROSCI.18-18-07099.1998. [DOI] [PMC free article] [PubMed] [Google Scholar]
- 24.Otis TS, Kavanaugh MP. Isolation of current components and partial reaction cycles in the glial glutamate transporter EAAT2. J Neurosci. 2000;20:2749–2757. doi: 10.1523/JNEUROSCI.20-08-02749.2000. [DOI] [PMC free article] [PubMed] [Google Scholar]
- 25.Bergles DE, Tzingounis AV, Jahr CE. Comparison of coupled and uncoupled currents during glutamate uptake by GLT-1 transporters. J Neurosci. 2002;22:10153–10162. doi: 10.1523/JNEUROSCI.22-23-10153.2002. [DOI] [PMC free article] [PubMed] [Google Scholar]
- 26.Diamond JS, Jahr CE. Transporters buffer synaptically released glutamate on a submillisecond time scale. J Neurosci. 1997;17:4672–4687. doi: 10.1523/JNEUROSCI.17-12-04672.1997. [DOI] [PMC free article] [PubMed] [Google Scholar]
- 27.Herman MA, Jahr CE. Extracellular glutamate concentration in hippocampal slice. J Neurosci. 2007;27:9736–9741. doi: 10.1523/JNEUROSCI.3009-07.2007. [DOI] [PMC free article] [PubMed] [Google Scholar]
- 28.Jabaudon D, et al. Inhibition of uptake unmasks rapid extracellular turnover of glutamate of nonvesicular origin. Proc Natl Acad Sci USA. 1999;96:8733–8738. doi: 10.1073/pnas.96.15.8733. [DOI] [PMC free article] [PubMed] [Google Scholar]
- 29.Witiak DT, Muhi-Eldeen Z, Mahishi N, Sethi OP, Gerald MC. L(S)- and D(R)-3-amino-1-phenylpyrrolidines. Stereoselective antagonists for histamine and acetylcholine receptors in vitro. J Med Chem. 1971;14:24–30. doi: 10.1021/jm00283a006. [DOI] [PubMed] [Google Scholar]
- 30.Huang X, Luo X, Roupioz Y, Keillor JW. Controlled regioselective anilide formation from aspartic and glutamic acid anhydrides. J Org Chem. 1997;62:8821–8825. [Google Scholar]
Associated Data
This section collects any data citations, data availability statements, or supplementary materials included in this article.