

Abstract
The study of recent natural selection in human populations has important applications to human history and medicine. Positive natural selection drives the increase in beneficial alleles and plays a role in explaining diversity across human populations. By discovering traits subject to positive selection, we can better understand the population level response to environmental pressures including infectious disease. Our study examines unusual population differentiation between three large data sets to detect natural selection. The populations examined, African Americans, Nigerians, and Gambians, are genetically close to one another (FST < 0.01 for all pairs), allowing us to detect selection even with moderate changes in allele frequency. We also develop a tree-based method to pinpoint the population in which selection occurred, incorporating information across populations. Our genome-wide significant results corroborate loci previously reported to be under selection in Africans including HBB and CD36. At the HLA locus on chromosome 6, results suggest the existence of multiple, independent targets of population-specific selective pressure. In addition, we report a genome-wide significant (p = 1.36 × 10⁻¹¹) signal of selection in the prostate stem cell antigen (PSCA) gene. The most significantly differentiated marker in our analysis, rs2920283, is highly differentiated in both Africa and East Asia and has prior genome-wide significant associations to bladder and gastric cancers.
Introduction
The study of recent natural selection in humans has important applications to human history and medicine. Previous studies have reported selection at loci associated with susceptibility to falciparum malaria,1–3 vivax malaria,4 Lassa virus,5 end-stage kidney disease,6 tuberculosis, and HIV/AIDS.7–9 Indeed, it has been suggested that signals of selection at malaria loci are “only the tip of the iceberg”10. Signals of selection fit into three main categories: unusually long, recent haplotypes; deviations from the expected allele frequency spectrum; and unusual population differentiation.11 Signals of the first two types are only expected under the selective sweep model.1,12 This model assumes that a novel or very rare variant is subject to selection and then sweeps to high frequency and carryies hitchhiking variants and long haplotypes with it. If, however, selection acts on a common or standing variant, as has been suggested in recent studies,13–15 these tests would be unlikely to uncover a signal. Therefore, a key advantage of our approach, based on unusual population differentiation, is the ability to detect selection on standing variation.16 Additionally, although other approaches based on population differentiation simply report top-ranked loci, our study of selection allows for the assessment of genome-wide significance.
Many prior studies of unusual population differentiation have focused on comparing continental populations.2,17–19 Because of large genetic distances (FST),20 these studies might be better suited to understanding population history rather than to detecting selection.21 Studies of population differentiation designed to detect selection are maximally powered when they compare closely related populations that have large effective population size with data from a large number of individuals (>1/FST). This approach has been applied genome wide to comparisons of closely related populations within Europe and within East Asia22,23 and to candidate loci of closely related populations within Africa.24 Now, the availability of genome-wide data from more than 12,000 individuals of African-American, Nigerian, and Gambian ancestry makes it possible to proceed with genome-wide application of this approach in Africa.
To accomplish this analysis, we have developed a tree-based method that incorporates information from all three populations in order to increase power to detect selection and enable resolution of the population subject to selection. However, both African-American25 and Gambian26,27 populations have significant European-related admixtures. Although it is possible to perform a study of population differentiation between admixed populations, our method minimizes FST and maximizes power by accounting for this admixture. Additionally, we sought to increase coverage of selected loci by performing imputation using a combined reference panel of Europeans (CEU [residents with Northern and Western European ancestry from the CEPH collection]) and Yoruba (YRI [Yoruba in Ibadan, Nigeria]) from the HapMap 3 Project.28 We note that our method bears similarity to the locus-specific branch length (LSBL)29 method, though our statistic follows a well-defined distribution under the null model of no selection. This allows for the evaluation of genome-wide significance as opposed to the ranking of loci produced by most genome-wide scans for selection.30
We applied this approach and detected genome-wide significant signals at previously established targets of selection in CD3631 [MIM 173510], HBB24,32,33 [MIM 141900]—both reported targets of selection due to malaria—and HLA7,34,35 [MIM 142800], which has a major role in immunity, including in malaria resistance.10,33 In addition, by combining evidence of extreme population differentiation within Africa and within East Asia, we have identified a genome-wide significant locus under selection in the prostate stem cell antigen gene (PSCA) [MIM 602470] (p = 1.36 × 10⁻¹¹). The most significantly differentiated marker at this locus, rs2920283, is also highly differentiated in our analysis of East Asian populations. This SNP is tightly linked to a nonsynonymous coding variant that has previous genome-wide significant associations to bladder36 and gastric cancers.37 The PSCA markers are common in all continental populations, indicating a likely instance of selection on standing variation.
In addition, at the HLA locus we observe multiple signals of differentiation. Although selection at HLA is unsurprising given its role in immunity and many disease associations,7 we note that several markers that are highly differentiated on one branch of the tree do not show significant differentiation on other branches. This evidence is consistent with multiple, population-specific selective pressures at the HLA locus.
Subjects and Methods
Candidate Gene Association Resource Data Set
Our main African-American data set consists of 6209 unrelated individuals genotyped on the Affymetrix 6.0 array as previously described.38 These individuals were genotyped as part of the Atherosclerosis Risk In Communities (ARIC), Coronary Artery Risk Development in Young Adults (CARDIA), the Cleveland Family Study (CFS), the Jackson Heart Study (JHS) or the Multi-Ethnic Study of Atherosclerosis (MESA) cohorts in the Candidate Gene Association Resource (CARe) consortium.39 The ARIC study is a prospective population-based study of atherosclerosis and cardiovascular diseases in 15,792 men and women, including 11,478 non-Hispanic whites and 4,314 African Americans (AA), drawn from four U.S. communities (suburban Minneapolis, MN; Washington County, MD; Forsyth County, NC, and Jackson, MI). The CARDIA study is a prospective, multicenter investigation of the natural history and etiology of cardiovascular disease in AA and whites 18–30 years of age at the time of initial examination. The initial examination included 5115 participants selectively recruited to represent proportionate racial, gender, age, and education groups from four U.S. communities: Birmingham, AL; Chicago, IL; Minneapolis, MN; and Oakland, CA. CFS is a family-based, longitudinal study designed to characterize the genetic and nongenetic risk factors for sleep apnea. In total, 2534 individuals (46% AA) from 352 families were studied on up to four occasions over a period of 16 years (1990–2006). JHS is a prospective population-based study that seeks the causes of the high prevalence of common complex diseases, including cardiovascular disease, type-2 diabetes, obesity, chronic kidney disease, and stroke, among AA in the Jackson, MI, metropolitan area. MESA is a study of the characteristics of subclinical cardiovascular disease (disease detected noninvasively before it has produced clinical signs and symptoms) and the risk factors that predict progression to clinically overt cardiovascular disease or progression of the subclinical disease. The CARe project has been approved by the Committee on the Use of Humans as Experimental Subjects (COUHES) of the MIT, and by the institutional review boards of each of the nine parent cohorts.
Other Data Sets
Additionally, we analyze 756 Nigerian individuals genotyped on the Affymetrix 6.0 array as well as a Gambian data set of 2946 individuals from the WTCCC-TB study27 genotyped on the Affymetrix 500k array. For quality control, we have utilized separate data sets of 757 AA genotyped on the Affymetrix 6.0 array and 2556 Gambians genotyped on the Affymetrix 500k array as part of the MalariaGen study.26 Finally, to account for European-related admixture we used a data set of 1178 European individuals genotyped on the Affymetrix 6.0 array. We also analyzed genome-wide data from the International HapMap 3 Project.28 For our analysis, we considered only unrelated individuals. The population panel consisted of 113 Yoruba from Ibadan, Nigeria (YRI), 112 individuals of northwestern European ancestry (CEU [Utah residents with Northern and Western European ancestry from the Centre d'Etude du Polymorphisme Humain collection]), 84 Han Chinese from Beijing (CHB), 85 Chinese in metropolitan Denver, CO (CHD), 86 Japanese from Tokyo (JPT), 88 Toscans from Italy (TSI), and 90 Luhya from Webuye, Kenya (LWK). We analyzed all autosomal SNPs in our pairwise comparisons. Finally, for the purpose of illustration of population differentiation on a global scale at loci of interest, we examined allele frequencies in the 52 distinct ethnic groups genotyped as part of the Human Genome Diversity Project.40 Appropriate sample consent and institutional review board approval was obtained in all cases.
Quality Control
In order to limit the possibility that assay artifacts in our data cause spurious signals of selection,41 we compared each of our large data sets with an independent data set that genotyped individuals drawn from the same population. That is, we compared our primary African-American data set with an African-American data set from a separate study and did likewise for our Nigerian and Gambian data sets. We then excluded all markers that showed significant (p < 10−6) population differentiation between the two data sets. This is a conservative approach because it excludes markers with assay artifacts in either of the two data sets. In order to further eliminate assay artifacts, we only reported loci that contained at least two SNPs with p < 10−6 within 1 Mb of each other.
Both our pairwise- and tree-based methods depend upon an assumption of a normal distribution of allele frequency differences.42 This assumption is not likely to hold when alleles are very rare (see Figure S1, available online). Therefore, SNPs with an average Minor Allele Frequency (MAF) < 5% were excluded from reported results.
Two Populations
Our approach to detecting unusual population differentiation over a set of SNPs genotyped in a pair of populations proceeds in two steps. The first step is to estimate the degree of differentiation between the two populations. Wright's FST is a measure of genetic drift and can be used for this purpose. Let represent the allele frequency difference at SNPS between population 1 and population 2.
If population 1 and 2 are identical then Ds is approximately normally distributed with a mean of 0 and a variance of
We note that this variance is only becasue we used finite size samples. Here, Ni is the sample size for population i and might be a simple or sample-size-weighted average of and . If populations 1 and 2 are genetically differentiated, then Ds is again approximately normally distributed with a mean of 0 and a variance of
In this formulation both genetic drift and sampling error provide components of the variance. From this, we can estimate FST using a method of moments. We note that this is not the standard estimator of FST and was chosen because it guarantees a correct statistic in expectation () when evaluated as below.
Although it is possible to test for significant allele frequency differences without accounting for FST by using a χ2 test based on a 2 × 2 contingency table,23,43 this is not a test for selection.22 In particular, this approach tests a null hypothesis that the allele frequency is identical in the two populations. This implies that neither drift nor selection has taken place. However, when comparing genetically differentiated populations, we expect differences to accrue because of genetic drift and should not be surprised to see this hypothesis rejected. On the other hand, a test for population differences such as ours can test the null hypothesis that the observed allele frequency difference can be accounted for by drift alone. This removes drift as an alternate explanation and gives stronger evidence of a selective event. To illustrate this, we reexamined the most highly differentiated marker in a recent study of East Asians.23 This marker has a p value of 2.4 × 10⁻¹³ for the null hypothesis of neither drift nor selection, and a p value of 1.32 × 10⁻⁸ under our test for no selection. Although this continues to have genome-wide significance, less differentiated markers reported in this type of analysis might not be convincing cases of selection.
The second step in detecting selection using two populations is to evaluate a statistic for population differentiation at every available marker. Our statistic is based upon a likelihood ratio test. The null model assumes that the observed allele frequency differences are solely due to genetic drift and sampling error
The causal model allows an arbitrary amount of differentiation between the populations to be attributed to selection
where SEL denotes the allele frequency difference attributed to selection. This gives a likelihood ratio test as below
Maximizing over SEL gives SEL = –Ds, then we have
which is a 1 degree of freedom (d.f.) statistic. In order to verify that this statistic gave the correct null distribution, we performed neutral simulations (see Table S1). Additionally, we sought to investigate the power of such a test to detect selection when one of the two populations was under selection or when both populations were under selection with differing selection coefficients. Our simulations (see Table S2) show that, as expected, this test is highly sensitive to the difference between the selection coefficients in the two populations. This indicates that maximal power is obtained when comparing closely related populations subject to differing environmental pressures.
Finally, we note that a normal distribution is an approximation of the true distribution of allele frequency differences under neutral drift. We evaluated the validity of this approximation by comparing the cumulative distribution function under the normal approximation to the distribution obtained using Kimura theory (see Figure S1). Whereas the normal approximation breaks down for rare variation (MAF < 0.05) and high genetic drift (FST > 0.01), it appears reasonable for the range of allele frequencies and genetic drift under consideration here.
Multiple Populations
We can generalize the analysis of unusual allele frequency differentiation between a pair of populations to multiple populations in an unrooted tree. That is, we can consider each population to be a leaf-node in an unrooted tree that describes the patterns of population divergence without knowing the order of divergence events in time. Then, if we can reconstruct the tree from the observed populations, we can begin the work of detecting selection in the tree. This approach presents a variety of challenges relative to the pairwise test.
We must select an unrooted tree topology, estimate the branch lengths, and develop a statistic to use on the resulting tree. As the number of populations increases, each of these steps becomes increasingly difficult. Indeed, the number of unrooted tree topologies over n populations is (2n–5)!/[2(n-3)(n–3)!], and this does not begin to consider the possible branch length assignments to each of these topologies. Although the literature on tree estimation in the context of multiple populations is relatively well developed,44 we consider the simpler case of n = 3 for this study. This allows us to analyze each of these problems in discrete steps. For larger n, the analysis might have to be combined.
Given n = 3, there is a single, star-shaped topology for an unrooted tree. In order to estimate the branch lengths, we utilized a pseudolikelihood model considering all pairs of populations involved.
In our approach we consider pairwise differences between each pair of populations. We can define a pairwise variance, , where the FST between the populations is represented by a sum of the branch lengths and . If we assume independence of the pairwise differences, this gives a pseudolikelihood of
We used gradient ascent to find a local maximum likelihood estimate for over all SNPs s. This gives results that closely recapitulate previous estimates of FST. Once the branch lengths are estimated, we can estimate the allele frequency at our central node using a branch length weighted average
Given an estimate of the allele frequencies at the central node, we devise a test for selection akin to our pairwise test for population differentiation. In particular, we first re-estimate FST between each population and the allele frequencies at the central node. Once this is done, we formulate our statistic based upon the likelihood ratio test. We note that this test focuses on selection at any single branch in the tree, and each branch can be tested in turn, provided that the appropriate multiple testing correction is paid as a penalty.
In our null model, we assume that all population differentiation is the result of genetic drift
where and .
In our causal model, we allow an arbitrary amount of differentiation on one branch to be attributed to selection. Therefore, we have
where represents the branch on which we are allowing an arbitrary amount of differentiation because of selection. in both of these equations is re-estimated with the central allele frequencies estimated in the prior step. This re-estimation guarantees that we have a correct statistic in expectation (). The test becomes akin to our pairwise test for population differentiation and we have
and
This is a 1 d.f. statistic. At a first glance, this approach passes the sanity checks of giving no additional power when one of the branch lengths is very large relative to the others and of giving additional power when a large differentiation is replicated over multiple branches. Software implementing our methods is publicly available (TreeSelect software; see Web Resources).
We note that pairwise comparisons between our main data sets was performed but yielded nothing that was fundamentally different from our tree-based results. As such, only the tree-based results are reported in the main text.
Our genome-wide significance threshold for this analysis is based on the 106 markers that were tested for three branches of the tree with a corrected significance level of α < 0.05. Using a standard Bonferroni correction gives a nominal significance level of p < 1.67 × 10⁻⁸. In our analysis of additional populations, we only included the comparison between East Asian populations because allele frequency differences in East Asia are independent of allele frequency differences in our tree-based analysis. This is not the case for differentiation between African populations (LWK versus YRI)—because Nigerians are represented in the tree—nor European populations (CEU versus TSI)—because Europeans are used to correct for the European-like admixture. However, we conservatively correct for three additional tests as though all comparisons were performed. This gives a nominal significance level of p < 5.56 × 10⁻⁹.
Controlling for Admixture
In order to maximize power, we sought to minimize genetic distance between our populations by accounting for European-related admixture in our African-American and Gambian data sets. A simple example of comparing an admixed population to an unadmixed population is the comparison of AA to Nigerians (YRI). The African admixed component of African-American individuals has been shown to have FST < 10−3 with respect to YRI.28,45 However, European admixture in African-American individuals increases the observed value of FST to 0.0075 and results in a less powerful test. We address this by producing estimates of the pseudounadmixed allele frequencies, where . The parameter can then be estimated to minimize FST with Nigerians. This process was performed separately for African-American and Gambian data sets.
The allele frequencies in European-related admixture were estimated from our 1178 European individuals. These individuals were split into two equally sized data sets used to produce estimates of the pseudounadmixed allele frequencies for African Americans and Gambians, respectively.
Population Differences By SNP Class
In order to test for enrichment of highly differentiated SNPs based upon annotated functional class, we partitioned the SNPs according to predicted functional impact.46 We assigned SNPs to be either genic or nongenic and further subdivided genic SNPs into either synonymous or nonsynonymous categories (all nongenic SNPs were categorized as synonymous). We tested for an excess of highly differentiated markers (p < 0.0001) in genic versus nongenic SNPs and in nonsynonymous versus synonymous by using a test on a 2 × 2 contingency table. We used the dbSNP classification for function-class annotations and assigned intronic, 5′ UTR, 3′ UTR, synonymous, nonsynonymous and splice site mutations as genic.
We also sought to evaluate variation in FST across the genome by comparing estimates of FST between genic and nongenic SNPs. To explore this further, we partitioned the SNPs according to evidence for background selection as estimated by the previously described B parameter.47 We binned SNPs according to the estimate of B (0 ≤ B ≤ 1) at the SNP by using 10 equally sized bins for B. Because of the change in FST according to bin reported statistics for differentiation were calculated separately for each bin. However, reported values for FST are genome-wide averages.
Imputation
We used the MaCH48 software package to perform imputation of the HapMap3 SNP set in each of our data sets. Our European data set was used to create the pseudounadmixed data sets of African Americans and Gambians. The imputation process proceeded in three steps. First, the model parameters were estimated with a subset of 300 individuals from each data set. The input files for the reference CEU and YRI panels were downloaded from the MaCH website. Next, the imputation was performed 300 individuals at a time and parallelized on a large computing cluster. Finally, once the imputation was complete, we performed quality control on the results by using as our quality metric.48 Only SNPs that had in the combined set of individuals were retained.
Results
Population Structure in African-American, Nigerian, and Gambian Populations
500 individuals from each of our African-American, Nigerian, and Gambian data sets were studied together with 500 European individuals via PCA with EIGENSOFT49 (see Figure 1). The PCA was performed on the basis of 309,373 autosomal SNPs shared by all individuals. As expected, European and Nigerian individuals form tight clusters that are separated by PC1. The African-American individuals form a cline between these two clusters indicating varying degrees of European admixture in African-American individuals. We note that although several African-American individuals come very close to the Nigerian cluster, there remains a nonzero distance between all African-American individuals and the Nigerian cluster. This is consistent with a small, but measurable, FST between the African ancestors of African Americans and Nigerians. The Gambian individuals are separated from Europeans on PC1 and from the Nigerians on PC2. We label each of the Gambian individuals with their subpopulation label (Mandinka, Jola, Fula, Wolloff) and note the existence of cryptic population structure within the Gambia. Several Fula individuals show significant evidence of European-related admixture by their position on PC1. Additionally, the four subpopulations form overlapping but distinguishable clusters along PC2.
Figure 1.
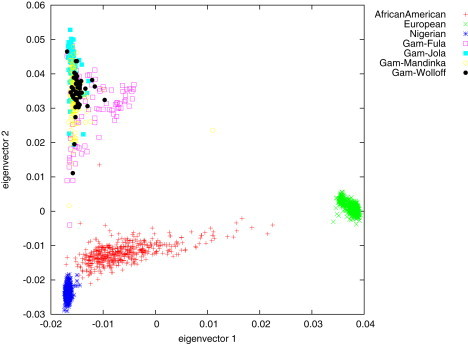
PCA Analysis of Population Structure
This analysis of population structure in our main data sets shows Europeans and Nigerians forming separate, tight clusters. African Americans form a cline between the Nigerian and European clusters; this cline is indicative of varying degrees of European ancestry. The Gambian samples are separated from the Nigerians on PC2, form separate but overlapping clusters, and show evidence of European-like admixture within the Fula subpopulation.
We further investigated population structure by estimating the pairwise FST between each pair of populations (see Table 1). However, we sought to increase power and decrease genetic distance between our populations by accounting for the significant European-related admixture. We produced new pseudounadmixed populations by subtracting European allele frequencies, weighted by admixture proportion, from both the African-American and Gambian data sets (see Methods). We computed admixture proportions and to minimize the pairwise FST estimates between each pseudounadmixed population and the Nigerians (see Table 1). This reduced FST between African Americans and Nigerians from an estimate of 0.0075 to an estimate of 0.0011. We calculated an of 0.20 and an of 0.02 consistent with prior estimates. We also examined pairwise genetic distances in the Gambia (see Table 2). The lowest FST was estimated between Mandinka and Wolloff subpopulations (FST = 0.0005) and the highest between the Fula and Jola subpopulations (FST = 0.005). These values are consistent with prior estimates26,27 and indicate that studies of selection with population differentiation within the Gambia might be a fruitful endeavor. However, given current sample sizes such a study is unlikely to be well powered.
Table 1.
Pairwise Fst between African Populations
| African American | Nigerian | Gambian | |
|---|---|---|---|
| Not Accounting for European-like Admixture | |||
| African American | 0.0074 ± 5.2 × 10⁻⁵ | 0.0072 ± 5.1 × 10⁻⁵ | |
| Nigerian | 0.0059 ± 4.6 × 10⁻⁵ | ||
| Subtracting European Allele Frequencies | |||
| African American | 0.0011 ± 1.1 × 10⁻⁵ | 0.0045 ± 3.3 × 10⁻⁵ | |
| Nigerian | 0.0058 ± 4.6 × 10⁻⁵ | ||
Here we combined all of the Gambian samples and compared these with the African American and Nigerian samples. We list both the estimate and standard error of the estimate for Fst. In the first two rows, we have not accounted for significant European-like admixture in the Gambians and African Americans. In the last two rows, we show the values after accounting for admixture by subtracting European allele frequencies weighted by admixture proportion. The large decrease in Fst between African Americans and both Nigerians and Gambians is expected to increase our power to detect signals of selection. While the drop in Fst between Nigerians and Gambians is small, this is expected due to the small admixture proportion estimated.
Table 2.
Pairwise Fst between Gambian Subpopulations
| Mandinka | Jola | Fula | Wolloff | |
|---|---|---|---|---|
| Mandinka | 0.0012 | 0.0030 | 0.0005 | |
| Jola | 0.0051 | 0.0020 | ||
| Fula | 0.0027 |
We note that the values for Fst do not account for significant European-like admixture within the Fula subpopulation, and these values could potentially be reduced further. With these low values for Fst, exploring population differentiation within the Gambia may be a fruitful endeavor. However, such a study may require more samples than we have available.
In order to validate our use of imputed data, we compared FST estimates between pairs of imputed data sets to those observed between genotyped data sets. Pairwise FST estimates were 0.0048, 0.0012, and 0.0066 for genotyped SNPs in African Americans versus Gambians, African Americans versus Nigerians and Nigerians versus Gambians, respectively. The corresponding estimates for all SNPs (genotyped + imputed) were 0.0044, 0.0011, and 0.0058. This close concordance, and the absence of peaks of population differentiation containing only imputed SNPs, suggests that our reported results do not contain spurious signals due to imputation. All reported results are on data imputed with a combined HapMap 328 reference panel of CEU and YRI.
Signals of Selection in African-Ancestry Populations
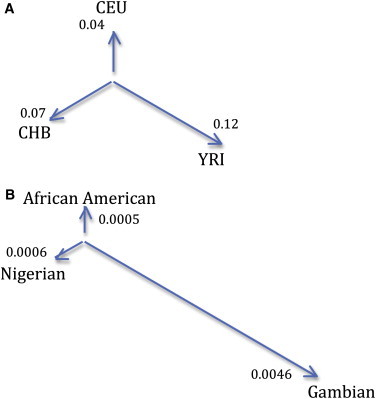
Our tree-based method evaluates selection on a set of markers from multiple populations in two steps (see Methods). In the first, an unrooted tree of populations is estimated. This tree is intended to explain the observed amount of divergence between each pair of populations. With three populations, this is a “star” shaped topology where each population is a leaf node connected to a single internal population by a branch. The length of this branch operates similar to Wright's FST and represents the genetic distance between the leaf population and the internal population (see Figure 2). Following our subtraction of European-related admixture, we estimated the tree for our three data sets in each of 10 bins based on the strength of background selection. For the tree connecting African Americans, Nigerians, and Gambians (see Figure 2B) we estimate branch lengths of 0.0005, 0.0006, and 0.0046. These are closely concordant to the pairwise results for FST.
Figure 2.
Tree Estimates From Sample Data
(A) This tree was estimated using unrelated individuals from the YRI, CEU, and CHB populations sampled as part of the International HapMap Project Phase III. The branch lengths show strong concordance with estimated pairwise values for Fst.
(B) This tree was estimated using our main data sets of African-American, Nigerian, and Gambian samples after accounting for significant European-like admixture in the African-American and Gambian data sets. We note that the second tree is scaled approximately by a factor of 100 with respect to the first. The values quoted are based on genome-wide average estimates of Fst.
Once the tree is estimated, we can evaluate a statistic for selection at every marker common to all data sets. This statistic enables resolution of the population subject to the selective pressure and can give additional power to detect loci under selection relative to pairwise comparisons.
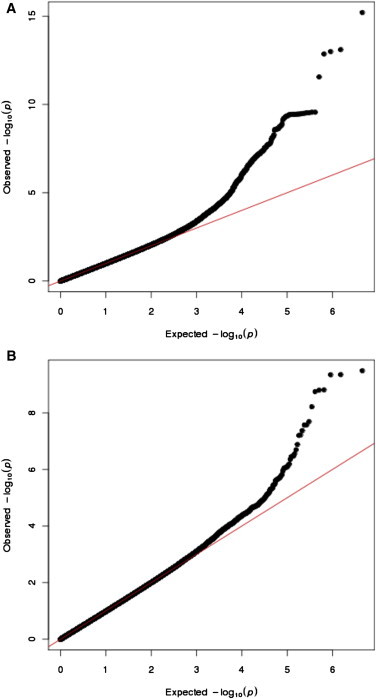
Q-Q plots comparing observed and expected p values indicate an excess of highly differentiated markers (Figure 3). The proportion of markers with p < 0.0001 is 0.0005. After excluding loci with genome-wide significant evidence of selection the proportion of markers with p < 0.0001 is 0.0002. This excess is suggestive of additional selected loci beyond the genome-wide significant signals we describe here. We note that genetic drift at rare and low frequency SNPs (MAF < 5%) is unlikely to be well described in our model and these SNPs are not included in the analysis. Our threshold for genome-wide significance in this analysis was p < 1.67 × 10⁻⁸ (see Methods).
Figure 3.
Q-Q Plots of Population Differentiation in Africans
(A) We compare the actual and expected distribution of selection statistics. The red line represents expectation under neutrality. It is clear that a fat-tail of highly differentiated markers exists, consistent with multiple selective events.
(B) We repeated the analysis after removing the 5 Mb regions containing each of our most significant SNPs and still observe a fat-tail of highly differentiated markers.
A genome-wide significant signal (see Figure 4) at CD362,24,31 is present on both the Nigerian (p = 2.32 × 10−09) and African-American (p = 7.05 × 10−09) branches of the tree. Additionally, we note a highly suggestive signal for selection at the HBB32,50 locus (p = 6.15 × 10−08) on chromosome 11. Selection at both of these loci has been previously detected with population differentiation between African populations ascertained based on malaria exposure.24 The finding of selection at these loci in a genome-wide scan without ascertainment of populations further corroborates the power of our approach (see Table 3 for all signals).
Figure 4.
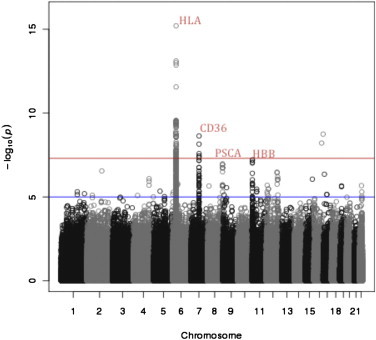
Genome-Wide Population Differentiation in Africans
All values are reported after correcting for variation in Fst according to quantity of background selection. We note genome-specific peaks in the HLA locus on chromosome 6 and CD36 on chromosome 7. HLA has a major role in immunity with multiple prior disease associations, and CD36 is known for its role in malaria resistance. We also observe a highly suggestive peak at PSCA (chromosome 8) tightly linked to a protein-altering variant with prior associations to gastric and bladder cancers. The highly suggestive signal at HBB is unsurprising given its role in malaria resistance. HLA, HBB, and CD36 have been previously reported targets of selection.
Table 3.
Loci with Evidence of Selection in African Populations
| Chromosome | Gene or Region | SNP | Position |
p Values |
||
|---|---|---|---|---|---|---|
| African American | Nigerian | Gambian | ||||
| No Correction for Background Selection | ||||||
| 6 | HLA | rs28366191 | 32472168 | 0.62 | 3.62 × 10⁻⁴ | 1.89 × 10⁻¹⁵ |
| 6 | HLA | rs6901541 | 32550239 | 4.28 × 10⁻⁵ | 1.29 × 10⁻⁹ | 2.75 × 10⁻⁶ |
| 6 | HLA | rs2179915 | 33173712 | 2.45 × 10⁻¹⁰ | 1.48 × 10⁻⁹ | 0.53 |
| 7 | CD36 | rs12721454 | 79678275 | 6.82 × 10⁻⁹ | 1.76 × 10⁻⁷ | 0.97 |
| 7 | CD36 | rs513740 | 79872884 | 5.64 × 10⁻⁸ | 4.03 × 10⁻⁹ | 0.05 |
| 8 | PSCA | rs2920283 | 143754039 | 1.66 × 10⁻⁷ | 2.60 × 10⁻⁶ | 0.95 |
| 11 | HBB | rs7936387 | 5256204 | 3.15 × 10⁻⁵ | 5.99 × 10⁻⁸ | 1.05 × 10⁻³ |
| Corrected for Background Selection | ||||||
| 6 | HLA | rs28366191 | 32472168 | 0.59 | 2.51 × 10⁻⁴ | 6.25 × 10⁻¹⁶ |
| 6 | HLA | rs6901541 | 32550239 | 3.61 × 10⁻⁵ | 6.37 × 10⁻¹⁰ | 1.71 × 10⁻⁶ |
| 6 | HLA | rs2179915 | 33173712 | 3.16 × 10⁻¹⁰ | 1.78 × 10⁻⁹ | 0.52 |
| 7 | CD36 | rs12721454 | 79678275 | 7.05 × 10⁻⁹ | 1.76 × 10⁻⁷ | 0.96 |
| 7 | CD36 | rs513740 | 79872884 | 3.78 × 10⁻⁸ | 2.32 × 10⁻⁹ | 0.05 |
| 8 | PSCA | rs2920283 | 143754039 | 1.06 × 10⁻⁷ | 1.88 × 10⁻⁶ | 0.96 |
| 11 | HBB | rs7936387 | 5256204 | 4.06 × 10⁻⁵ | 6.15 × 10⁻⁸ | 9.53 × 10⁻⁴ |
| Allele Frequencies of Highly Differentiated SNPs | ||||||
| 6 | HLA | rs28366191 | 32472168 | 0.08 | 0.05 | 0.28 |
| 6 | HLA | rs6901541 | 32550239 | 0.31 | 0.45 | 0.14 |
| 6 | HLA | rs2179915 | 33173712 | 0.42 | 0.59 | 0.46 |
| 7 | CD36 | rs12721454 | 79678275 | 0.25 | 0.39 | 0.31 |
| 7 | CD36 | rs513740 | 79872884 | 0.27 | 0.41 | 0.23 |
| 8 | PSCA | rs2920283 | 143754039 | 0.37 | 0.24 | 0.32 |
| 11 | HBB | rs7936387 | 5256204 | 0.17 | 0.28 | 0.08 |
We report the most significant SNPs in loci that showed genome-wide significant or suggestive evidence of natural selection. All SNPs are imputed. The first section shows the p values for each SNP without correcting for background selection at the locus and the second shows the results after the correction. We note the relative insensitivity of our results to correcting for evidence of background selection. The final section lists the allele frequencies of the highly differentiated SNPs. We note the relative insensitivity of our results to correcting for evidence of background selection.
Natural selection at HBB is likely due to the well-known association in which heterozygotes for the sickle cell trait HbAS (HbAS T) are protected against severe malaria.10 We note that a study of unusual population differentiation between Han Chinese and Tibetans14 also showed evidence of selection at the HBB locus. However, the most significantly differentiated marker in that analysis, rs10768683, and the most significantly differentiated marker in our analysis, rs2213169, are not polymorphic in any of the same HapMap populations. Although we cannot rule out separate selective sweeps on the same variant, the absence of HbAS T allele in East Asia leads us to believe that separate selective events on separate causal variants is most consistent with this finding.
Genome-wide significant evidence of selection (see Figure 4) exists for HLA on chromosome 6, known to be heavily involved in human immunity and a well-studied example of natural selection.7,34,35 Peaks at HLA are observed on all three branches of the tree. However, our analysis of selection at HLA shows distinct sets of SNPs with significant evidence of selection on the Gambian, Nigerian and African-American branches of the tree. Specifically, there are unlinked SNPs that show strongest evidence of selection in different populations. The most significantly differentiated SNP along the Gambian branch, rs28366191 (p = 6.3 × 10⁻¹⁶), is differentiated to a much lesser degree on either of the Nigerian or African-American branches (p = 2.5 × 10⁻⁴ and p = 0.59, respectively) or in a pairwise comparison of these populations (p = 0.02). Additionally, the Nigerian and African-American branches show significant evidence of selection at SNPs in the HLA region, for example rs2179915 (p = 1.48 × 10⁻⁹ and p = 2.45 × 10⁻¹⁰, respectively), which are not significant on the Gambian branch (p = 0.53). This SNP was not significantly differentiated in a pairwise analysis of Gambians and African Americans (p = 0.47) indicating that selection likely took place on the Nigerian branch. This leaves multiple selective events as a parsimonious explanation of our findings at HLA.
We also observe a signal in the HLA at rs6901541 that is highly differentiated on all branches of the tree, p = 3.61 × 10⁻⁵, 6.37 × 10⁻¹⁰, and 1.71 × 10⁻⁶, for African-American, Nigerian, and Gambian branches, respectively. This SNP is also highly differentiated in all three pairwise analyses. We note that this is consistent with selection on multiple branches of the tree and further indicates the widespread nature of selection at the HLA.
We observe a suggestive signal, rs2920283 (p = 1.1 × 10⁻⁷), on chromosome 8 within the protein-coding gene prostate stem cell antigen (PSCA). Further evidence of selection at this locus was obtained by analyzing additional populations (see below). A nonsynonymous SNP in PSCA, rs2294008, causes a 9 amino acid truncation of the protein and has been shown to be associated to both gastric and bladder cancers with p = 8 × 10⁻¹¹ and p = 2.14 × 10⁻¹⁰, respectively.36,37 The marker with the most significant evidence of selection on the African-American branch, rs2920283, is in very high LD with the disease associated SNP (r2 > 0.85). We note that rs2920283 is polymorphic in all of the populations studied here (see Table 3) and those included in the Human Genome Diversity Project (see Figure 5). This indicates that the classical selective sweep, in which a novel variant rises to high frequency under selection, is unlikely to apply. Instead, we posit that selection at PSCA is a case of selection on standing variation and an ideal candidate for a test based on population differentiation. We note that no extended haplotype homozygosity12 or integrated haplotype score51 signal has been previously reported at this locus.1,5
Figure 5.
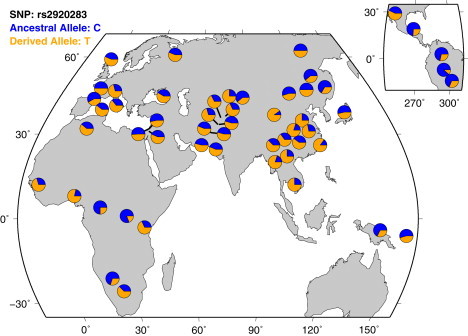
Distribution of Allele Frequencies at PSCA
The allele frequencies of the most differentiated SNP at PSCA are plotted in 52 distinct ethnic groups genotyped as part of the Human Genome Diversity Project. We note the high degree of differentiation in East Asia, Africa, and South America (insert, upper right). Although small samples sizes of these populations hinder analysis of selection, analysis of selection pressures in each of these populations might elucidate the cause of the large allele frequency differences at PSCA.
For comparison purposes, we implemented the LSBL statistic,29 which has been used to discover or validate loci under selection with associations to altitude response,13,14 cystic fibrosis,52 skin pigmentation,53–55 and hair straightness,56 and ran it on our data (see Table S3). The HLA, HBB, and CD36 loci have statistics that rank in the top 0.01% (see Figure S2). The PSCA locus has a statistic in the top 1%. However, many SNPs (nearly 10,000) rank in the top 1%, and it is unclear which of these, if any, present significant evidence of selection.
We note that all reported loci are constrained to contain multiple highly differentiated markers, ruling out the possibility of spurious signals due to assay artifacts. Although two markers 16 Mb apart on chromosome 16 achieved genome-wide significance, they were not reported because they did not satisfy this criteria.
Examining Additional Populations
In order to further explore evidence of selection at our implicated loci, we examined pairs of populations from HapMap3 that were closely related (FST < 0.01). We compared YRI to LWK (FST = 0.0080), TSI to CEU (FST = 0.0039), and JPT to the combined individuals from CHB and CHD (FST = 0.0075).28 In this analysis, we corroborated several published examples of natural selection including LCT57 [MIM 603202] and OCA251 [MIM 611409] in Europeans, KITLG58 [MIM 184745] in East Asians, and CD3624 in Africans (see Table 4). Unsurprisingly, we observe that markers in HLA34 are highly differentiated in all three pairwise analyses consistent with the role of HLA in immunity. Although our comparison of African populations (LWK-YRI) does show a high degree of differentiation at the HLA and CD36 loci (Table 5), we do not observe a signal at the HBB locus. This might be because of insufficient sample size or similar selection pressures in both populations. We note that this comparison is not independent of our tree-based analysis because both involve Yoruba populations.
Table 4.
Loci with Evidence of Selection in HapMap3
| Chromosome | Gene or Region | SNP | Position |
p Values |
||
|---|---|---|---|---|---|---|
| JPT-CH | LWK-YRI | CEU-TSI | ||||
| 2 | LCT | rs6754311 | 136424452 | N/A | 0.60 | 2.03 × 10⁻¹⁵ |
| 3 | SLC9A9/Corf58 | rs7649861 | 145653390 | 0.65 | 2.68× 10⁻⁷ | 0.04 |
| 6 | HLA | rs7745413 | 30023448 | 1.35 × 10⁻⁷ | 0.15 | 0.15 |
| 6 | HLA | rs28366191 | 32472168 | 0.08 | 0.23 | 0.69 |
| 6 | HLA | rs6901541 | 32550239 | 0.13 | 0.19 | 0.64 |
| 6 | HLA | rs2179915 | 33173712 | N/A | 1.08 × 10⁻³ | 0.87 |
| 7 | CD36 | rs12721454 | 79678275 | N/A | 2.63 × 10⁻⁵ | 0.40 |
| 7 | CD36 | rs513740 | 79872884 | 0.11 | 9.74 × 10⁻⁴ | 0.65 |
| 7 | CD36 | rs6944302 | 79942827 | N/A | 7.47 × 10⁻⁷ | 0.09 |
| 8 | PSCA | rs2976397 | 143761615 | 5.87 × 10⁻⁷ | 0.01 | 0.60 |
| 8 | PSCA | rs2920283 | 143754039 | 4.58 × 10⁻⁶ | 0.01 | 0.75 |
| 11 | HBB+HBG2 | rs7936387 | 5256204 | N/A | 0.66 | N/A |
| 11 | OPCML | rs11223548 | 133036865 | 8.90 × 10⁻⁷ | 0.90 | N/A |
| 12 | KITLG | rs11104947 | 87467111 | 4.88 × 10⁻⁷ | N/A | 0.43 |
| 15 | OCA2 | rs12913832 | 26039213 | N/A | N/A | 1.42 × 10⁻⁸ |
We report all highly differentiated SNPs with strong or suggestive evidence for selection (p < 10−6). We see several well-studied examples of selection such as LCT, and OCA2 in Europeans, KITLG in East Asians, and CD36 in Africans. However, several markers significant in our original analysis of African populations do not appear significant in the LWK-YRI comparison. This may be because of the small sample size taken from each of the HapMap3 populations.
Table 5.
Concordance of Signals between African and HapMap3 Analysis
| Gene or Region |
JPT-CH |
LWK-YRI |
CEU-TSI |
|||
|---|---|---|---|---|---|---|
| p Value | SNP | p Value | SNP | p Value | SNP | |
| HLA | 1.35 × 10−07 | rs7745413 | 9.30 × 10⁻⁵ | rs7905 | 3.39 × 10⁻⁶ | rs2256175 |
| CD36 | – | – | 7.47 × 10⁻⁷ | rs6944302 | – | – |
| HBB+HBG2 | – | – | – | – | – | – |
| PSCA | 5.87 × 10−07 | rs2976397 | – | – | – | – |
For each signal in the African analysis, we report the most highly differentiated markers in surrounding region (2.5 Mb on either side) from the HapMap3 analysis. We only report signals if p < 10−4. Surprisingly, no SNP appears differentiated with p < 10−4 in our analysis of the HBB region in Yoruba (YRI) and Luhya (LWK). This may be due to small sample size or an absence of different malaria pressure between these populations.
We note the surprising finding of a high degree of differentiation between JPT and CHB+CHD at the PSCA locus (rs2928023, = 21.03, p = 4.58 × 10⁻⁶) and (rs2976397, = 24.95, p = 5.88 × 10⁻⁷). This is one of the strongest signals of selection in our analysis and corresponds to a 34% allele frequency difference between JPT and CHB+CHD. We note that this comparison is independent of the tree-based analysis because no population in East Asia was used in the tree (i.e., YRI) or to correct for European-related admixture (i.e., CEU). Independence allows us to sum the statistic for differentiation in East Asia with that obtained from the tree at any SNP and produce a 2 d.f. statistic. Doing so yields (rs2920283, = 48.12, p = 3.56 × 10⁻¹¹), which remains genome-wide significant (p < 5.56 × 10⁻⁹) after correction for multiple hypotheses tested (see Methods).
We have also plotted allele frequencies at SNP rs2294008 in all of the populations included in Human Genome Diversity Project40 (Figure 5). There exist large differences in allele frequency throughout East Asia as well as Europe and South America. Although the small sample sizes taken from each population make studies of differentiation underpowered, further studies might elucidate the underlying cause of the selective pressure by analyzing global allele frequency differences.
Population Differences by SNP Class
We analyzed coding and nonsynonymous SNPs for excessive differentiation similar to previous work.46 We examined SNPs that were differentiated with p < 0.0001 on any branch of the tree and compared the number of nonsynonymous coding SNPs and genic SNPs to the number expected under neutrality. We observed 22 nonsynonymous coding SNPs differentiated to this degree, a 3.7-fold enrichment compared with expectations under neutrality ( = 42.08, p = 8.77 × 10⁻¹¹). However, several of these nonsynonymous variants were highly collocated—many occurring in the HLA region—and are unlikely to have been subject to independent selective events. Once we restricted to a single variant per locus, only eight highly differentiated, nonsynonymous SNPs remained ( = 0.7, p = 0.40). We did not observe a statistically significant enrichment of genic SNPs ( = 0.21, p = 0.65).
A recent study of natural selection in sequence data59 found that nonsynonymous coding sites were not enriched for excessive differentiation relative to synonymous sites. This is consistent with our findings. The authors of this study suggest that the “selective sweep” is an uncommon model of human evolution and that methods based on population differentiation between closely related populations might be more powerful for detecting selection. We provide such a method.
Variation in functional status and strength of background selection has been shown to influence the effective population size and, therefore, genetic drift at a locus-specific level.60 Specifically, background selection, often observed in known functional regions, tends to increase the rate of drift and increase the average differentiation at the locus. In our data we observed a difference in FST estimates (Table 6) when computed with markers classified as genic or nongenic.46 This trend was also apparent when we classified markers by the strength of background selection47 at the locus (Table 6) and was especially prevalent when we examined loci with the strongest evidence of background selection.
Table 6.
Pairwise Fst Estimated Using Partitioned Sets of SNPs
| AA-Nigerian | AA-Gambian | Nigerian-Gambian | |
|---|---|---|---|
| Partitioned by Functional Classa | |||
| Genic | 0.0011 | 0.0045 | 0.0061 |
| Nongenic | 0.0011 | 0.0044 | 0.0060 |
| Partitioned by B valueb | |||
| 0.0–0.1 | 0.0017 | 0.0069 | 0.0100 |
| 0.1–0.2 | 0.0011 | 0.0051 | 0.0070 |
| 0.2–0.3 | 0.0011 | 0.0052 | 0.0065 |
| 0.3–0.4 | 0.0011 | 0.0050 | 0.0066 |
| 0.4–0.5 | 0.0012 | 0.0047 | 0.0065 |
| 0.5–0.6 | 0.0011 | 0.0046 | 0.0064 |
| 0.6–0.7 | 0.0011 | 0.0046 | 0.0063 |
| 0.7–0.8 | 0.0011 | 0.0044 | 0.0060 |
| 0.8–0.9 | 0.0011 | 0.0043 | 0.0059 |
| 0.9–1.0 | 0.0010 | 0.0042 | 0.0057 |
Pairwise estimates of Fst calculated using genic and nongenic SNPs.
Pairwise estimates of Fst calculated after binning SNPs according to the strength of background selection at the locus as quantified by the B statistic of McVicker and colleagues.47 The trend observed when binning by functional class is magnified when binning by B values, particularly for B between 0 and 0.1. Because of this difference, we performed all subsequent analysis separately for each bin of B.
In order to verify that our results were not spurious signals because of variation in genetic drift across the genome,47 we repeated our analysis in separate bins according to the strength of background selection. Our results prior to and after correction for the strength of background selection at each locus are very similar (Table 3). This would indicate that our results including the signal at PSCA are robust to this correction.
Discussion
We have examined population differentiation in a genome-wide fashion in three closely related African populations. Similar studies of population differentiation have been previously performed with some success;2,17–19,22–24 however, many of these have focused on continental populations with much larger genetic distance. Although studies have examined closely related populations within Europe or Asia, such studies require the availability of data from large numbers of individuals. Now, as such data has become available, we are able to apply this approach to closely related African populations. In addition to performing pairwise comparisons between closely related populations, we have developed a method of analysis on the basis of differentiation in a tree of populations.
The tree-based analysis that we use is somewhat comparable to the population branch statistic (PBS) described by Yi et. al.14 and the LSBL.13,29,52–56 The PBS seeks to estimate the time since divergence from a central node by using SNP-specific FST and has been shown to have the power to detect recent population-specific natural selection. One challenge associated with the use of PBS/LSBL is that the null distribution of these statistics is not well defined. Thus, significance can be assessed with extensive simulations according to a specific demographic history or a simple ranking of results. When implemented on our data set, the LSBL replicated clear peaks at HLA, HBB, and CD36; however, no other significant peaks were observed.
Our results provided genome-wide significant or suggestive corroboration of several known loci including HLA, HBB, and CD36. We identified a genome-wide significant locus in PSCA. Our most significantly differentiated marker is tightly linked to a marker with prior, genome-wide significant associations to both gastric and bladder cancer. Additionally, our evidence suggests that multiple, independent selective events have occurred in the HLA region.
Several questions of interest arise from this work. Notably, imputation of the HLA genotypes of individuals in our data sets would allow us to pinpoint specific alleles under selection. By analyzing the various HLA alleles individually for population differentiation, it might be possible to infer which HLA alleles are being pushed to high frequency. Understanding this might give further insight into infectious disease resistance. Similarly, understanding the selective pressure acting at PSCA is a question of interest. Analysis of data specific to infectious disease and other possible drivers of selection61 might yield insight into the environmental pressure responsible for selection at this locus.
Acknowledgments
This work was funded by NIH grants R01 HG005224 (B.P., S.P., A.L.P.), RC1 GM091332 (N.P., D.R., J.G.W.) and by grant T32 HG002295 from the National Human Genome Research Institute (NHGRI) (G.B.) and NIH fellowship 5T32ES007142-27 (N.Z.), and used data from NHLBI's CARe project. C.H., D.R., N.P., and A.T. were supported by NIH/NHGRI grant U01 HG004726-01. We acknowledge the contributions of the participants and investigators of NHLBI's CARe consortium (contract number HHSN268200960009C). Funding information for CARe and its parent cohorts can be found at http://public.nhlbi.nih.gov/GeneticsGenomics/home/care.aspx. This study makes use of data generated by MalariaGEN. A full list of the investigators who contributed to the generation of the data is available from www.MalariaGEN.net. Funding for this project was provided by the Foundation for the National Institutes of Health and the Wellcome Trust. The funding for this project comes through the Grand Challenges in Global Health Initiative.
Contributor Information
Gaurav Bhatia, Email: gbhatia@mit.edu.
Alkes L. Price, Email: aprice@hsph.harvard.edu.
Appendix A
Neutral Simulations
We simulated allele frequencies from a pair of populations to verify that this statistic follows the correct null distribution. In order to do this, we chose a variety of starting allele frequencies, , and values for FST. For each and FST, we sampled pairs of allele frequencies from a normal distribution with mean and variance given by . We then estimated from the generated samples and computed the statistic for each pair of sample allele frequencies. In doing this, we notice inflation of the statistic for small values of . However, we note that this inflation is very small with respect to the fat tail observed on real data and is negligible for the allele frequencies of the SNPs that we report to be showing a signal of selection (See Table S1).
Locus-Specific Branch Length
The locus-specific branch length generates a statistic for population differentiation on each of the branches of a tree of three populations. This method assumes that FST statistics are additive and assesses the branch-specific FST for each population. Specifically, given three populations, three pairwise FST statistics () can be computed for each marker. Then, each of the branch-specific FST statistics can be calculated by solving a system of equations giving
However, this method is applicable specifically to the case of three populations. Once these statistics are computed, significance is assessed by ranking. Thus, LSBL can not provide evidence of genome-wide significance.
Supplemental Data
Web Resources
The URLs for data presented herein are as follows:
TreeSelect software, http://www.hsph.harvard.edu/faculty/alkes-price/software/
EIGENSOFT software, http://www.hsph.harvard.edu/faculty/alkes-price/software/
MaCH 1.0 software, http://www.sph.umich.edu/csg/abecasis/MACH/
Online Mendelian Inheritance in Man (OMIM), http://www.omim.org
References
- 1.Sabeti P.C., Reich D.E., Higgins J.M., Levine H.Z., Richter D.J., Schaffner S.F., Gabriel S.B., Platko J.V., Patterson N.J., McDonald G.J. Detecting recent positive selection in the human genome from haplotype structure. Nature. 2002;419:832–837. doi: 10.1038/nature01140. [DOI] [PubMed] [Google Scholar]
- 2.International HapMap Consortium A haplotype map of the human genome. Nature. 2005;437:1299–1320. doi: 10.1038/nature04226. [DOI] [PMC free article] [PubMed] [Google Scholar]
- 3.Ko W.Y., Kaercher K.A., Giombini E., Marcatili P., Froment A., Ibrahim M., Lema G., Nyambo T.B., Omar S.A., Wambebe C. Effects of natural selection and gene conversion on the evolution of human glycophorins coding for MNS blood polymorphisms in malaria-endemic African populations. Am. J. Hum. Genet. 2011;88:741–754. doi: 10.1016/j.ajhg.2011.05.005. [DOI] [PMC free article] [PubMed] [Google Scholar]
- 4.Hamblin M.T., Di Rienzo A. Detection of the signature of natural selection in humans: evidence from the Duffy blood group locus. Am. J. Hum. Genet. 2000;66:1669–1679. doi: 10.1086/302879. [DOI] [PMC free article] [PubMed] [Google Scholar]
- 5.Sabeti P.C., Varilly P., Fry B., Lohmueller J., Hostetter E., Cotsapas C., Xie X., Byrne E.H., McCarroll S.A., Gaudet R., International HapMap Consortium Genome-wide detection and characterization of positive selection in human populations. Nature. 2007;449:913–918. doi: 10.1038/nature06250. [DOI] [PMC free article] [PubMed] [Google Scholar]
- 6.Genovese G., Friedman D.J., Ross M.D., Lecordier L., Uzureau P., Freedman B.I., Bowden D.W., Langefeld C.D., Oleksyk T.K., Uscinski Knob A.L. Association of trypanolytic ApoL1 variants with kidney disease in African Americans. Science. 2010;329:841–845. doi: 10.1126/science.1193032. [DOI] [PMC free article] [PubMed] [Google Scholar]
- 7.de Bakker P.I., McVean G., Sabeti P.C., Miretti M.M., Green T., Marchini J., Ke X., Monsuur A.J., Whittaker P., Delgado M. A high-resolution HLA and SNP haplotype map for disease association studies in the extended human MHC. Nat. Genet. 2006;38:1166–1172. doi: 10.1038/ng1885. [DOI] [PMC free article] [PubMed] [Google Scholar]
- 8.Lewinsohn D.A., Winata E., Swarbrick G.M., Tanner K.E., Cook M.S., Null M.D., Cansler M.E., Sette A., Sidney J., Lewinsohn D.M. Immunodominant tuberculosis CD8 antigens preferentially restricted by HLA-B. PLoS Pathog. 2007;3:1240–1249. doi: 10.1371/journal.ppat.0030127. [DOI] [PMC free article] [PubMed] [Google Scholar]
- 9.Fellay J., Shianna K.V., Ge D., Colombo S., Ledergerber B., Weale M., Zhang K., Gumbs C., Castagna A., Cossarizza A. A whole-genome association study of major determinants for host control of HIV-1. Science. 2007;317:944–947. doi: 10.1126/science.1143767. [DOI] [PMC free article] [PubMed] [Google Scholar]
- 10.Kwiatkowski D.P. How malaria has affected the human genome and what human genetics can teach us about malaria. Am. J. Hum. Genet. 2005;77:171–192. doi: 10.1086/432519. [DOI] [PMC free article] [PubMed] [Google Scholar]
- 11.Nielsen R., Hellmann I., Hubisz M., Bustamante C., Clark A.G. Recent and ongoing selection in the human genome. Nat. Rev. Genet. 2007;8:857–868. doi: 10.1038/nrg2187. [DOI] [PMC free article] [PubMed] [Google Scholar]
- 12.Sabeti P.C., Schaffner S.F., Fry B., Lohmueller J., Varilly P., Shamovsky O., Palma A., Mikkelsen T.S., Altshuler D., Lander E.S. Positive natural selection in the human lineage. Science. 2006;312:1614–1620. doi: 10.1126/science.1124309. [DOI] [PubMed] [Google Scholar]
- 13.Bigham A., Bauchet M., Pinto D., Mao X., Akey J.M., Mei R., Scherer S.W., Julian C.G., Wilson M.J., López Herráez D. Identifying signatures of natural selection in Tibetan and Andean populations using dense genome scan data. PLoS Genet. 2010;6:e1001116. doi: 10.1371/journal.pgen.1001116. [DOI] [PMC free article] [PubMed] [Google Scholar]
- 14.Yi X., Liang Y., Huerta-Sanchez E., Jin X., Cuo Z.X., Pool J.E., Xu X., Jiang H., Vinckenbosch N., Korneliussen T.S. Sequencing of 50 human exomes reveals adaptation to high altitude. Science. 2010;329:75–78. doi: 10.1126/science.1190371. [DOI] [PMC free article] [PubMed] [Google Scholar]
- 15.Simonson T.S., Yang Y., Huff C.D., Yun H., Qin G., Witherspoon D.J., Bai Z., Lorenzo F.R., Xing J., Jorde L.B. Genetic evidence for high-altitude adaptation in Tibet. Science. 2010;329:72–75. doi: 10.1126/science.1189406. [DOI] [PubMed] [Google Scholar]
- 16.Novembre J., Di Rienzo A. Spatial patterns of variation due to natural selection in humans. Nat. Rev. Genet. 2009;10:745–755. doi: 10.1038/nrg2632. [DOI] [PMC free article] [PubMed] [Google Scholar]
- 17.Frazer K.A., Ballinger D.G., Cox D.R., Hinds D.A., Stuve L.L., Gibbs R.A., Belmont J.W., Boudreau A., Hardenbol P., Leal S.M., International HapMap Consortium A second generation human haplotype map of over 3.1 million SNPs. Nature. 2007;449:851–861. doi: 10.1038/nature06258. [DOI] [PMC free article] [PubMed] [Google Scholar]
- 18.Campbell C.D., Sampas N., Tsalenko A., Sudmant P.H., Kidd J.M., Malig M., Vu T.H., Vives L., Tsang P., Bruhn L., Eichler E.E. Population-genetic properties of differentiated human copy-number polymorphisms. Am. J. Hum. Genet. 2011;88:317–332. doi: 10.1016/j.ajhg.2011.02.004. [DOI] [PMC free article] [PubMed] [Google Scholar]
- 19.Akey J.M., Zhang G., Zhang K., Jin L., Shriver M.D. Interrogating a high-density SNP map for signatures of natural selection. Genome Res. 2002;12:1805–1814. doi: 10.1101/gr.631202. [DOI] [PMC free article] [PubMed] [Google Scholar]
- 20.Holsinger K.E., Weir B.S. Genetics in geographically structured populations: defining, estimating and interpreting F(ST) Nat. Rev. Genet. 2009;10:639–650. doi: 10.1038/nrg2611. [DOI] [PMC free article] [PubMed] [Google Scholar]
- 21.Tishkoff S.A., Reed F.A., Friedlaender F.R., Ehret C., Ranciaro A., Froment A., Hirbo J.B., Awomoyi A.A., Bodo J.M., Doumbo O. The genetic structure and history of Africans and African Americans. Science. 2009;324:1035–1044. doi: 10.1126/science.1172257. [DOI] [PMC free article] [PubMed] [Google Scholar]
- 22.Price A.L., Helgason A., Palsson S., Stefansson H., St Clair D., Andreassen O.A., Reich D., Kong A., Stefansson K. The impact of divergence time on the nature of population structure: an example from Iceland. PLoS Genet. 2009;5:e1000505. doi: 10.1371/journal.pgen.1000505. [DOI] [PMC free article] [PubMed] [Google Scholar]
- 23.Xu S., Yin X., Li S., Jin W., Lou H., Yang L., Gong X., Wang H., Shen Y., Pan X. Genomic dissection of population substructure of Han Chinese and its implication in association studies. Am. J. Hum. Genet. 2009;85:762–774. doi: 10.1016/j.ajhg.2009.10.015. [DOI] [PMC free article] [PubMed] [Google Scholar]
- 24.Ayodo G., Price A.L., Keinan A., Ajwang A., Otieno M.F., Orago A.S., Patterson N., Reich D. Combining evidence of natural selection with association analysis increases power to detect malaria-resistance variants. Am. J. Hum. Genet. 2007;81:234–242. doi: 10.1086/519221. [DOI] [PMC free article] [PubMed] [Google Scholar]
- 25.Patterson N., Hattangadi N., Lane B., Lohmueller K.E., Hafler D.A., Oksenberg J.R., Hauser S.L., Smith M.W., O'Brien S.J., Altshuler D. Methods for high-density admixture mapping of disease genes. Am. J. Hum. Genet. 2004;74:979–1000. doi: 10.1086/420871. [DOI] [PMC free article] [PubMed] [Google Scholar]
- 26.Jallow M., Teo Y.Y., Small K.S., Rockett K.A., Deloukas P., Clark T.G., Kivinen K., Bojang K.A., Conway D.J., Pinder M., Wellcome Trust Case Control Consortium. Malaria Genomic Epidemiology Network Genome-wide and fine-resolution association analysis of malaria in West Africa. Nat. Genet. 2009;41:657–665. doi: 10.1038/ng.388. [DOI] [PMC free article] [PubMed] [Google Scholar]
- 27.Thye T., Vannberg F.O., Wong S.H., Owusu-Dabo E., Osei I., Gyapong J., Sirugo G., Sisay-Joof F., Enimil A., Chinbuah M.A., African TB Genetics Consortium. Wellcome Trust Case Control Consortium Genome-wide association analyses identifies a susceptibility locus for tuberculosis on chromosome 18q11.2. Nat. Genet. 2010;42:739–741. doi: 10.1038/ng.639. [DOI] [PMC free article] [PubMed] [Google Scholar]
- 28.Altshuler D.M., Gibbs R.A., Peltonen L., Altshuler D.M., Gibbs R.A., Peltonen L., Dermitzakis E., Schaffner S.F., Yu F., Peltonen L., International HapMap 3 Consortium Integrating common and rare genetic variation in diverse human populations. Nature. 2010;467:52–58. doi: 10.1038/nature09298. [DOI] [PMC free article] [PubMed] [Google Scholar]
- 29.Shriver M.D., Kennedy G.C., Parra E.J., Lawson H.A., Sonpar V., Huang J., Akey J.M., Jones K.W. The genomic distribution of population substructure in four populations using 8,525 autosomal SNPs. Hum. Genomics. 2004;1:274–286. doi: 10.1186/1479-7364-1-4-274. [DOI] [PMC free article] [PubMed] [Google Scholar]
- 30.Akey J.M. Constructing genomic maps of positive selection in humans: where do we go from here? Genome Res. 2009;19:711–722. doi: 10.1101/gr.086652.108. [DOI] [PMC free article] [PubMed] [Google Scholar]
- 31.Fry A.E., Ghansa A., Small K.S., Palma A., Auburn S., Diakite M., Green A., Campino S., Teo Y.Y., Clark T.G. Positive selection of a CD36 nonsense variant in sub-Saharan Africa, but no association with severe malaria phenotypes. Hum. Mol. Genet. 2009;18:2683–2692. doi: 10.1093/hmg/ddp192. [DOI] [PMC free article] [PubMed] [Google Scholar]
- 32.Currat M., Trabuchet G., Rees D., Perrin P., Harding R.M., Clegg J.B., Langaney A., Excoffier L. Molecular analysis of the beta-globin gene cluster in the Niokholo Mandenka population reveals a recent origin of the beta(S) Senegal mutation. Am. J. Hum. Genet. 2002;70:207–223. doi: 10.1086/338304. [DOI] [PMC free article] [PubMed] [Google Scholar]
- 33.Hedrick P.W. Population genetics of malaria resistance in humans. Heredity. 2011 doi: 10.1038/hdy.2011.16. in press. Published online March 23, 2011. [DOI] [PMC free article] [PubMed] [Google Scholar]
- 34.Hedrick P.W., Thomson G. Evidence for balancing selection at HLA. Genetics. 1983;104:449–456. doi: 10.1093/genetics/104.3.449. [DOI] [PMC free article] [PubMed] [Google Scholar]
- 35.Cao K., Moormann A.M., Lyke K.E., Masaberg C., Sumba O.P., Doumbo O.K., Koech D., Lancaster A., Nelson M., Meyer D. Differentiation between African populations is evidenced by the diversity of alleles and haplotypes of HLA class I loci. Tissue Antigens. 2004;63:293–325. doi: 10.1111/j.0001-2815.2004.00192.x. [DOI] [PubMed] [Google Scholar]
- 36.Sakamoto H., Yoshimura K., Saeki N., Katai H., Shimoda T., Matsuno Y., Saito D., Sugimura H., Tanioka F., Kato S., Study Group of Millennium Genome Project for Cancer Genetic variation in PSCA is associated with susceptibility to diffuse-type gastric cancer. Nat. Genet. 2008;40:730–740. doi: 10.1038/ng.152. [DOI] [PubMed] [Google Scholar]
- 37.Wu X., Ye Y., Kiemeney L.A., Sulem P., Rafnar T., Matullo G., Seminara D., Yoshida T., Saeki N., Andrew A.S. Genetic variation in the prostate stem cell antigen gene PSCA confers susceptibility to urinary bladder cancer. Nat. Genet. 2009;41:991–995. doi: 10.1038/ng.421. [DOI] [PMC free article] [PubMed] [Google Scholar]
- 38.Pasaniuc B., Zaitlen N., Lettre G., Chen G.K., Tandon A., Kao W.H.L., Ruczinski I., Fornage M., Siscovick D.S., Zhu X. Enhanced statistical tests for GWAS in admixed populations: assessment using African Americans from CARe and a Breast Cancer Consortium. PLoS Genet. 2011;7:e1001371. doi: 10.1371/journal.pgen.1001371. [DOI] [PMC free article] [PubMed] [Google Scholar]
- 39.Lettre G., Palmer C.D., Young T., Ejebe K.G., Allayee H., Benjamin E.J., Bennett F., Bowden D.W., Chakravarti A., Dreisbach A. Genome-wide association study of coronary heart disease and its risk factors in 8,090 African Americans: the NHLBI CARe Project. PLoS Genet. 2011;7:e1001300. doi: 10.1371/journal.pgen.1001300. [DOI] [PMC free article] [PubMed] [Google Scholar]
- 40.Cann H.M., de Toma C., Cazes L., Legrand M.-F., Morel V., Piouffre L., Bodmer J., Bodmer W.F., Bonne-Tamir B., Cambon-Thomsen A. A human genome diversity cell line panel. Science. 2002;296:261–262. doi: 10.1126/science.296.5566.261b. [DOI] [PubMed] [Google Scholar]
- 41.Clayton D.G., Walker N.M., Smyth D.J., Pask R., Cooper J.D., Maier L.M., Smink L.J., Lam A.C., Ovington N.R., Stevens H.E. Population structure, differential bias and genomic control in a large-scale, case-control association study. Nat. Genet. 2005;37:1243–1246. doi: 10.1038/ng1653. [DOI] [PubMed] [Google Scholar]
- 42.Nicholson G., Smith A.V., Jonsson F., Gustafsson A., Stefansson K., Donnelly P. Assessing population differentiation and isolation from single-nucleotide polymorphism data. J. R. Stat. Soc. Series B Stat. Methodol. 2002;64:695–715. [Google Scholar]
- 43.Wellcome Trust Case Control Consortium Genome-wide association study of 14,000 cases of seven common diseases and 3,000 shared controls. Nature. 2007;447:661–678. doi: 10.1038/nature05911. [DOI] [PMC free article] [PubMed] [Google Scholar]
- 44.Cavalli-Sforza L.L., Edwards A.W. Phylogenetic analysis. Models and estimation procedures. Am. J. Hum. Genet. 1967;19:233–257. [PMC free article] [PubMed] [Google Scholar]
- 45.Price A.L., Tandon A., Patterson N., Barnes K.C., Rafaels N., Ruczinski I., Beaty T.H., Mathias R., Reich D., Myers S. Sensitive detection of chromosomal segments of distinct ancestry in admixed populations. PLoS Genet. 2009;5:e1000519. doi: 10.1371/journal.pgen.1000519. [DOI] [PMC free article] [PubMed] [Google Scholar]
- 46.Barreiro L.B., Laval G., Quach H., Patin E., Quintana-Murci L. Natural selection has driven population differentiation in modern humans. Nat. Genet. 2008;40:340–345. doi: 10.1038/ng.78. [DOI] [PubMed] [Google Scholar]
- 47.McVicker G., Gordon D., Davis C., Green P. Widespread genomic signatures of natural selection in hominid evolution. PLoS Genet. 2009;5:e1000471. doi: 10.1371/journal.pgen.1000471. [DOI] [PMC free article] [PubMed] [Google Scholar]
- 48.Li Y., Willer C.J., Ding J., Scheet P., Abecasis G.R. MaCH: using sequence and genotype data to estimate haplotypes and unobserved genotypes. Genet. Epidemiol. 2010;34:816–834. doi: 10.1002/gepi.20533. [DOI] [PMC free article] [PubMed] [Google Scholar]
- 49.Patterson N., Price A.L., Reich D. Population structure and eigenanalysis. PLoS Genet. 2006;2:e190. doi: 10.1371/journal.pgen.0020190. [DOI] [PMC free article] [PubMed] [Google Scholar]
- 50.Wainscoat J.S., Hill A.V.S., Boyce A.L., Flint J., Hernandez M., Thein S.L., Old J.M., Lynch J.R., Falusi A.G., Weatherall D.J. Evolutionary relationships of human populations from an analysis of nuclear DNA polymorphisms. Nature. 1986;319:491–493. doi: 10.1038/319491a0. [DOI] [PubMed] [Google Scholar]
- 51.Voight B.F., Kudaravalli S., Wen X., Pritchard J.K. A map of recent positive selection in the human genome. PLoS Biol. 2006;4:e72. doi: 10.1371/journal.pbio.0040072. [DOI] [PMC free article] [PubMed] [Google Scholar]
- 52.Mattiangeli V., Ryan A.W., McManus R., Bradley D.G. A genome-wide approach to identify genetic loci with a signature of natural selection in the Irish population. Genome Biol. 2006;7:R74. doi: 10.1186/gb-2006-7-8-r74. [DOI] [PMC free article] [PubMed] [Google Scholar]
- 53.Norton H.L., Kittles R.A., Parra E., McKeigue P., Mao X., Cheng K., Canfield V.A., Bradley D.G., McEvoy B., Shriver M.D. Genetic evidence for the convergent evolution of light skin in Europeans and East Asians. Mol. Biol. Evol. 2007;24:710–722. doi: 10.1093/molbev/msl203. [DOI] [PubMed] [Google Scholar]
- 54.McEvoy B., Beleza S., Shriver M.D. The genetic architecture of normal variation in human pigmentation: an evolutionary perspective and model. Hum. Mol. Genet. 2006;15(Spec No 2):R176–R181. doi: 10.1093/hmg/ddl217. [DOI] [PubMed] [Google Scholar]
- 55.Edwards M., Bigham A., Tan J., Li S., Gozdzik A., Ross K., Jin L., Parra E.J. Association of the OCA2 polymorphism His615Arg with melanin content in east Asian populations: further evidence of convergent evolution of skin pigmentation. PLoS Genet. 2010;6:e1000867. doi: 10.1371/journal.pgen.1000867. [DOI] [PMC free article] [PubMed] [Google Scholar]
- 56.Medland S.E., Nyholt D.R., Painter J.N., McEvoy B.P., McRae A.F., Zhu G., Gordon S.D., Ferreira M.A.R., Wright M.J., Henders A.K. Common variants in the trichohyalin gene are associated with straight hair in Europeans. Am. J. Hum. Genet. 2009;85:750–755. doi: 10.1016/j.ajhg.2009.10.009. [DOI] [PMC free article] [PubMed] [Google Scholar]
- 57.Bersaglieri T., Sabeti P.C., Patterson N., Vanderploeg T., Schaffner S.F., Drake J.A., Rhodes M., Reich D.E., Hirschhorn J.N. Genetic signatures of strong recent positive selection at the lactase gene. Am. J. Hum. Genet. 2004;74:1111–1120. doi: 10.1086/421051. [DOI] [PMC free article] [PubMed] [Google Scholar]
- 58.Williamson S.H., Hubisz M.J., Clark A.G., Payseur B.A., Bustamante C.D., Nielsen R. Localizing recent adaptive evolution in the human genome. PLoS Genet. 2007;3:e90. doi: 10.1371/journal.pgen.0030090. [DOI] [PMC free article] [PubMed] [Google Scholar]
- 59.Hernandez R.D., Kelley J.L., Elyashiv E., Melton S.C., Auton A., McVean G., Sella G., Przeworski M., 1000 Genomes Project Classic selective sweeps were rare in recent human evolution. Science. 2011;331:920–924. doi: 10.1126/science.1198878. [DOI] [PMC free article] [PubMed] [Google Scholar]
- 60.Weir B.S., Cardon L.R., Anderson A.D., Nielsen D.M., Hill W.G. Measures of human population structure show heterogeneity among genomic regions. Genome Res. 2005;15:1468–1476. doi: 10.1101/gr.4398405. [DOI] [PMC free article] [PubMed] [Google Scholar]
- 61.Hancock A.M., Witonsky D.B., Gordon A.S., Eshel G., Pritchard J.K., Coop G., Di Rienzo A. Adaptations to climate in candidate genes for common metabolic disorders. PLoS Genet. 2008;4:e32. doi: 10.1371/journal.pgen.0040032. [DOI] [PMC free article] [PubMed] [Google Scholar]
Associated Data
This section collects any data citations, data availability statements, or supplementary materials included in this article.