Abstract
DNA-DNA interactions are important for the assembly of DNA nanostructures and during biological processes such as genome compaction and transcription regulation. In studies of these complex processes, DNA is commonly modeled as a homogeneously charged cylinder and its electrostatic interactions are calculated within the framework of the Poisson-Boltzmann equation. Commonly, a charge adaptation factor is used to address limitations of this theoretical approach. Despite considerable theoretical and experimental efforts, a rigorous quantitative assessment of this parameter is lacking. Here, we comprehensively characterized DNA-DNA interactions in the presence of monovalent ions by analyzing the supercoiling behavior of single DNA molecules held under constant tension. Both a theoretical model and coarse-grained simulations of this process revealed a surprisingly small effective DNA charge of 40% of the nominal charge density. These findings were directly supported by atomic-scale molecular dynamics simulations that determined the effective force between two DNA molecules. Our new parameterization has direct impact on many physical models involving DNA-DNA interactions.
Keywords: DNA, self-assembly, electrostatics, single-molecule, molecular dynamics, super-coiling
DNA has emerged as a versatile material for nanoscale assembly,1,2 with application ranging from nanomachines,3 templates for nanoelectronics,4 to biocomputing,5 etc. While hybridization of complementary DNA polymers drives assembly of such nanostructure, the nano-scale physical properties of DNA molecules, in particular the elastic moduli,6,7 the excluded volume8 and the electric charge density set limits on what is possible. In nature, these fundamental properties of DNA govern its biological function by influencing DNA folding, packaging,9 pairing,10 and interactions with other biological macromolecules.11
In order to rationally improve the assembly of highly compacted DNA nanostructures2 but also to develop meaningful quantitative models describing biological systems and processes, a precise knowledge of the interaction between two DNA molecules, which is mostly of electrostatic origin, is mandatory. DNA electrostatics is affected by surrounding counter ions, which screen the DNA charge on the scale of the Debye length λD. The counter ion cloud is mainly set by the interplay between solute-ion electrostatic attraction and entropic repulsion, for which the Poisson-Boltzmann equation provides a mean-field description. For highly charged polymers such as DNA this approach can have considerable limitations arising from the reduced structural detail with which the DNA macromolecule is approximated and the assumption of a continuous counter ion density. To offset these problems, it is common practice to rescale DNA electrostatic potentials with a charge adaptation factor. Values between 70% and 100% of the bare DNA charge density are typically used,12–14 but the correct parameterization is debated.12 Often such factors are indirectly obtained from experiments, which are unrelated to DNA-DNA interactions.15 While recent experiments and simulations with nanopores provided a breakthrough for the understanding of DNA electrophoresis,16–19 direct experimental studies of DNA-DNA interaction are rare and themselves limited e.g. to condensed DNA phases,20 short almost spherical DNA particles21 or large DNA-DNA distances.22 Despite increasingly sophisticated experiments, an unambiguous quantitative assessment of DNA-DNA interactions has not been achieved yet. Here we address this issue using magnetic tweezers to measure the ionic strength-dependent supercoiling response of single DNA molecules held under constant tension.23,24 This allows us to mechanically confine two DNA molecules at nanometer proximity in free solution and in absence of disturbing surfaces.
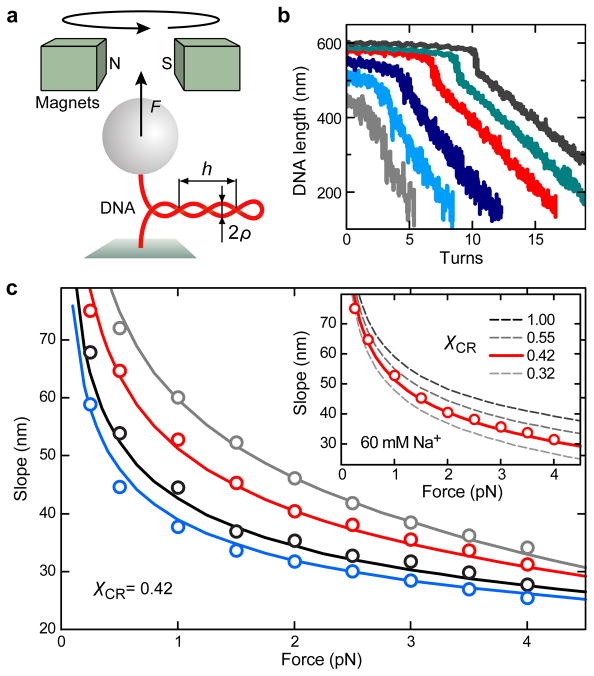
An illustration of the experiment is shown in Figure 1a. Initially the DNA end-to-end distance reduces only slightly upon supercoiling. Once a critical supercoil density is reached, the molecule buckles and the end-to-end distance LDNA decreases linearly with the number of added turns N (Figure 1b) as the extrusion of a superhelical structure absorbs the additional turns in form of writhe.25 While the torque within the DNA increases linearly before the supercoiling transition, it remains constant afterwards.23,26 The slope dLDNA/dN in the superhelical phase depends on the applied force and on the ionic strength of the solution (Figure 1c). Several models have recently been developed to describe this dependence theoretically,27,28 but a quantitative prediction of the slopes across a broad range of applied tensions has not yet been achieved23,28(see supporting information, Figure S1).
Figure 1.
Dependence of DNA supercoiling on force and salt concentration. (a) Experimental setup and superhelix parameters. (b) DNA supercoiling curves recorded in buffer containing 170 mM Na+ at stretching forces of 0.25, 0.5, 1.0, 2.0, 3.0 and 4.0 pN (gray, light blue, dark blue, red, green and dark gray lines). Continuous twisting was carried out at 0.5 Hz. Data was taken at 300 Hz and smoothed to 20 Hz. (c) Slopes after buckling as a function of force obtained from the supercoiling curves for Na+ concentrations of 30, 60, 170 and 320 mM (gray, red, black and blue circles) together with the prediction from the theoretical model (solid lines) calculated for a charge adaptation factor χCR of 0.42. Inset: Slopes for 60 mM Na+ (red circles) together with theoretical predictions for different values of χCR (lines). Best agreement is found for χCR = 0.42 for all ionic strengths considered. Only slight variations of χCR to 0.32 and 0.55 lead to a significant under- or overestimation, respectively, of the slopes.
In order to provide an improved description of the superhelical regime, we calculate the energy per added turn to form an ideal DNA superhelix with superhelical radius ρ and helical repeat length h in the absence of fluctuations12,13,28 (Figure 1a), with the DNA charge as a free parameter:
| (1) |
The value denotes the potential energy change due to shortening the DNA end-to-end distance against the applied force F, the bending energy of the DNA within the superhelix and the DNA-DNA electrostatic interaction energy. Per added turn, i.e. per superhelical writhe, the DNA length within the superhelix grows by:13 [(2πρ)2 +h2]/h = dLDNA/dN, which equals the slope of the supercoiling curves when neglecting fluctuations. is then given by:
| (2) |
The bending energy per turn can be written as:13
| (3) |
where p = 50 nm denotes the bending persistence length, kB the Boltzmann constant, and T the absolute temperature. The term within square brackets describes the DNA curvature. We calculate the electrostatic interaction energy between the two DNA double-strands of the superhelix as previously described.29,30 DNA is approximated as a cylindrical, uniformly charged rod with 1.2 nm radius and linear charge density χCR·ξ, where χCR is the adjustable charge adaptation factor and ξ = 2e/0.34 nm is the nominal charge density. The electrostatic potential along one DNA double-strand is obtained by integrating point charge potentials placed at the center-line of the opposite double-strand. The DNA charge density ξ* entering the potential is adapted (see Figure S2) to account for the cylindrical geometry (factor χRod) and for deviations due to using solutions to the linearized Poisson-Boltzmann equation (factor χPB). For an ideal infinite superhelix the electrostatic potential is invariant along the DNA contour and the electrostatic interaction energy per added turn is approximately the product of the calculated potential (see Figure S2) and the adapted charge of one of the double-strands,29 1/2 · dLDNA/dN · ξ*:
| (4) |
with ξ* = ξ · χCR · χRod · χPB and lB = 0.7 nm being the Bjerrum-length in water. r(s) denotes the distance between a point located at position s of the center-line of one double-strand and a fixed point located at the center-line of the other double-strand of the superhelix. Numeric integration is performed over the whole center-line s of the former double-strand. This simplified electrostatic potential yields values very similar to the full numerical solution of the Poisson-Boltzmann equation (Figure S3).
By combining eq 1–4 we now can calculate and by minimization with respect to ρ and h one obtains the slope dLDNA/dN and the DNA torque for the energetically favored superhelix configuration.
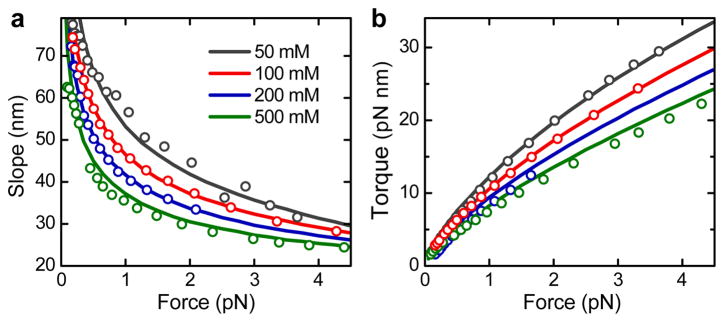
We compared the predictions of our model with the experimentally obtained slopes of our supercoiling curves for forces between 0.25 and 4 pN (Figure 1b) in buffers containing 30 mM to 320 mM Na+. Remarkably, the slopes at all applied forces and ion concentrations are accurately described (Figure 1c). However, achieving the agreement required a substantial reduction of the DNA charge by employing the charge adaptation factor χCR = 0.42, independent of the salt concentration (Figure S4). Our theoretical model accurately describes the slopes of recently available, independently measured supercoiling curves23 (Figure 2a). Since the force dependence of slope and torque are linked,23,31 our model also predicts the torque in the superhelical phase correctly (Figure 2b and S5). The obtained χCR is found to be rather insensitive to other parameters of the model, e.g. changing the weakly salt dependent persistence length by 5 nm alters χCR only by ± 0.03.
Figure 2.
Comparison of the predictions from the theoretical model with data from ref. 13. (a) Slopes after buckling versus force for different Na+ concentrations. Circles represent experimental data, solid lines the theoretical prediction for χCR = 0.42. (b) Torque after buckling. Colors and symbols are as in a.
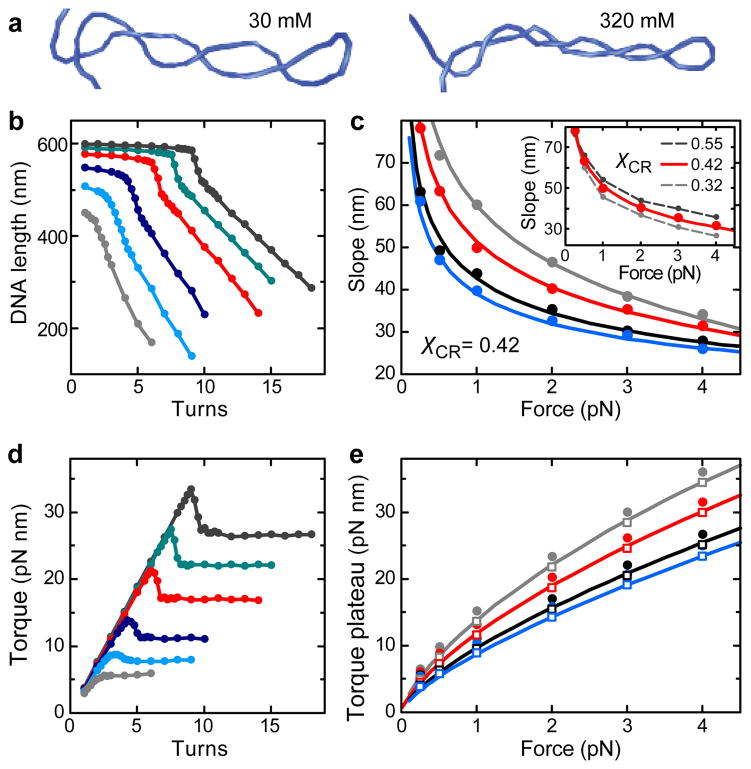
To exclude the possibility that the small effective charge is an artifact due to neglected fluctuations, we carried out coarse-grained Monte-Carlo simulations (Figure 3). The DNA is modeled as a chain of small cylindrical segments, with equivalent terms describing the potential, bending, and electrostatic energies as in the theoretical model. Additional terms account for the twisting and stretching energy.14 By performing simulations with different numbers of added turns, we obtained supercoiling curves very similar to those observed experimentally (Figure 3b). Applying χCR = 0.42, the slopes from simulation, theory and experiments are in excellent agreement over the entire range of applied forces and ionic strengths (Figure 3c). This provides strong, independent support for a small effective DNA charge. Comparing torque values from the simulations and theoretical model, we find a good overall agreement, except the values from simulations appear globally 1.5 pN nm higher (Figure 3e). We attribute this deviation to DNA fluctuations which are neglected in the model (see Supporting information and Figures S6–S8).
Figure 3.
Coarse-grained Monte-Carlo simulations of DNA supercoiling. (a) Snapshots of the formed plectoneme at 1 pN and 8 turns in the presence of 30 and 320 mM monovalent ions. The linear, stretched parts of the DNA as well as the surface and the bead are not shown. (b) Simulated DNA supercoiling curves for 170 mM Na+ at stretching forces of 0.25, 0.5, 1.0, 2.0, 3.0 and 4.0 pN for χCR = 0.42 (colors are as in Figure 1b). Simulated curves excellently reproduce the experimentally observed behavior. This includes the abrupt force- and salt-dependent buckling at the onset of the plectonemic phase, which is accompanied by a torque overshoot (see d). Buckling is followed by a linear DNA length decrease with added turns at constant torque. (c) Slopes after buckling obtained from the simulated curves for Na+ concentrations of 30, 60, 170 and 320 mM (circles, colors as in Figure 1b) and corresponding predictions from the theoretical model for χCR of 0.42 (solid lines). Inset: Slopes from simulated curves at 60 mM Na+ for χCR = 0.42 (red dots) as well as for χCR = 0.32 and χCR = 0.55 (gray dots with dashed lines). The prediction for χCR = 0.42 is shown as a solid red line. Small variations of χCR cause significant differences for the obtained slopes. (d) Torque during DNA supercoiling for the curves shown in b. (e) Torque after buckling as obtained from the simulations (filled circles) and after subtraction of 1.5 pN nm (open squares) together with the corresponding predictions from the theoretical model for χCR of 0.42 (solid lines). Torque values from simulations appear globally shifted by 1.5 pN nm compared to the theoretical model since subtraction of this value provides a much better agreement. Na+ concentrations and colors are as in c.
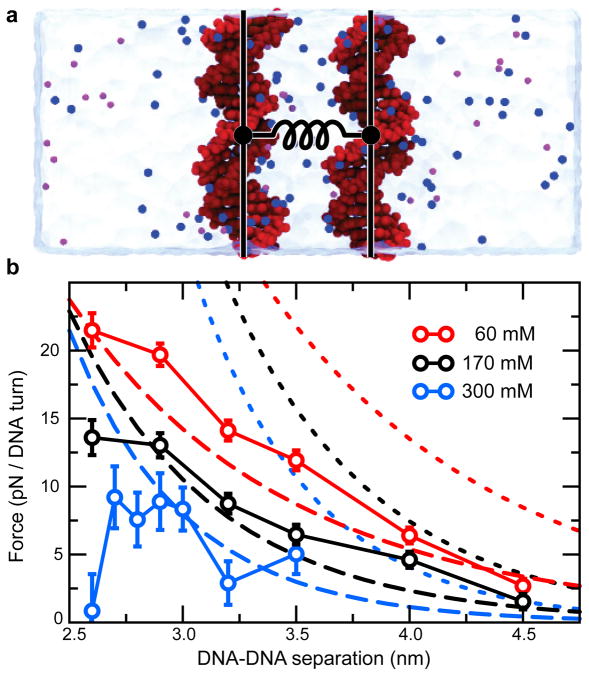
In order to obtain a microscopic verification for χCR, all-atom molecular dynamics simulations were employed to obtain the force between parallel DNA molecules at different salt concentrations.32 We obtained good agreement with the force calculated according to eq 4 using χCR = 0.42, and very poor agreement with χCR = 1.0 (Figure 4). To test whether the value found for χCR is specific to DNA-DNA interactions or is a universal constant for DNA electrostatics, we obtained the ion distributions around isolated double-stranded DNA molecules17 (Figure S10). The radial ion distribution extended further from the DNA than expected from Poisson-Boltzmann theory with χCR = 0.42 and approached the distribution for χCR = 1.0 at low ionic strength (Figure S11a). Thus, the small value for χCR is specific to DNA-DNA interactions. At elevated ion concentrations, the mean electrostatic potential around the DNA was too weak to create the ion-distribution as observed in simulation and as predicted by Poisson-Boltzmann theory (Figures S11b,c). This suggests that ion distributions are not only determined by electrostatics, but that other effects such as correlations in the ion clouds, the non-continuum nature of the dielectric surrounding and ion exclusion can have a significant influence. This in turn is likely to cause the low DNA-DNA interaction forces. Additionally, deviations from the homogeneously charged rod model, such as strongly localized charges at the phosphates and counter ions entering the DNA grooves may reduce the interaction forces.
Figure 4.
All-atom molecular dynamics simulations of the effective force between double-stranded DNA. (a) All-atom model used to determine the force. The DNA atoms are depicted as red spheres; the counter and co ions are depicted as blue and purple spheres, respectively; the water is shown as a semi-transparent molecular surface. The distance between the DNA molecules was restrained by a harmonic potential, schematically depicted as a spring. (b) The simulated mean force between the DNA. Data from MD simulations (circles, solid lines) are shown alongside the theoretical predictions using a charge adaptation factor χCR of 0.42 (dashed lines) and 1.0 (dotted lines) at 60 (red) and 170 mM (black) bulk ion concentrations. Data for 300 mM (blue) bulk ion concentrations is reproduced from previous work.32 The relative orientation of the DNA did not appear to affect the obtained force within error. The atomic structure of the interacting DNA and nearby solvent cause the force to drop at 300 mM as the separation between the DNA surfaces approaches the atomic scale.32
By combining single-molecule experiments, theoretical considerations, coarse-grained and all-atom simulations, we have shown that, within a cylinder approximation, DNA-DNA interactions can only be described by a significantly reduced DNA charge. Furthermore, we have introduced supercoiling experiments as a new way to build quantitative models of interactions between biopolymers and have provided a theory that accurately describes DNA supercoils over a broad range of tension and ionic strength. Supercoiling under tension is a unique way to confine and align two DNA molecules into close proximity to each other in absence of interfering surfaces.18 In contrast to previous investigations of supercoiled plasmid DNA,14,22 our force-based experiments allow a more reliable quantification of non-entropic DNA-DNA interactions since much smaller distances between DNA strands are achieved (Figures S4 and S7). The surprisingly small DNA-DNA interactions result from a complex interplay of a highly charged and structured molecule with solvent molecules and ions. The extend of the particular contributions still remains to be investigated, e.g. using double-strand RNA instead of DNA may help to elucidate the role of nucleic-acid structure.19 The simple effective interaction potential will be an important contribution for quantitative models of complex biomolecular systems, which cannot be treated with atomic detail. The findings reveal that particular caution is necessary when applying effective charge parameters obtained from experiments that investigate different physical questions, such as electrophoresis,29 where a complex interplay between hydrodynamics and electrostatics is probed.17,18,33
Methods
Magnetic tweezers experiments
Magnetic tweezers experiments were carried out as previously described.24,34 DNA substrates consisted of a 1865 bp or a 10.9 kbp linear fragment. At either end 600 bp attachment handles, carrying multiple biotin- or digoxigenin-modified bases, were added by ligation. Supercoiling experiments for forces ≥1 pN were carried out exclusively on the short substrate. At lower forces additional measurements were done using the long substrate in order to obtain more reliable slope values. DNA constructs were bound to 1 μm streptavidin-coated superparamagnetic microspheres (MyOne, Invitrogen, Carlsbad, CA) and flushed into a flow cell, whose bottom cover slip was coated with anti-digoxigenin. All measurements were performed at room temperature in 10 mM phosphate buffer at 7.5 pH, supplemented with varying amounts of NaCl to achieve the final Na+ concentrations indicated in the text. The magnetic field was generated using a pair of permanent NdFeB magnets (W-05-N50-G, Supermagnete, Uster, Switzerland). The length of the DNA was determined from the vertical position of the magnetic microsphere with respect to a non-magnetic reference microsphere attached to the surface of the flow cell using videomicroscopy and 3D particle tracking with nm accuracy.35 Images of both beads were acquired simultaneously with a frequency of 300 Hz using a fast CMOS-camera (EoSens CL, Mikrotron, Unterschleißheim, Germany) and analyzed in real-time.
Coarse-grained Monte-Carlo simulations
DNA was described by a linear chain of 129 rigid 5 nm segments.14,36,37 The energy of the system was a sum of the elastic energy of DNA represented by harmonic potentials for stretching, bending and torsion and the electrostatic energy of DNA-DNA interactions calculated in analogy to eq 4 as previousely described.14 The stretching force from the magnetic tweezers was modeled as a linear potential applied to one end of the DNA and a harmonic potential applied to the other end to ensure surface tethering. In addition, both ends were torsionally constrained. The conformations of the chain were restricted by an impenetrable surface near one end of the chain and by an impenetrable 0.8 μm sphere at the other end. Writhe calculations and knot calculations were performed to prevent DNA strands from crossing each other; invalid configurations were rejected. Statistically independent ensembles of configurations were sampled using a standard Metropolis Monte-Carlo approach.38 Every molecule was simulated at least 4 times at a temperature of 293 K for 60 million steps, which led to at least 1600 uncorrelated conformations. A detailed description of the simulation procedure is given in Supplementary Methods.
All-atom molecular dynamics simulations
Following a method described previously,32 two copies of (A·T)20 were placed 26, 29, 32, 35, 40, or 45 Å apart in a box containing 60 or 170 mM NaCl electrolyte. The size of the simulation system was chosen to ensure that the force due to periodic images would be <2% of the force between the DNA in the same unit cell, assuming an exponentially decaying force. The distance between the DNA molecules was harmonically restrained with a force constant of 3000 pN Å−1 while the force was recorded. Three copies of the system at each DNA separation and ion concentration were simulated. The first nanosecond of the force data was removed. The data was subsequently concatenated and averaged in 200-ps blocks to remove correlations affecting the standard error of the mean. A detailed description of the simulation protocols is given in supporting information.
Supplementary Material
Acknowledgments
We gratefully acknowledge K. Kroy, U. Keyser and M. Emanuel for helpful discussions. This work was supported by grants SE 1646/1-1 and SE 1646/2-1 from the DFG to R. Seidel, the National Institutes of Health (R01-HG003713 and PHS 5 P41-RR05969), the National Science Foundation (PHY0822613), the Petroleum Research Fund (48352-G6) and the TeraGrid (MCA05S028) to A. Aksimentiev. MC simulations were supported by project mvb00007 of the North German Supercomputing Alliance (HLRN).
References
- 1.Andersen ES, Dong M, Nielsen MM, Jahn K, Subramani R, Mamdouh W, Golas MM, Sander B, Stark H, Oliveira CLP, Pedersen JS, Birkedal V, Besenbacher F, Gothelf KV, Kjems J. Nature. 2009;459:73–76. doi: 10.1038/nature07971. [DOI] [PubMed] [Google Scholar]
- 2.Ke Y, Douglas SM, Liu M, Sharma J, Cheng A, Leung A, Liu Y, Shih WM, Yan H. J Am Chem Soc. 2009;131:15903–15908. doi: 10.1021/ja906381y. [DOI] [PMC free article] [PubMed] [Google Scholar]
- 3.Bath J, Turberfield AJ. Nat Nanotechnol. 2007;2:275–284. doi: 10.1038/nnano.2007.104. [DOI] [PubMed] [Google Scholar]
- 4.Rothemund PWK. Nature. 2006;440:297–302. doi: 10.1038/nature04586. [DOI] [PubMed] [Google Scholar]
- 5.Lipton RJ. Science. 1995;268:542–545. doi: 10.1126/science.7725098. [DOI] [PubMed] [Google Scholar]
- 6.Wiggins PA, van der Heijden T, Moreno-Herrero F, Spakowitz A, Phillips R, Widom J, Dekker C, Nelson PC. Nat Nanotechnol. 2006;1:137–141. doi: 10.1038/nnano.2006.63. [DOI] [PubMed] [Google Scholar]
- 7.Mathew-Fenn RS, Das R, Harbury PAB. Science. 2008;322:446–449. doi: 10.1126/science.1158881. [DOI] [PMC free article] [PubMed] [Google Scholar]
- 8.Drube F, Alim K, Witz G, Dietler G, Frey E. Nano Lett. 2010;10:1445–1449. doi: 10.1021/nl1003575. [DOI] [PubMed] [Google Scholar]
- 9.Marenduzzo D, Orlandini E, Stasiak A, Sumners DW, Tubiana L, Micheletti C. Proc Natl Acad Sci USA. 2009;106:22269–22274. doi: 10.1073/pnas.0907524106. [DOI] [PMC free article] [PubMed] [Google Scholar]
- 10.Kornyshev AA, Leikin S. Phys Rev Lett. 2001;86:3666–3669. doi: 10.1103/PhysRevLett.86.3666. [DOI] [PubMed] [Google Scholar]
- 11.Kao-Huang Y, Revzin A, Butler AP, O’Conner P, Noble DW, von Hippel PH. Proc Natl Acad Sci USA. 1977;74:4228–4232. doi: 10.1073/pnas.74.10.4228. [DOI] [PMC free article] [PubMed] [Google Scholar]
- 12.Ubbink J, Odijk T. Biophys J. 1999;76:2502–2519. doi: 10.1016/S0006-3495(99)77405-9. [DOI] [PMC free article] [PubMed] [Google Scholar]
- 13.Marko, Siggia Phys Rev E. 1995;52:2912–2938. doi: 10.1103/physreve.52.2912. [DOI] [PubMed] [Google Scholar]
- 14.Klenin K, Merlitz H, Langowski J. Biophys J. 1998;74:780–788. doi: 10.1016/S0006-3495(98)74003-2. [DOI] [PMC free article] [PubMed] [Google Scholar]
- 15.Schellman JA, Stigter D. Biopolymers. 1977;16:1415–1434. doi: 10.1002/bip.1977.360160704. [DOI] [PubMed] [Google Scholar]
- 16.Sigalov G, Comer J, Timp G, Aksimentiev A. Nano Lett. 2008;8:56–63. doi: 10.1021/nl071890k. [DOI] [PMC free article] [PubMed] [Google Scholar]
- 17.Luan B, Aksimentiev A. Phys Rev E. 2008;78:021912. doi: 10.1103/PhysRevE.78.021912. [DOI] [PMC free article] [PubMed] [Google Scholar]
- 18.van Dorp S, Keyser UF, Dekker NH, Dekker C, Lemay SG. Nat Phys. 2009;5:347–351. [Google Scholar]
- 19.van den Hout M, Vilfan ID, Hage S, Dekker NH. Nano Lett. 2010;10:701–707. doi: 10.1021/nl903925a. [DOI] [PubMed] [Google Scholar]
- 20.Rau DC, Parsegian VA. Biophys J. 1992;61:246–259. doi: 10.1016/S0006-3495(92)81831-3. [DOI] [PMC free article] [PubMed] [Google Scholar]
- 21.Qiu X, Kwok LW, Park HY, Lamb JS, Andresen K, Pollack L. Phys Rev Lett. 2006;96:138101. doi: 10.1103/PhysRevLett.96.138101. [DOI] [PubMed] [Google Scholar]
- 22.Hammermann M, Steinmaier C, Merlitz H, Kapp U, Waldeck W, Chirico G, Langowski J. Biophys J. 1997;73:2674–2687. doi: 10.1016/S0006-3495(97)78296-1. [DOI] [PMC free article] [PubMed] [Google Scholar]
- 23.Mosconi F, Allemand JF, Bensimon D, Croquette V. Phys Rev Lett. 2009;102:078301. doi: 10.1103/PhysRevLett.102.078301. [DOI] [PubMed] [Google Scholar]
- 24.Brutzer H, Luzzietti N, Klaue D, Seidel R. Biophys J. 2010;98:1267–1276. doi: 10.1016/j.bpj.2009.12.4292. [DOI] [PMC free article] [PubMed] [Google Scholar]
- 25.Strick TR, Dessinges MN, Charvin G, Dekker NH, Allemand JF, Bensimon D, Croquette V. Rep Prog Phys. 2003;66:1–45. [Google Scholar]
- 26.Forth S, Deufel C, Sheinin MY, Daniels B, Sethna JP, Wang MD. Phys Rev Lett. 2008;100:148301. doi: 10.1103/PhysRevLett.100.148301. [DOI] [PMC free article] [PubMed] [Google Scholar]
- 27.Marko JF. Phys Rev E. 2007;76:021926. doi: 10.1103/PhysRevE.76.021926. [DOI] [PubMed] [Google Scholar]
- 28.Clauvelin N, Audoly B, Neukirch S. Biophys J. 2009;96:3716–3723. doi: 10.1016/j.bpj.2009.02.032. [DOI] [PMC free article] [PubMed] [Google Scholar]
- 29.Stigter D. Biopolymers. 1977;16:1435–1448. doi: 10.1002/bip.1977.360160705. [DOI] [PubMed] [Google Scholar]
- 30.Brenner SL, Parsegian VA. Biophys J. 1974;14:327–334. doi: 10.1016/S0006-3495(74)85919-9. [DOI] [PMC free article] [PubMed] [Google Scholar]
- 31.Zhang H, Marko JF. Phys Rev E. 2008;77:031916. doi: 10.1103/PhysRevE.77.031916. [DOI] [PubMed] [Google Scholar]
- 32.Luan B, Aksimentiev A. J Am Chem Soc. 2008;130:15754–15755. doi: 10.1021/ja804802u. [DOI] [PMC free article] [PubMed] [Google Scholar]
- 33.Luan B, Aksimentiev A. Soft Matter. 2010;6:243–246. doi: 10.1039/b917973a. [DOI] [PMC free article] [PubMed] [Google Scholar]
- 34.Revyakin A, Ebright RH, Strick TR. Nat Methods. 2005;2:127–138. doi: 10.1038/nmeth0205-127. [DOI] [PubMed] [Google Scholar]
- 35.Klaue D, Seidel R. Phys Rev Lett. 2009;102:028302. doi: 10.1103/PhysRevLett.102.028302. [DOI] [PubMed] [Google Scholar]
- 36.Wedemann G, Langowski J. Biophys J. 2002;82:2847–2859. doi: 10.1016/S0006-3495(02)75627-0. [DOI] [PMC free article] [PubMed] [Google Scholar]
- 37.Vologodskii AV, Marko JF. Biophys J. 1997;73:123–132. doi: 10.1016/S0006-3495(97)78053-6. [DOI] [PMC free article] [PubMed] [Google Scholar]
- 38.Baumgärtner A, Binder K. J Chem Phys. 1979;71:2541–2545. [Google Scholar]
Associated Data
This section collects any data citations, data availability statements, or supplementary materials included in this article.


