Abstract
We have generated a transgenic mouse with no white fat tissue throughout life. These mice express a dominant-negative protein, termed A-ZIP/F, under the control of the adipose-specific aP2 enhancer/promoter. This protein prevents the DNA binding of B-ZIP transcription factors of both the C/EBP and Jun families. The transgenic mice (named A-ZIP/F-1) have no white adipose tissue and dramatically reduced amounts of brown adipose tissue, which is inactive. They are initially growth delayed, but by week 12, surpass their littermates in weight. The mice eat, drink, and urinate copiously, have decreased fecundity, premature death, and frequently die after anesthesia. The physiological consequences of having no white fat tissue are profound. The liver is engorged with lipid, and the internal organs are enlarged. The mice are diabetic, with reduced leptin (20-fold) and elevated serum glucose (3-fold), insulin (50- to 400-fold), free fatty acids (2-fold), and triglycerides (3- to 5-fold). The A-ZIP/F-1 phenotype suggests a mouse model for the human disease lipoatrophic diabetes (Seip-Berardinelli syndrome), indicating that the lack of fat can cause diabetes. The myriad of consequences of having no fat throughout development can be addressed with this model.
Keywords: AP-1, C/EBP, dominant negative proteins, adipocytes, lipodystrophy, diabetes
White adipose tissue (WAT) is the major organ for regulated storage of triglycerides for use as metabolic energy. WAT helps control energy homeostasis, including food intake, metabolic efficiency, and energy expenditure, via its secreted hormone, leptin, and possibly additional unknown hormones. The quantity of body fat varies widely in mammals, ranging from 2% to >50% of body mass, typically from 10% to 20% in mice and humans. Much of this variability can be observed within a single individual, highlighting the delicate balance of factors controlling fat deposition. The huge variation in fat mass is unlike that of any other organ in the body and is determined by both an individual’s genetic background and environmental factors including diet and physical activity (Comuzzie and Allison 1998; Hill and Peters 1998). Excess body fat, or obesity, is a major health problem, particularly in America, increasing the risk of diabetes, hypertension, and coronary artery disease (Thomas 1995). The mechanisms by which obesity causes these diseases, however, are unclear. To understand better the contribution of adipose tissue to diabetes and metabolism, it would be valuable to examine a mouse with no adipose tissue. To this end, we produced a transgenic mouse with essentially no white adipose tissue and examined the contribution of WAT to energy metabolism, reproductive function, and disease susceptibility.
Mutant mice with either increased or decreased levels of WAT have been reported. For example, two mutations that disrupt signaling between WAT and the brain (ob/ob and db/db, affecting leptin and its receptor, respectively) cause an increase in WAT amount leading to diabetes (Coleman 1978; Zhang et al. 1994; Chen et al. 1996). These mice have increased food intake and decreased physical and sympathetic nerve activity, all contributing to obesity. Adipose-specific expression of a diphtheria toxigene resulted in mice with either a severe phenotype including neonatal death or a mild phenotype, characterized by resistance to induced obesity or delayed loss of WAT at 10 months (Ross et al. 1993; Burant et al. 1997). These results suggest that WAT may be an essential organ for life. At present, there are no mice, from either knockout or transgene technologies that are devoid of WAT throughout development.
We have used tissue-specific expression of a dominant-negative protein transgene to ablate WAT in mice. Rather than use a toxigene, we chose instead to express a protein that inhibits the function of transcription factors critical for fat development. Adipocyte growth and differentiation (Wu et al. 1996; Mandrup and Lane 1997) follow patterns of sequential B-ZIP protein expression, including AP-1 (Distel et al. 1987; Stephens et al. 1992) and C/EBP family proteins (Christy et al. 1989; McKnight et al. 1989). C/EBPα overexpression in cell culture caused adipose differentiation (Freytag et al. 1994; Lin and Lane 1994). Knockout mice lacking C/EBPα die shortly after birth with no discernable WAT (Wang et al. 1995). The double knockout of C/EBPβ and C/EBPδ also results in reduced fat mass (Tanaka et al. 1997), all suggesting that C/EBP family proteins are important for fat development.
In this study, we used 7.6 kb of the aP2 enhancer/promoter to target adipocyte-specific transgene expression of a dominant-negative protein termed A-ZIP/F. This dominant-negative protein inhibits the DNA binding and function of B-ZIP proteins in both the C/EBP (Vinson et al. 1993) and AP-1 families of transcription factors. The resulting adult transgenic mice have essentially no white fat and dramatically reduced amounts of brown fat that is inactive. Here, we describe the profound physiological consequences of having no WAT and introduce a mouse model of the human disease lipoatrophic diabetes, a genetic or autoimmune condition exhibiting an absence of WAT (Foster 1994; Seip and Trygstad 1996).
Results
A-ZIP/F is a dominant-negative protein that inhibits the DNA binding of both C/EBP and AP-1
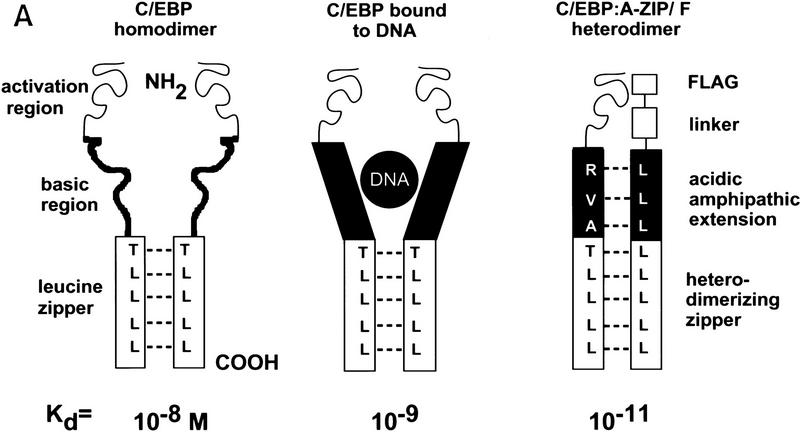
We designed a protein, A-ZIP/F, that inhibits the action of B-ZIP transcription factors by forming stable heterodimers (Fig. 1A). The dominant-negative A-ZIP/F is a 104-amino-acid protein consisting of an amino-terminal 9-amino-acid Flag epitope, a 13-amino-acid linker, a 21-amino-acid designed acidic amphipathic helix, and a 61-amino-acid-designed leucine zipper termed ZIP/F (Vinson et al. 1993; Krylov et al. 1995). A novel aspect of this dominant-negative protein is the acidic region that replaces the B-ZIP basic region. The acidic region heterodimerizes with endogenous B-ZIP basic regions, forming an coiled coil extension of the leucine zipper, thus stabilizing the complex 3–5 kcal/mole. This stabilization causes the dominant-negative protein to abolish B-ZIP DNA binding (Krylov et al. 1995, 1997; Olive et al. 1997; Ahn et al. 1998).
Figure 1.
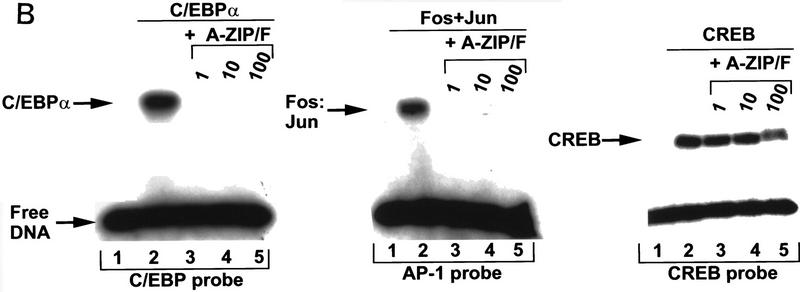
(A) Schematic of A-ZIP/F dominant-negative action. (Left) Cartoon of the B-ZIP homodimer, C/EBP. The amino-terminal part of the protein is the activation domain. Carboxy-terminal to the activation region is the basic DNA-binding domain, which in the absence of DNA is unstructured. This is followed by the α-helical leucine zipper dimerization domain. The dashed lines represent physical interactions between the leucines in the d positions that are critical for forming a coiled coil dimer structure. (Middle) C/EBP homodimer bound to DNA. This binding causes the basic region to form an α-helical extension of the leucine zipper, which enhances stability of the dimer by ∼100-fold. (Right) Heterodimerization between a C/EBPα monomer and a A-ZIP/F monomer. The carboxy-terminal F-zipper interacts specifically with the C/EBPα (or Jun) leucine zipper whereas the amino-terminal acidic extension forms a coiled coil with the basic domain of B-ZIP proteins. This heterodimeric coiled coil structure is more stable than C/EBPα bound to DNA by a further ∼100-fold. (B) A-ZIP/F inhibits the DNA binding of C/EBPα (left) and Fos+Jun (middle), but not CREB (right) in gel-shift assays. (Lanes 1) No protein; (lanes 2) 10 nmoles of the indicated B-ZIP domain, which forms a complex with the labeled oligonucleotide probe; (lanes 3,4,5) B-ZIP domains as well as 1-, 10-, or 100-fold molar equivalent of recombinant A-ZIP/F protein, respectively. Equimolar A-ZIP/F abolishes the DNA-binding of both C/EBPα and Fos+Jun, but has no effect on CREB DNA binding, even in 100-fold molar excess.
The leucine zipper region determines the dimerization specificity of the dominant-negative proteins. The ZIP/F leucine zipper is based on C/EBPα, but changes four amino acids in the g and e positions to glutamate. The ZIP/F zipper is reminiscent of the Fos zipper (O’Shea et al. 1989, 1992), as both contain a large number of glutamates in these positions. Using electrophoretic mobility-shift experiments, we examined the ability of A-ZIP/F to inhibit DNA binding of different B-ZIP transcription factors (Fig. 1B). A-ZIP/F, at an equimolar concentration, inhibited the DNA binding of the C/EBPα homodimer. A-ZIP/F also inhibited the DNA binding of AP-1, a heterodimer of the Fos and Jun B-ZIP domains. This promiscuous inhibition becomes zipper-specific if the acidic extension is placed onto the amino terminus of either the C/EBP or Fos leucine zipper (data not shown). A-ZIP/F does not inhibit the DNA binding of all B-ZIP factors. CREB DNA binding is not blocked, even at 100-fold molar excess (Fig. 1B).
Transgenic mouse lines
We expressed A-ZIP/F using a fat-specific promoter, reasoning that disruption of the function of C/EBP and JUN family members might disrupt adipocyte growth and differentiation as both have been implicated in its development. We used 7.6 kb of the enhancer/promoter to express Flag-tagged A-ZIP/F protein (Fig. 2A). Three transgenic FVB/N mice were obtained from 30 live births. One did not transmit the transgene, one did not express the transgene, and the remaining expressing line, designated A-ZIP/F-1, is characterized in this report. The A-ZIP/F-1 line carries ∼16 copies of the transgene. Hemizygous females had reduced fertility and litter size and almost no pups survived until weaning. The A-ZIP/F-1 line is propagated by the breeding of hemizygous males with FVB/N females. The males show reduced fertility, but produce litters of normal size (9.2 ± 0.3 pups, mean ± s.e.m.; n = 29 litters). Homozygous mice have not been obtained, and all studies were performed with hemizygous mice.
Figure 2.
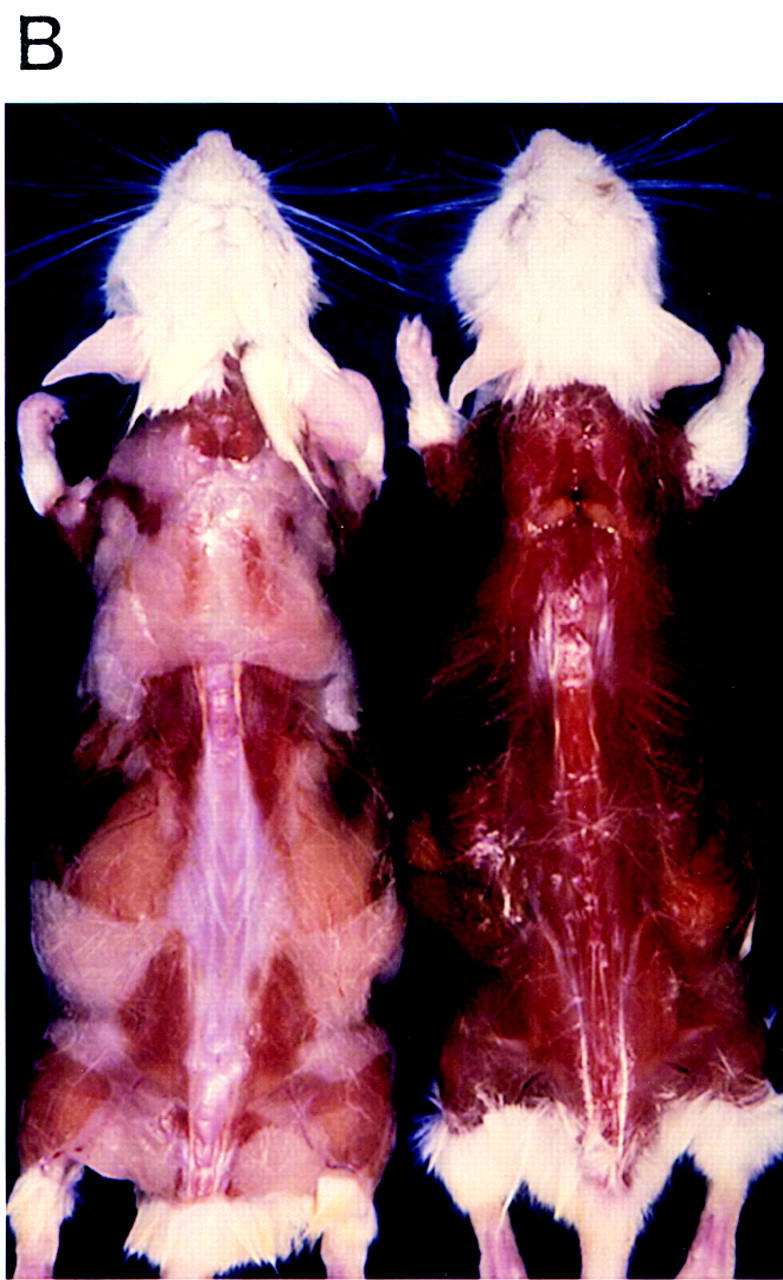
(A) Schematic of the transgene for fat-specific expression of the A-ZIP/F dominant-negative protein. (Open region) 7.6-kb aP2 promoter/enhancer; (closed region) 298-bp A-ZIP/F open reading frame with a Flag epitope; (striped region) ∼1.0-kb SV40 small t antigen splice and poly(A) sites. The unique restriction sites used to form junctions between these three different elements are shown, as well as the 5′ and 3′ sites used for isolating DNA for microinjection from the plasmid. (B) Lack of WAT in A-ZIP/F-1 mice. Dorsal view of male littermates, aged 26 weeks, after removal of the skin. (Left) Wild-type mouse; (right) A-ZIP/F-1 mouse. Note the absence of visible WAT and the residual interscapular adipose tissue in the A-ZIP/F-1 animal.
A-ZIP/F mRNA and protein expression in the A-ZIP/F-1 line
Dissections of adult A-ZIP/F-1 mice revealed essentially no WAT and a severely reduced amount of brown adipose tissue (BAT; Fig. 2B and below). A-ZIP/F mRNA was restricted to the residual BAT and was of the predicted size of 1.3 kb (Fig. 3A). Muscle and heart contained traces of A-ZIP/F mRNA at 1% and 3% of the BAT level, respectively. We suggest that the muscle and heart signals are from residual adipose tissue associated with these organs as endogenous adipocyte-specific aP2 mRNA was present at similar levels in the muscle and heart samples. The absence of WAT precluded our ability to determine A-ZIP/F expression in WAT. A-ZIP/F mRNA signal is thus limited to those cells that normally express aP2, namely adipocytes (Bernlohr et al. 1985).
Figure 3.
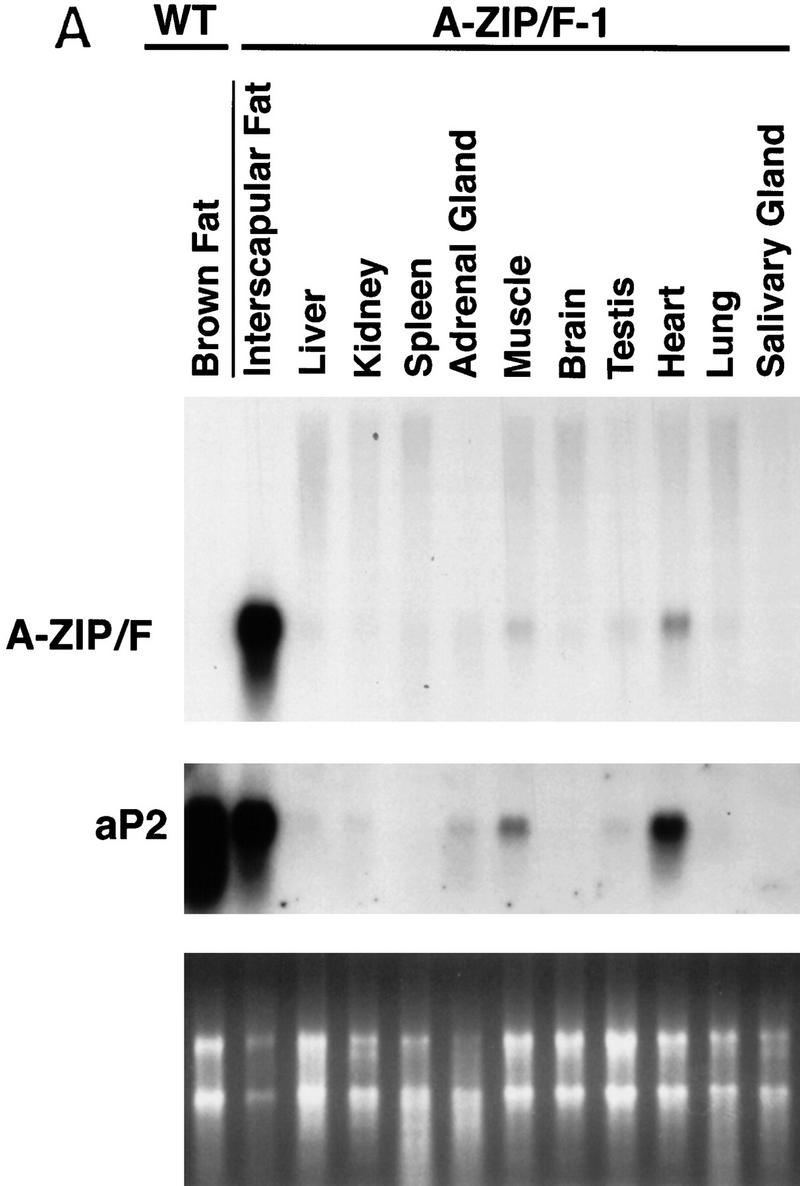
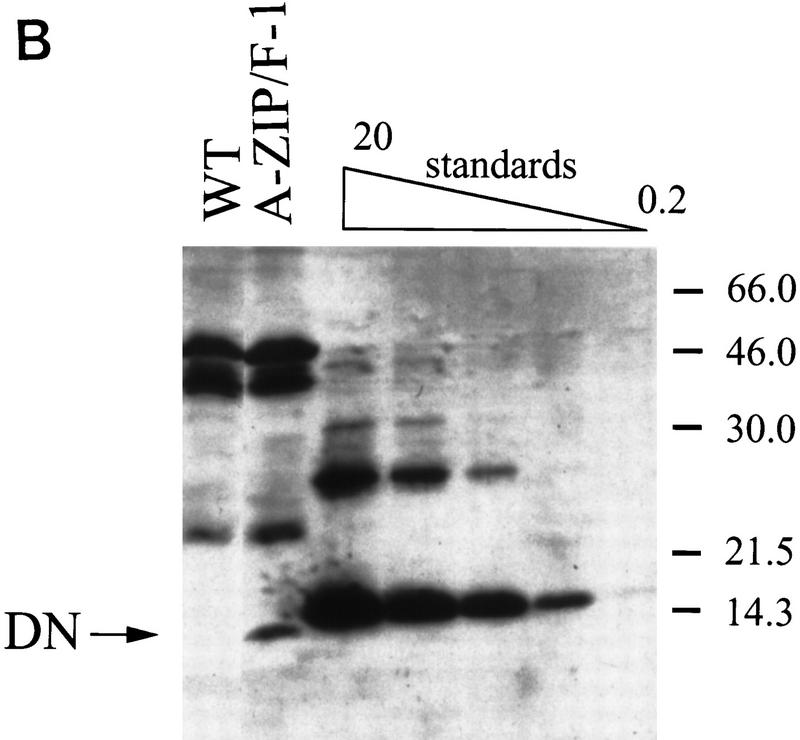
Expression analysis of the transgene. (A) Total RNA was isolated from wild-type BAT and the 11 indicated A-ZIP/F-1 tissues (interscapular fat is BAT), electrophoresed, blotted, and probed successively for A-ZIP/F and aP2. All lanes contain 10 μg of RNA, except for the interscapular fat, which contains 5 μg. Quantitation by PhosphorImager showed that A-ZIP/F expression in the heart lane is 3% of the level in BAT. Ethidium bromide staining confirmed RNA loading (bottom). (B) Anti-Flag antibody was used to probe expression of the Flag-tagged A-ZIP/F protein in BAT of A-ZIP/F-1 and littermate wild-type mice. (DN) Mobility of the A-ZIP/F molecule. A recombinant standard (20, 5, 2, 0.5, and 0.2 pmole) was run for quantitation. Molecular mass is indicated on the right.
A-ZIP/F protein expression was measured by monitoring of the amino-terminal Flag epitope. Western blotting revealed a band of the expected 12-kD size in transgenic BAT but not in other tissues (data not shown) or wild-type BAT (Fig 3B). Quantitation, with a recombinant Flag standard containing the Fos leucine zipper, indicated that the residual adipose tissue contains ∼2 million A-ZIP/F protein molecules per cell (see Materials and Methods).
Residual BAT in A-ZIP/F mice
The residual adipose tissue in A-ZIP/F-1 mice is found at the anatomical sites expected for BAT (interscapular, neck, parasternal, and renal hilum). As the A-ZIP/F-1 animal ages, BAT shrinks. BAT performs thermogenesis and is most prominent in small mammals and the young of larger mammals (Nicholls and Locke 1984; Himms-Hagen and Ricquier 1998). Active wild-type BAT consists of mitochondria-rich eosinophilic cells containing multiple lipid droplets (Fig. 4A). In contrast, wild-type WAT cells are typically larger, contain few mitochondria, and a single large lipid droplet, pushing the nucleus to the cell periphery. The A-ZIP/F-1 adipose tissue showed sparse eosinophilic staining, a single lipid droplet per cell, and peripheral nuclei, resembling WAT. However, this is also the appearance of dormant wild-type BAT, for example as seen in ob/ob mice (Trayhurn 1986). Thus A-ZIP/F-1 adipose tissue resembles inactive BAT. Uncoupling protein 1 (UCP1) is a molecular marker used to distinguish BAT from WAT (Bouillaud et al. 1985; Jacobsson et al. 1985). A-ZIP/F-1 adipose tissue contains low levels of UCP1 mRNA (Fig. 4B), as is found in inactive BAT (Bouillaud et al. 1985; Jacobsson et al. 1985). From the anatomical position, histology, and UCP1 expression, we conclude that the residual adipose tissue in the A-ZIP/F-1 mice is inactive BAT.
Figure 4.
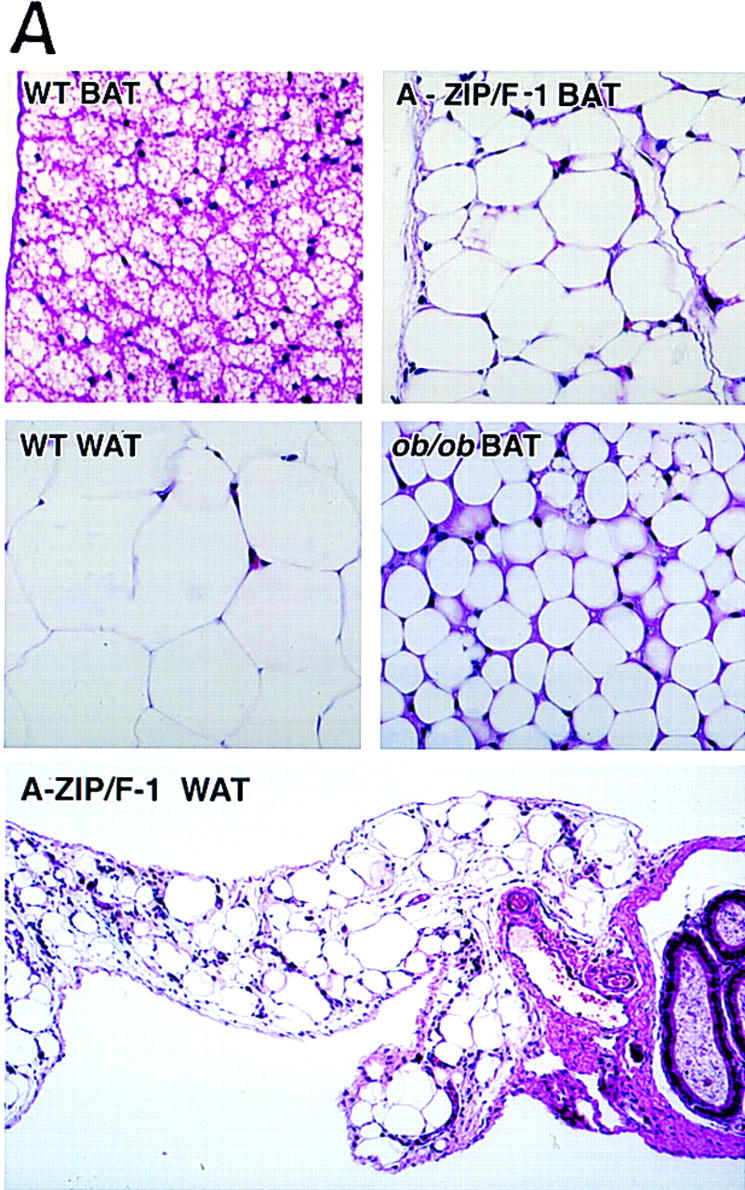
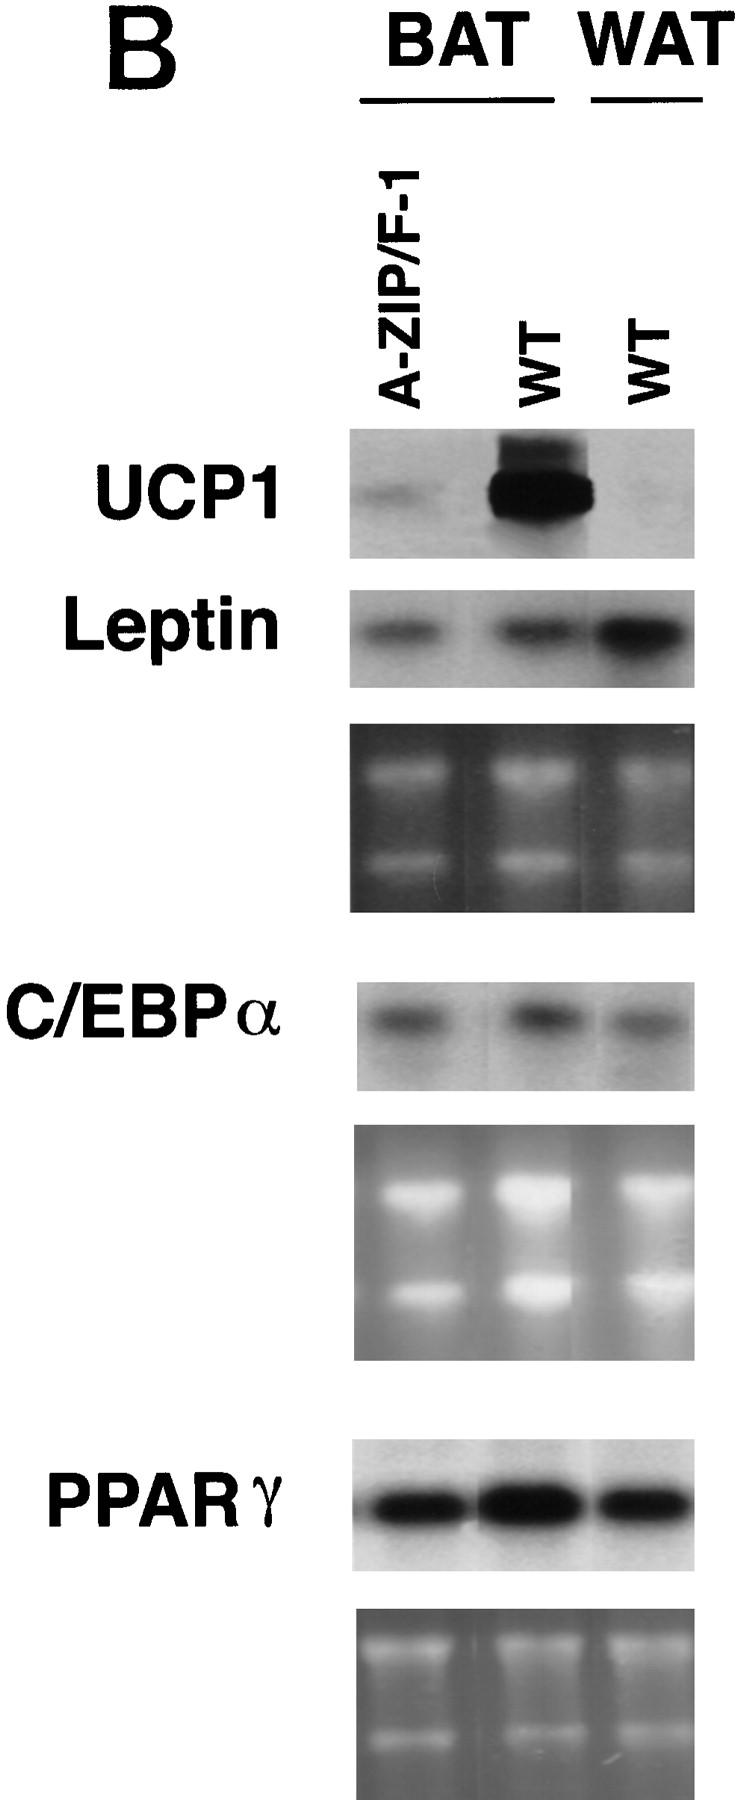
(A) Histology of adipose tissue. Wild-type, A-ZIP/F-1, and ob/ob interscapular BAT, and wild-type and A-ZIP/F-1 epididymal WAT are shown as indicated. Hematoxylin and eosin staining magnification 150× (top and middle); 60× (bottom). (B) Expression of C/EBP regulated genes in adipose tissue. Three separate Northern blots containing total RNA from A-ZIP/F-1 interscapular BAT and from wild-type interscapular BAT and epididymal WAT were prepared and hybridized with DNA probes for UCP1, leptin, C/EBPα, and PPARγ. The UCP1, leptin, and C/EBPα blots contain 10 μg RNA per lane and the PPARγ blot, 5 μg of RNA per lane. Ethidium bromide staining is shown as a loading control.
The residual A-ZIP/F-1 BAT contains 2 million molecules per cell of the dominant-negative protein that neutralizes C/EBP and Jun B-ZIP family members. UCP1, which is regulated by C/EBPs (Yubero et al. 1994) is dramatically underexpressed in A-ZIP/F-1 fat tissue. In contrast, other adipose genes reported to require C/EBP family members for efficient expression, including leptin, aP2, and PPARγ (Christy et al. 1989; He et al. 1995; Clarke et al. 1997; Mason et al. 1998), are not underexpressed (Fig. 4B). The complex response of BAT to the presence of the A-ZIP/F dominant-negative protein highlights the differential response of eukaryotic promoters to the transcription environment.
The developmental progress of the A-ZIP/F-1 phenotype
During mouse development, BAT first appears at embryonic day 15 (Houstek et al. 1988), while WAT appears at birth (Ailaud and Hauner 1998). The absence of WAT and reduced BAT in adult A-ZIP/F-1 mice is attributable either to the lack of cell birth or to cell death. To address this question, mice at 17 days of gestation, and at 1, 3, 7, and 14 days postnatum were examined histologically. Eighteen hours after birth, control animals had abundant interscapular BAT and subcutaneous WAT (Fig. 5). Transgenic A-ZIP/F-1 mice had about half the BAT of controls, and this BAT appeared similar to active wild-type BAT. WAT was not visible in the newborn A-ZIP/F-1 mice. We did not see any apoptosing cells at the five time points we examined, suggesting that WAT cells are never born.
Figure 5.
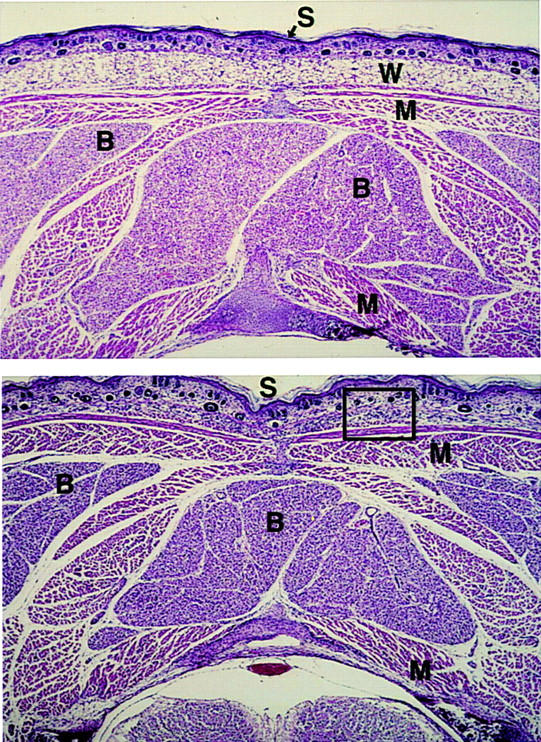
Absence of WAT in A-ZIP/F-1 mice at day 1. Transverse sections at the level of the neck were made from ∼18-hr wild-type (top) and A-ZIP/F-1 littermate (bottom) mice. (B) BAT; (W) WAT; (M) muscle; (S) skin. Hematoxylin and eosin staining magnification, 30×.
Enlarged viscera in A-ZIP/F-1 adult mice
Adult A-ZIP/F-1 mice are distinguishable from wild-type littermate controls by their rough-appearing coat and increased abdominal girth. Dissections and histologic examinations performed on adult A-ZIP/F-1 mice aged 7 and 24 weeks and sex-matched littermates found no visible WAT (including subcutaneous, gonadal, perinephric, and mesenteric; Figs. 2B and 6A), although microscopically a few adipocytes were present in the region of the epididymal fat pads (Fig. 4, bottom). The epididymal fat in wild-type mice at 20 weeks averaged 2.8% of body weight, while none was visible in A-ZIP/F-1 animals (Table 1). The interscapular BAT in adult A-ZIP/F-1 mice, although present, was reduced, weighing only 11% of control mice (Table 1).
Figure 6.
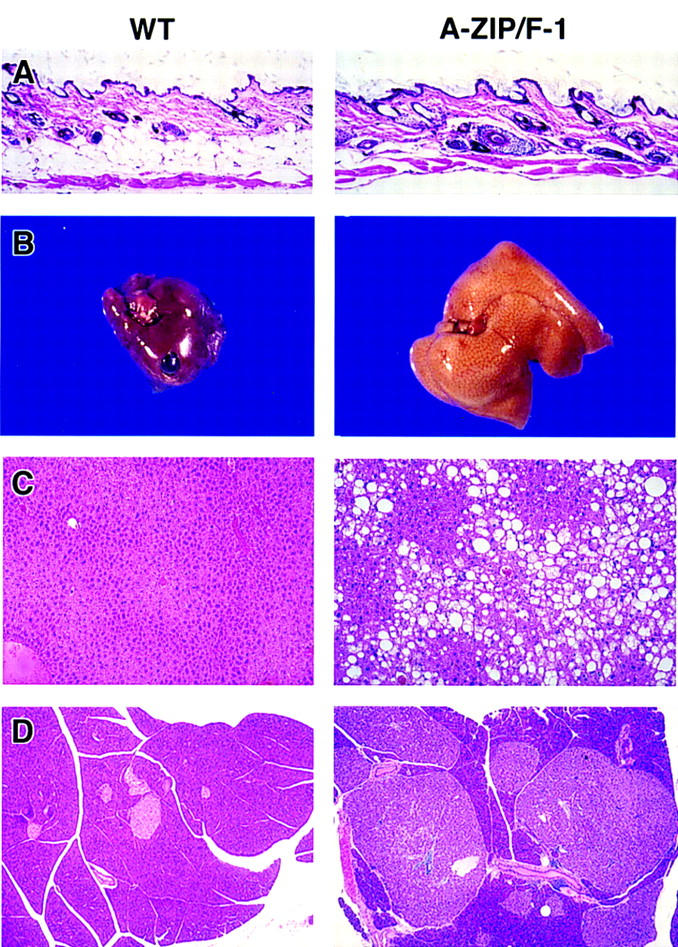
Appearance of skin, liver, and pancreas in mice at 22 weeks of age. Tissues from female wild-type (WT, left) and A-ZIP/F-1 (right) mice are shown at the same magnifications. (A) Skin, with WAT visible below the dermis in wild-type but not A-ZIP/F-1 mice. Grossly, livers of A-ZIP/F-1 mice are enlarged and lighter in color (B). Microscopically the A-ZIP/F-1 liver is filled with lipid droplets (C). Pancreatic islet β cell hypertrophy and hyperplasia were present in all A-ZIP/F-1 mice examined. A particularly striking example is in D (the lighter staining cells are the islets and the darker region is the exocrine pancreas). Hematoxylin and eosin staining magnification, 30× (A,C) and 16× (D).
Table 1.
Anatomical characteristics of A-ZIP/F-1 mice
|
|
Body weight (grams)
|
Length (cm)
|
BMI (grams/cm2)
|
Epi WAT (%)
|
BAT (%)
|
Liver (%)
|
Kidney (%)
|
Spleen (%)
|
Heart (%)
|
|---|---|---|---|---|---|---|---|---|---|
| A-ZIP/F-1 | 37.6 ± 0.9 | 9.68 ± 0.07 | 0.401 ± 0.006 | <0.025 | 0.07 ± 0.01 | 9.51 ± 0.70 | 2.15 ± 0.06 | 0.58 ± 0.07 | 0.50 ± 0.01 |
| Wildtype | 39.5 ± 1.1 | 9.90 ± 0.06 | 0.402 ± 0.007 | 2.83 ± 0.18 | 0.67 ± 0.05 | 4.49 ± 0.09 | 1.37 ± 0.03 | 0.32 ± 0.01 | 0.42 ± 0.02 |
| Ratio | 0.95 | 0.98 | 1.00 | <0.01 | 0.11 | 2.12 | 1.57 | 1.81 | 1.18 |
| P | 0.23 | 0.08 | 0.93 | 0.0002 | 0.002 | 0.0002 | 0.02 | 0.01 |
Data are mean ± s.e.m. with five mice in each group. Animals were 20-week-old males from two litters. The body mass index (BMI) is the weight/(length squared). The organ weights were measured as a percentage of the animal’s body weight. For epididymal (Epi) WAT, we estimate that 10 mg of tissue is the limit of detection. Ratio is the A-ZIP/F-1 value expressed as a fraction of the wild-type value. Probabilities (P) are from two-tailed t-test.
Adult A-ZIP/F-1 mice grow heavier than their littermates, even without fat, which is typically 15% of body weight (Salmon and Flatt 1985; West et al. 1992). We measured organ weights in 20-week-old mice to characterize this difference (Table 1). The liver accounts for less than half of the increase with other viscera (including the kidneys, heart, and spleen) contributing to the increase.
The livers in adult A-ZIP/F-1 mice were enlarged 2.1-fold and were lighter in color and density (Table 1; Fig. 6B). Histological examination showed oil red O-stained lipid droplets of various sizes within the liver. The lipid accumulated in a zone 3/centrilobular pattern with both micro- and macrosteatosis (Fig. 6C). No fibrosis, cirrhosis, or inflammatory infiltrates were associated with the steatosis. Serum chemistries confirmed that the mice did not have acute hepatitis, with normal range alanine aminotransferase, aspartate aminotransferase, alkaline phosphatase, and bilirubin, total and direct. Quantitation of triglycerides showed that the A-ZIP/F-1 mouse liver contains 6.8-fold more triglycerides compared with age-matched wild-type littermates (58 mg/gram liver in A-ZIP/F-1; 18 mg/gram liver in wild type). Quantitative immunoblot analysis showed increases in the enzymes involved in both lipogenesis and lipolysis. Of the 19 species of fatty acid-metabolizing enzymes (Aoyama et al. 1998) examined, only the protein levels of three peroxisomal enzymes (peroxisomal bifunctional protein, composed of hydratase and 3-hydroxyacyl-CoA dehydrogenase; D-type peroxisomal bifunctional protein; and peroxisomal 3-ketoacyl-CoA thiolase) were increased about threefold. These changes, however, should have minimal effects on lipolysis, because neither peroxisomal acyl-CoA oxidase, the rate-limiting enzyme in peroxisomal fatty-acid β-oxidation (Aoyama et al. 1994), nor the mitochondrial enzymes that catalyze long-chain fatty-acid β-oxidation are affected in the A-ZIP/F-1 mice. On the other hand, the levels of three rate-limiting fatty-acid synthesis-related enzymes (acetyl-CoA carboxylase, fatty-acid synthetase, and ATP-citrate lyase) increased 2.9-, 2.9-, and 3.8-fold, respectively. These increases in rate-limiting enzymes contribute greatly to enhanced lipogenesis, suggesting a mechanism for the fatty livers of A-ZIP/F-1 mice.
The pancreatic islets were hypertrophic and hyperplastic (Fig. 6D). Histological immunostaining for insulin demonstrated a large increase in the number of β cells. Foam cells (phagocytic cells loaded with lipid) were observed in the lungs of some animals.
Early death of A-ZIP/F-1 mice
We examined the survival and growth of the A-ZIP/F-1 mice to determine the consequences of having no fat throughout development. At birth, transgenic mice account for half of the pups, indicating no prenatal death. However, by weaning at 3–4 weeks, only 30% (62 of 210) of the surviving pups were transgenic, females outnumbering males (1.23 to 1.00). Survival after weaning was also reduced (Fig. 7). The A-ZIP/F-1 mice were susceptible to death after anesthesia, with 25% mortality (5 of 20) after Avertin anesthesia (0.375 mg/gram intraperitoneally), compared to no deaths in the controls.
Figure 7.
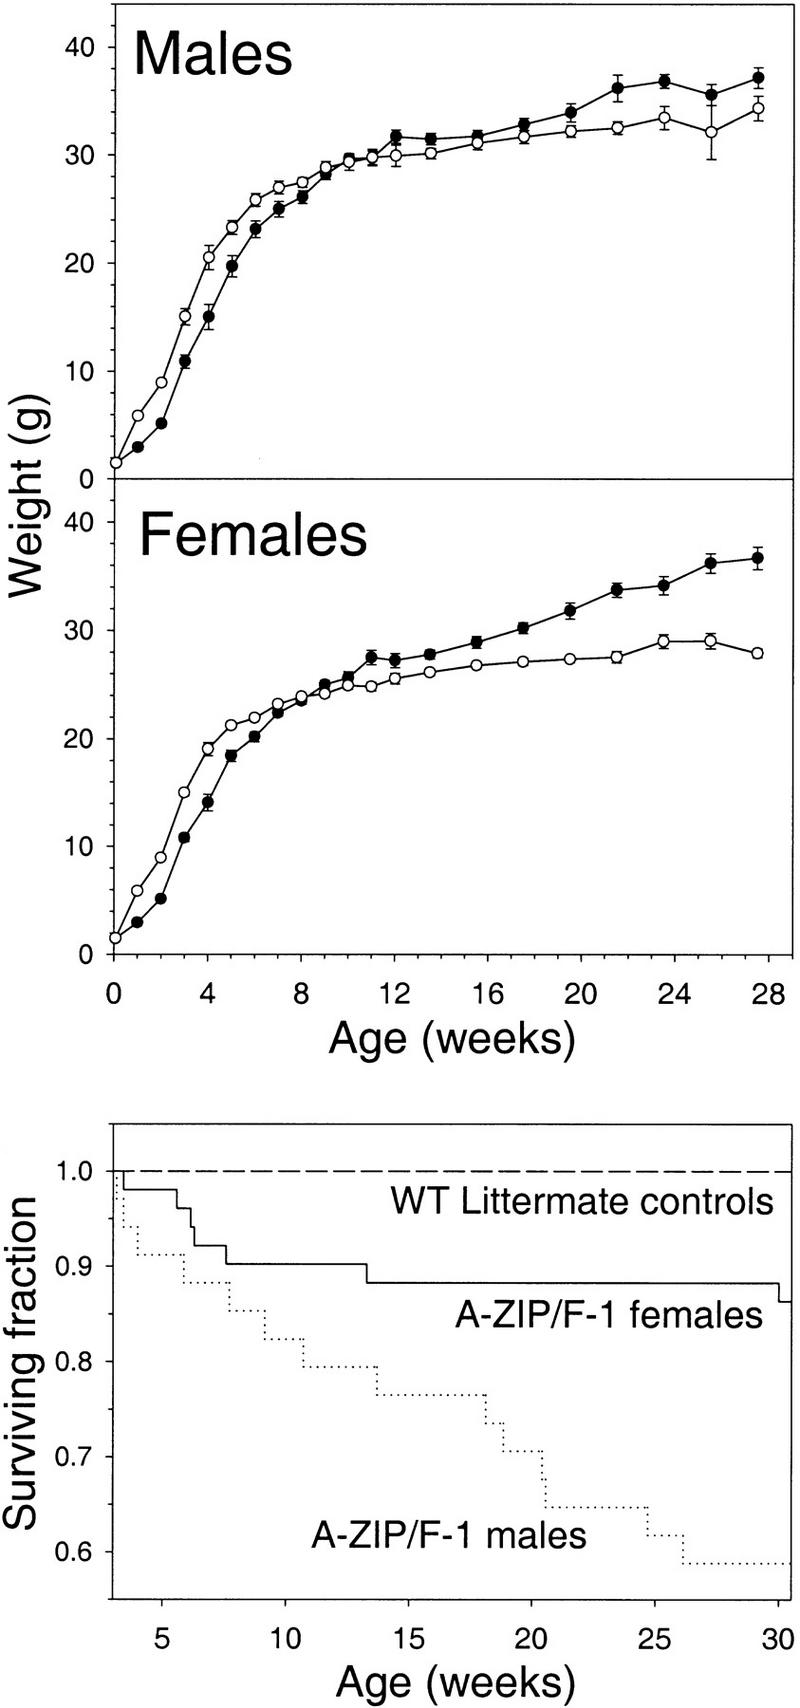
Growth and survival of A-ZIP/F-1 mice. (Top) A-ZIP/F-1 (•) and littermate [wild-type (○)] controls were weighed, and the data were binned using 1-week (3–12 weeks) or 2-week (12–28 weeks) intervals. Data for the 1-, 7-, and 14-day-old mice include both sexes (gender differences did not appear until 4 weeks) and are presented in both panels. Data are mean ± s.e.m., n = 6–35. The A-ZIP/F-1 mice weighed less than wild-type mice (P < 0.05) from 1 to 7 weeks. Female A-ZIP/F-1 mice were significantly heavier for all points >11 weeks, whereas the difference in males was significant only at weeks 20 and 22. (Bottom) Mortality from weaning to 30 weeks in A-ZIP/F-1 mice. Survival analysis (Kaplan-Meier; Altman 1991) is based on 34 males and 51 females. None of the littermate controls died.
At birth, the A-ZIP/F-1 mice are of normal size, but by 1 week, they are only half the size of their wild-type littermates and at weaning are 80% wild-type weight (Fig. 7). By weeks 8–11, they weigh the same as littermates and eventually weigh more. Adult A-ZIP/F-1 mice were polyphagic, eating 1.7 times more than littermate controls (Table 2). When A-ZIP/F-1 mice were fed the same amount of food as their littermates, they lost 19% of their body weight in 2 days. The transgenic mice had polyuria, with greatly increased urine output. A-ZIP/F-1 mice also showed polydypsia, drinking four times more than their littermates (32 ml/day, compared to 7 ml/day; Table 2). The polyphagia, polyuria, and polydypsia observed in the A-ZIP/F-1 mice are the hallmark clinical triad of diabetes mellitus.
Table 2.
Food intake in A-ZIP/F-1 mice
|
|
Initial weight (grams)
|
Final weight (grams)
|
Food intake (grams/day per mouse)
|
Water intake (ml)
|
|---|---|---|---|---|
| A-ZIP/F-1 | 23.9 ± 2.6 | 24.1 ± 2.8 | 5.61 ± 3.3 | 35.1 ± 4.2 |
| Wild type | 25.5 ± 2.9 | 25.4 ± 3.3 | 3.25 ± 0.4 | 7.6 ± 0.7 |
| Ratio | 0.94 | 0.95 | 1.73 | 4.63 |
| P | ns | ns | 7 × 10⁻⁷ | 8 × 10⁻⁵ |
Food and water intake were measured in female A-ZIP/F-1 and littermate mice using six mice per group. Mice (9–15 weeks old) were housed three/cage, and food consumption was measured daily for 10 days. Data are mean ± s.e.m. Water intake was measured in a separate experiment with individually housed mice. Ratio is the A-ZIP/F-1 value expressed as a fraction of the wild-type value. Probabilities are from two-tailed t-test.
Adult A-ZIP/F-1 mice are diabetic
Glucose levels were measured to determine whether the adult mice are indeed diabetic, as suggested by the clinical symptoms. Hyperglycemia, the defining feature of diabetes mellitus, is present with serum glucose being increased 3.4-fold to 788 mg/dl in males and 3.1 fold, to 670 mg/dl, in females (Fig. 8). Glucose was also present in the urine (4+ glucosuria). The degree of hyperglycemia was severe, at the upper end of the glucose levels observed in murine models of diabetes. As expected from the hyperglycemia, the A-ZIP/F-1 mice were hyperosmotic (356 vs. 334 milliosmolar). Hyperglycemia can be accompanied by either low or high blood insulin levels, depending on whether the pancreatic islet β cells stop producing insulin (type 1 or juvenile diabetes) or target tissues fail to respond to high insulin levels (type 2 or noninsulin-dependent diabetes). In A-ZIP/F-1 mice, the serum insulin levels were massively increased, 58-fold in males and 442-fold in females (Fig. 8). These insulin levels are higher than typically found in other models of diabetes, such as the ob/ob and db/db mice (Coleman 1978).
Figure 8.
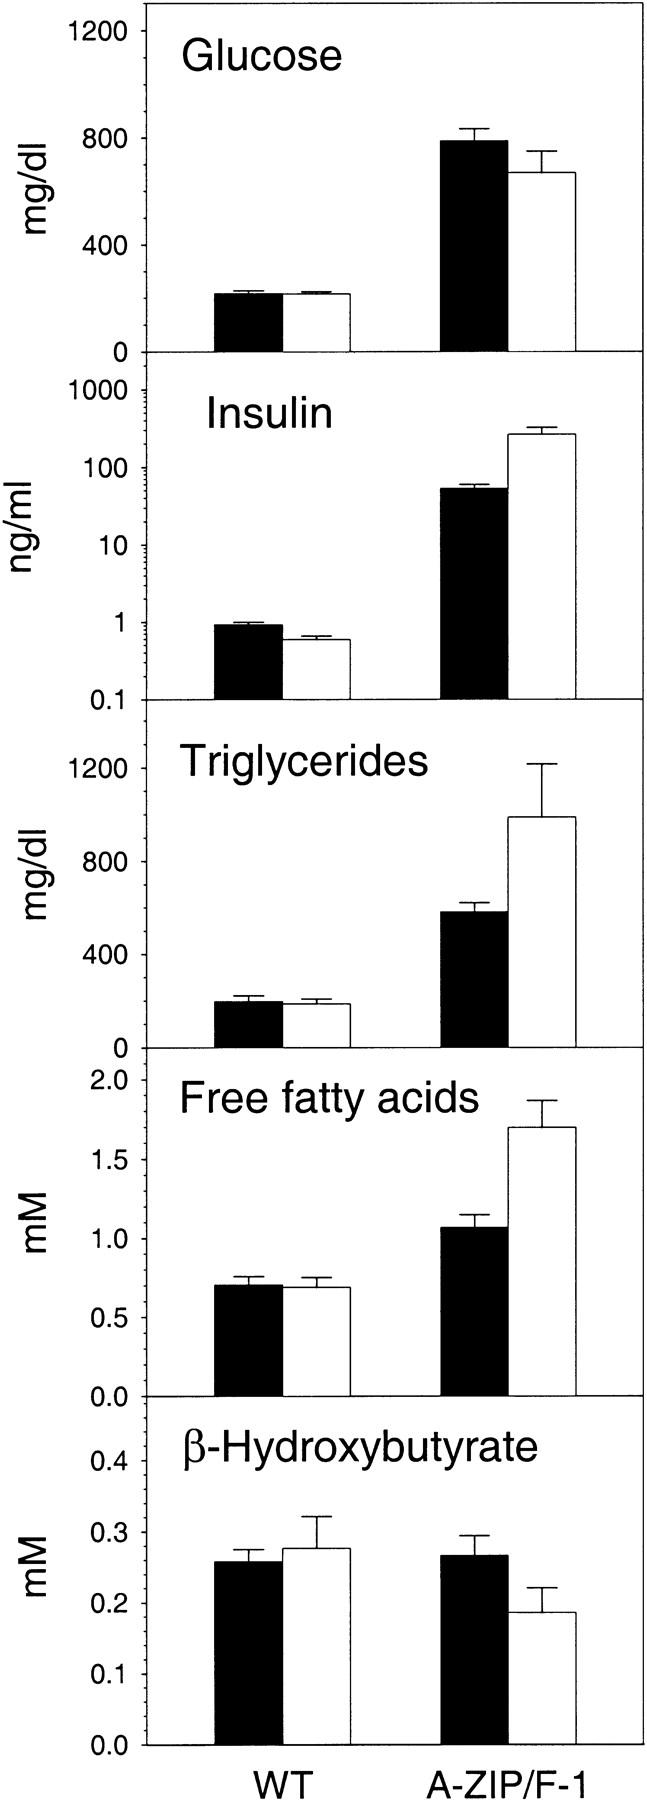
Adult A-ZIP/F-1 mice are diabetic. Blood was obtained from A-ZIP/F-1 mice and nontransgenic wild-type controls, aged 6–23 weeks in the nonfasting state (males, solid bars; females, open bars). Serum glucose, insulin, triglycerides, free fatty acids, and β-hydroxybutyrate were measured as detailed in Materials and Methods. The insulin panel uses a log scale. Data are mean ± s.e.m., with n = 16–20 per group (except for β-hydroxybutyrate, with n = 10 and wild-type insulin, with n = 6 and 7 per group). The glucose, insulin, triglyceride, and free fatty acids levels were elevated in A-ZIP/F-1 mice compared with their sex-matched controls at P<0.01. The insulin (P = 0.04) and free fatty acids (P = 0.005) levels differed between the male and female A-ZIP-1 mice.
We measured triglyceride, free fatty acid, and β-hydroxybutyrate concentrations in the plasma of A-ZIP/F-1 and control mice. Triglycerides, which are carried in the circulation as lipoprotein particles, were elevated 3.0- and 5.3-fold in male and females, respectively (Fig. 8). Cholesterol levels were minimally elevated [188 ± 14 mg/dl vs. 167 ± 12 mg/dl (n = 5 for both)]. Free fatty acids are a circulating energy source. A-ZIP/F-1 mice have a 1.5- to 2.5-fold elevation in their free fatty acids levels in the fed state (Fig. 8). β-Hydroxybutyrate, a ketone, is produced by the liver from free fatty acids at times of low glucose, low insulin, and high glucagon levels. Ketones are used as an energy source, particularly by the brain. Plasma β-hydroxybutyrate levels were unchanged in the A-ZIP/F-1 mice (Fig. 8). Urine ketones were absent (data not shown), confirming the lack of ketosis in these mice despite the elevated free fatty acids levels. Taken together, these data demonstrate that A-ZIP/F-1 mice are hyperglycemic with severe insulin resistance, very high insulin levels, and without elevated ketones. These are the hallmark characteristics of type 2 diabetes.
Development of the diabetic phenotype
The A-ZIP/F-1 line is remarkable for its lack of WAT starting from birth. To see whether diabetes is present in young mice, we measured the glucose, insulin, and free fatty acids levels weekly during the first 5 weeks (Fig. 9). Remarkably, the insulin levels were already 30-fold elevated at week 1. Free fatty acids were also increased by the first week, as was liver size (8.1% of body weight, compared with 3.5% in littermates). In contrast, glucose levels were normal at weeks 1 and 2, barely elevated at week 3, and only reached diabetic levels at 4 weeks of age. These results demonstrate that the hyperinsulinemia and increased free fatty acids precede the elevation in blood glucose by 3 weeks.
Figure 9.
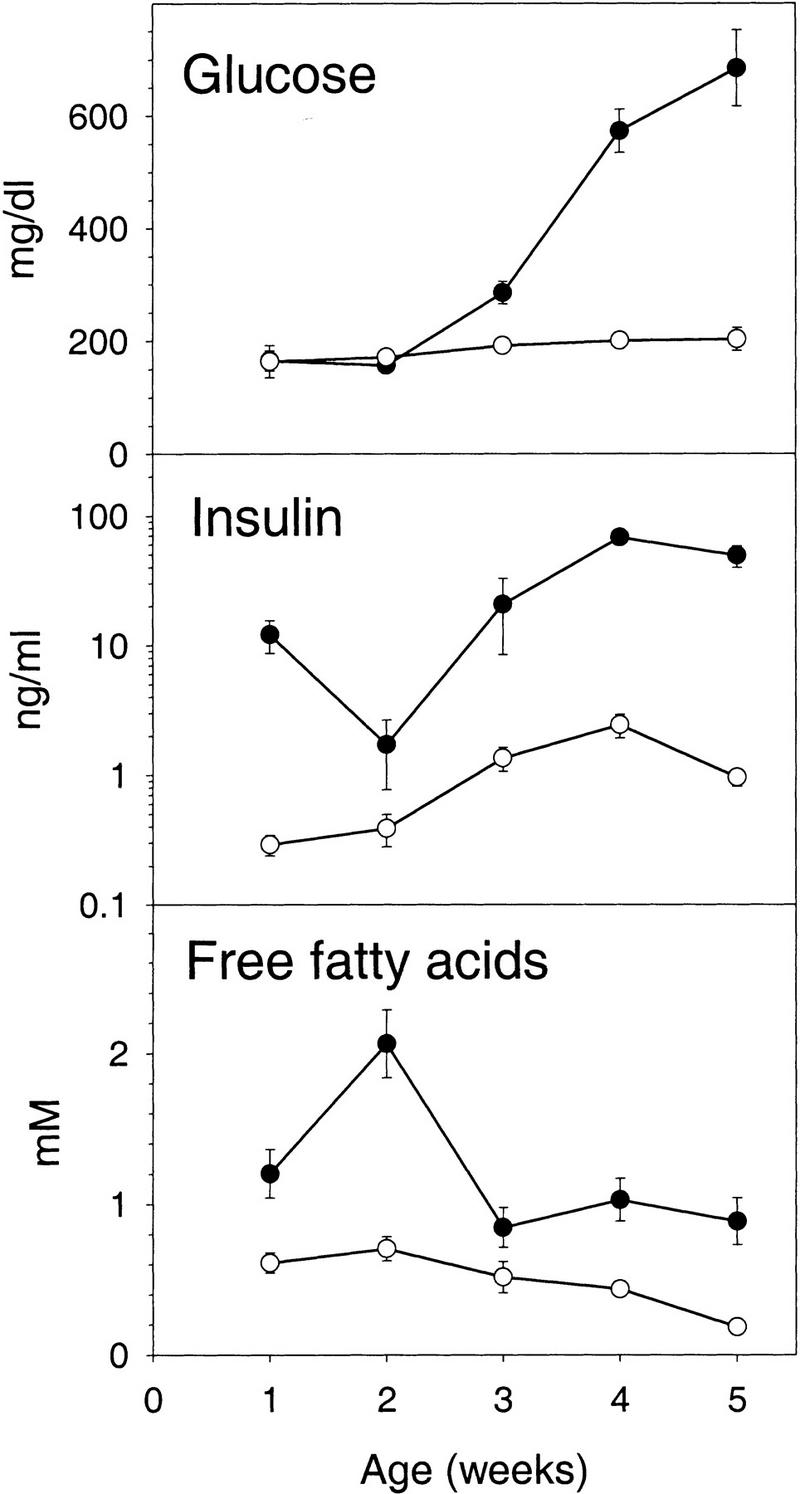
Development of diabetes in A-ZIP/F-1 mice after birth. Glucose, insulin, and free fatty acids were measured in A-ZIP/F-1 (•) and littermate (○) control mice. Samples were serum from exsanguination for weeks 1–3 and tail vein plasma for weeks 4 and 5. Data are mean ± s.e.m., n = 5–6 per group.
A-ZIP/F-1 mice have reduced leptin
Leptin is a hormone secreted by both white and brown adipose cells in proportion to fat mass. It regulates energy homeostasis by decreasing food intake and increasing activity, sympathetic tone, energy expenditure, and insulin sensitivity (for review, see Flier 1997). Circulating leptin levels in A-ZIP/F-1 mice were measured by Western blotting. In two pooled samples, leptin was reduced ∼10-fold to 0.6 and 1.0 ng/ml. Sixty to seventy percent of the A-ZIP/F-1 leptin was in a high molecular weight complex, as compared with 30% to 40% in control mice (Gavrilova et al. 1997; data not shown). Thus, the free, active leptin concentration in A-ZIP/F-1 mice is only ∼5% of wild-type mice. This leptin is produced in BAT (Fig. 4B).
Leptin is important for male and female sexual maturation and fertility (Chehab et al. 1996). Unlike ob/ob mice, which are totally deficient in leptin and remain sexually immature, A-ZIP/F-1 mice become fertile, but are not as fertile as wild-type mice. We measured the effect of leptin treatment on A-ZIP/F-1 mice, to investigate whether leptin deficiency accounts for their decreased fecundity. During an 8-day control interval, five male A-ZIP/F-1 mice, each housed with two wild-type females, produced a total of only two plugged females. Leptin treatment of the A-ZIP/F-1 mice did not alter the rate, with only two more plugged females during 14 days of treatment. Testosterone levels in A-ZIP/F-1 mice (with or without leptin treatment) were comparable with littermates. These data suggest that the poor fecundity of the A-ZIP/F-1 line is attributable to more than leptin deficiency.
A-ZIP/F-1 mice are unable to respond to fasting
Because the major function of WAT is to store energy for lean times, we studied the effect of fasting on A-ZIP/F-1 mice. During a 24-hr fast (Fig. 10), the A-ZIP/F-1 mice lost more weight than their littermates (6.7 vs. 3.5 grams). The glucose dropped slightly in the controls (210 to 134 mg/dl), but plummeted in the A-ZIP/F-1 animals (903 to 124 mg/dl) to wild-type levels. A drop in insulin drives the metabolic adaptation to fasting. Insulin levels in the A-ZIP/F-1 mice dropped from 359 to <3 ng/ml during the fast. Thus the pancreatic β cells, which are secreting very large amounts of insulin in the fed state, still retain their ability to decrease insulin secretion in response to decreased glucose.
Figure 10.
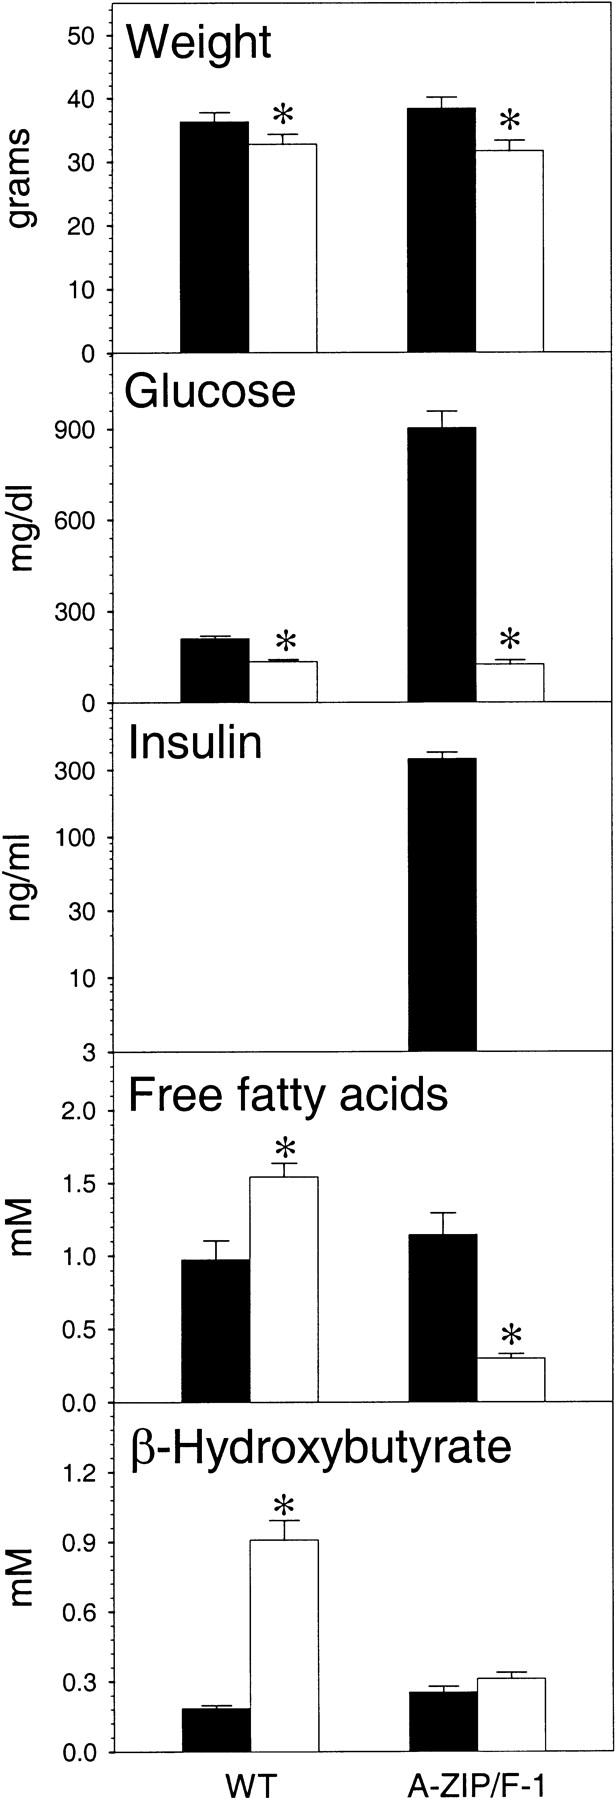
Effect of fasting on A-ZIP/F-1 and wild-type mice. Male A-ZIP/F-1 and littermate wild-type controls, aged 23 weeks, were fasted for 24 hr (1:00 pm to 1:00 pm). Tail vein blood was obtained at the start (fed, solid bars) and conclusion (fasted, open bars) of the fast. Serum glucose, insulin, free fatty acids, and β- hydroxybutyrate were measured as detailed in Materials and Methods. Insulin was not measured in the wild-type mice and was undetectable in the fasted A-ZIP/F-1 mice (detection limit: 3 ng/ml). Data are mean ± s.e.m., n = 5 per group. (*) Difference at P ≤ 0.001, except for P = 0.02 for free fatty acids.
Another striking result was the change in the free fatty acids levels during fasting. During fasting, WAT triglycerides are hydrolyzed and released as free fatty acids. The free fatty acids are metabolized to ketone bodies, such as β-hydroxybutyrate, by the liver. In wild-type mice before fasting, the free fatty acids were 0.97 mm (higher than usual as a result of starting the fast at a relatively late time during the light cycle) and appropriately increased to 1.54 mm with fasting. In contrast, the A-ZIP/F-1 mice did not increase their free fatty acids, but paradoxically dropped them by 0.84 mm (from 1.14 to 0.30 mm). We attribute this drop to the inability of the A-ZIP/F-1 mice to replenish their circulating free fatty acids as a result of the lack of adipose stores. Indeed, the control mice increased their β-hydroxybutyrate by 394%. In contrast, the A-ZIP/F-1 mice were unable to do this. Taken together, these data demonstrate that A-ZIP/F-1 are unable to respond appropriately to fasting, which we attribute to their lack of sufficient mobilizable lipid stores.
Discussion
This report presents a novel dominant-negative approach that inhibits gene expression. This approach was used to ablate fat tissue growth and differentiation. The dominant-negative protein has properties not expected from simple deletions of existing genes or from genetic screens. The profound adverse physiological consequences of having no WAT and severely reduced BAT throughout mouse development are described.
Other lean mouse models exist. While the mechanism is obscure in some (Luetteke et al. 1993; Benson and Chada 1994), a number probably have alterations in adipose tissue formation or function (Kozak et al. 1991, 1996; Ross et al. 1993; Katz et al. 1995; Kopecky et al. 1995; Levak-Frank et al. 1995; Wang et al. 1995; Cummings et al. 1996; Soloveva et al. 1997). In the experiments most relevant to ours, the aP2 enhancer/promoter was used to drive adipose expression of the diphtheria toxin A chain. High-level expression caused neonatal death, while lower levels produced loss of fat in aging mice (Ross et al. 1993; Burant et al. 1997). None of the previous models produced viable mice lacking WAT throughout development, suggesting that WAT is essential for life. The viability of the A-ZIP/F-1 mice, however, demonstrates that WAT is not essential for life.
Dominant-negative A-ZIP/F inhibits AP-1 and C/EBP transcription factors
WAT growth and differentiation are regulated by sequence-specific DNA binding proteins in the AP-1 and C/EBP B-ZIP families. AP-1 factors promote precursor cell proliferation (Distel et al. 1987; Stephens et al. 1992). C/EBP factors mediate adipocyte differentiation via a sequential pattern of expression beginning with C/EBPδ and C/EBPβ and followed by C/EBPα (Mandrup and Lane 1997). The designed dominant-negative protein, A-ZIP/F, contains a promiscuous leucine zipper, termed ZIP/F, which heterodimerizes with either Jun or C/EBP family members. We do not know which of these families is critical for the phenotype. More selective B-ZIP dominant-negative proteins that inhibit only C/EBP or Jun families have been designed and transgenic mice generated. Two A-C/EBP lines have a adipocyte phenotype milder than A-ZIP/F-1 mice, suggesting that the inhibition of both Jun and C/EBP function is critical for the severe phenotype of the A-ZIP/F-1 mice.
Ablation of adipose tissue in A-ZIP/F-1 mice
The adult A-ZIP/F-1 mice contain inactive BAT that expresses 2 million copies of the A-ZIP/F protein per cell. Among C/EBP regulated genes, UCP1 expression is diminished, but leptin, aP2, and PPARγ are expressed at unaltered levels. These results suggest that not all C/EBP-driven promoters respond similarly to the dominant-negative action of A-ZIP/F. We suggest that this difference is attributable to the temporal lag or lead in the switching of these promoters compared with the aP2 promoter, which drives production of the A-ZIP/F mRNA. Promoters that are presumably switched on later in development than aP2 are more affected than those switched on earlier.
A similar temporal mechanism may help us understand why WAT is ablated in the A-ZIP/F-1 mice while BAT is merely reduced in amount and inactive. Appearing earlier in development, BAT grows to a point where its further maturation is interrupted by newly synthesized A-ZIP/F molecules, while WAT, appearing later in development, is affected immediately by A-ZIP/F molecules, precluding proliferation. Another possibility is that A-ZIP/F-1 mice might turn off BAT as a homeostatic response to an altered metabolic status. In this case, the residual tissue might approximate the response of normal BAT to an abnormal environment. The absence of WAT precludes a direct comparison of the BAT and WAT transcriptional milieus in A-ZIP/F-1 mice.
Physiology of the A-ZIP/F-1 line
The A-ZIP/F-1 phenotype includes poor fertility, organomegaly, elevated glucose, insulin, free fatty acids, and triglycerides, low leptin, and early death. The phenotype is attributed to the lack of WAT, disrupting energy storage and communication among the tissues of the body, including signals from both WAT and the rest of the body to WAT. Without WAT to take up and store free fatty acids/triglycerides derived mainly from diet and hepatic production, blood levels become elevated. Increased circulating free fatty acids have been proposed to cause increased blood glucose via the glucose–fatty acid cycle, in which muscle uses free fatty acids as a fuel in preference to glucose (Randle et al. 1963; McGarry 1992). The resulting increased blood glucose levels, in turn, lead to more insulin secretion and pancreatic islet β-cell hypertrophy and hyperplasia. Free fatty acids, known ligands for transcription factors, might also cause insulin resistance via transcriptional mechanisms. The resulting extraordinarily high insulin levels are sufficient for cross-talk activation of IGF-1 receptors (Smith et al. 1988). IGF-1 receptor stimulation plausibly explains the enlarged organs and continued adult growth of the A-ZIP/F-1 mice.
The diabetes of the A-ZIP/F-1 mice is notable for its lack of ketosis, with low β-hydroxybutyrate despite elevated free fatty acids. One explanation is that the high insulin levels communicate a fed status to the liver. Thus, enough of this insulin signal is transmitted to the hepatocytes to prevent ketogenesis. Direct studies of insulin signaling in A-ZIP/F-1 liver and muscle are in progress to determine whether there are different levels of insulin resistance in these tissues. Another possible explanation is that the livers in A-ZIP/F-1 mice are geared more toward lipogenesis than lipolysis, which might prevent ketogenesis even in the face of a sharp drop in blood glucose levels. It is interesting to note that the three rate-limiting fatty acid-synthesizing enzymes whose levels are elevated in A-ZIP/F-1 mice, are both transcriptionally and post-translationally regulated by insulin (Fukuda et al. 1997a,b; Gamble and Lopaschuk 1997).
Lack of adipose tissue in A-ZIP/F-1 mice causes leptin deficiency. Low leptin levels contribute to the insulin resistance, since leptin-deficient ob/ob mice are diabetic (Coleman 1978). Leptin also increases muscle glucose utilization (Kamohara et al. 1997), enhances insulin’s inhibition of hepatic glucose production (Rossetti et al. 1997), and is required for sexual maturation and fertility (Chehab et al. 1996). However, injection of leptin did not restore A-ZIP/F-1 fecundity, suggesting that fat is also needed for reproductive function via leptin-independent mechanisms.
The inability of the mice to survive fasting confirms the role of WAT in supplying energy (as free fatty acids) for utilization during starvation. Recent experiments show that the A-ZIP/F-1 mice run out of energy reserves remarkably rapidly (O. Gavrilova, unpubl.). BAT thermogenesis is also severely compromised in A-ZIP/F-1 mice (O. Gavrilova, unpubl.).
A-ZIP/F-1 mice are a model for lipoatrophic diabetes
The A-ZIP/F-1 phenotype is strikingly similar to that of humans with severe lipoatrophic diabetes (particularly congenital generalized lipodystrophy, the Seip-Berardinelli syndrome). The human lipodystrophies are a heterogenous group of disorders characterized by decreased fat mass, insulin resistance, and elevated triglycerides (Foster 1994; Seip and Trygstad 1996). Both genetic and acquired forms (presumably autoimmune) are known. Lipodystrophic diabetes was recently recognized as a complication of protease inhibitor treatment of HIV infection (Carr et al. 1998).
The similarities of the A-ZIP/F-1 phenotype and lipoatrophic diabetes include nonketotic diabetes, hypertriglyceridemia, hepatic steatosis, alveolar foam cells, organomegaly, and hyperphagia (Table 3). Humans with severe lipoatrophic diabetes often die from complications of diabetes. A-ZIP/F-1 mice also die prematurely, possibly as a result of high glucose causing a hyperosmolar state. In addition to the similarities above, both lipoatrophic humans and A-ZIP/F-1 mice have an increased metabolic rate, which we attribute to their organomegaly (O. Gavrilova, unpubl.). A-ZIP/F-1 lipoatrophic diabetes is a consequence of the absence of fat, suggesting that a lack of fat is causative for the human disease.
Table 3.
A-ZIP/F-1 vs. lipoatrophic diabetes
|
|
A-ZIP/F-1
|
Lipoatrophic diabetes
|
|---|---|---|
| Absence of adipose | + | + |
| Hyperglycemia | + | + |
| Hyperinsulinemia | + | + |
| Ketoacidosis | − | − |
| Fatty liver | + | + |
| Cirrhosis | − | varies |
| Hyperlipidemia | + | + |
| Increased metabolic rate | + | + |
Lipoatrophy is paradoxical, with the lack of fat causing diabetes. The usual scenario is that obesity causes type 2 diabetes. Thus it is important to examine the similarities between lipoatrophic and type 2 diabetes. As postulated above, increased free fatty acids may cause lipoatrophic diabetes and a role for free fatty acids has also been proposed in type 2 diabetes (McGarry 1992). Alternatively, lack of WAT in A-ZIP/F-1 mice may cause diabetes by a different mechanism from that which occurs in obese mice. The fact that the increased glucose in A-ZIP/F-1 mice first appears upon weaning suggests that it may be correlated with the metabolic changes that occur at this time. Availability of the A-ZIP/F-1 model will allow examination of these questions. The effect of limiting food intake on the A-ZIP/F-1 phenotype will be important to examine.
Beneficial effects of adipose tissue
Obesity is a major cause of death in America and is a significant risk factor for type 2 diabetes, hypertension, and coronary artery disease (Thomas 1995). Currently, a major health care goal is reduction of the prevalence of obesity in the human population. However, the A-ZIP/F-1 line indicates that adipose tissue has some beneficial effects, particularly on growth, reproductive function, glucose metabolism, and the ability to tolerate fasting.
Materials and methods
DNA-binding assay
Escherichia coli-produced recombinant B-ZIP protein domains were mixed with double-stranded 32P-labeled DNA and resolved on 8% polyacrylamide gels in 0.5 × TBE buffer at room temperature (Krylov et al. 1995). Proteins (2 μl of 5 × 10⁻⁶ m of dimer) were heated (10 min, 65°C) in the presence of 1 mm DTT and added to 20 μl of the gel-shift reaction buffer (25 mm Tris at pH 8.0, 50 mm KCl, 0.5 mm EDTA, 2.5 mm DTT, 1 mg/ml bovine serum albumin, 10% glycerol), incubated for 10 min at 25°C, then mixed with 8 pg of the indicated probe (32P-labeled double-stranded oligonucleotide). The DNA sequences of the sense strands are: AP-1, 5′-GTCAGTCAGTGACTCAATCGGTCA-3′; CREB, 5′-GTCAGTCAGTGACGTCAATCGGTCA-3′; and C/EBP, 5′-GTCAGTCAGATTGCGCAATATCGGTCA-3′. The binding sites are in boldface type.
Transgenic mice
The plasmid directing fat-specific expression of A-ZIP/F was constructed by use of standard cloning procedures (Ausubel 1997) as follows. The 7621-bp aP2 gene enhancer/promoter (Spiegelman et al. 1983; Bernlohr et al. 1984; Cook et al. 1988) was obtained from Dr. M.D. Lane (Johns Hopkins University, Baltimore, MD) as p422-CAT Basic. The aP2 promoter, isolated as a HindIII–PstI (partial) fragment, was cloned into pBluescriptKS+ (Stratagene) and denoted Bluescript aP2. A 298-bp PCR fragment contained A-ZIP/F (Flag-φ10- GGG-3heptad-F; previously, 3heptad-F; MDYKDDDDK*ASMTGGQQMGRDP-*GGGLARENEELEKEAEELEQENAE*LEQEVLELESRNDRLR-KEVEQLERELDTLRGIFRQLPESSLVKAMGNCA; Krylov et al. 1995). PstI (partial)–SmaI ends of A-ZIP/F was cloned into Bluescript aP2 to produce Bluescript aP2 A-ZIP/F. A KpnI site was included 3′ of the PstI site to facilitate future cloning. Independently, a 1017-bp SmaI–BamHI fragment containing the SV40 splice site and poly(A) site (obtained from pRSVneo; Gorman et al. 1982) was cloned into pBluescriptKS+ to produce Bluescript SV40 poly(A). A 7919-bp HindIII–SmaI fragment from Bluescript aP2 A-ZIP/F was cloned into Bluescript SV40 poly(A) to produce the final construct Bluescript aP2 A-ZIP/F SV40 poly(A).
For microinjection, a 9036-bp DNA fragment containing the aP2 promoter, A-ZIP/F, and the SV40 splice, and poly(A) sites (Fig. 2A) was obtained free of vector sequences by HindIII–NotI digestion and gel purification. Transgenic FVB/N mice (Taketo et al. 1991) were produced by microinjection into male pronuclei (Hogan et al. 1994) and screened by PCR on tail DNA with transgene-specific (x360, 5′-CTGTGCTGCAGACCACCATGG-3′, and x361, 5′-CCGCGAGGTCGTCCAGCCTCA-3′, giving a 332-bp product) and endogenous βmaj-globin primers (Reitman et al. 1993). Litters were reared in heated cages until weaning. Mice were maintained on a 12-hr light/dark cycle and a standard pellet diet (NIH-07, 5% fat). They were bled via the tail vein in the nonfasting state, usually near the midpoint of the light period.
Isolation and analysis of RNA
RNA was extracted using RNA STAT-60 (Tel-Test, Friendswood, TX). Northern blots (on Maximum Strength Nytran Plus; Schleicher & Schuell) were hybridized by use of Rapid-hyb (Amersham) according to the manufacturer’s instructions and exposed to film or quantitated with a PhosphorImager. Probes used were: mouse leptin (bp 50–566 in GenBank U18812), A-ZIP/F (885-bp PstI–BamHI 3′ UTR fragment including only SV40 sequences), mouse aP2 (453-bp coding region fragment; Bernlohr et al. 1984), rat UCP1 (bp 84–1154 in GenBank accession no. M11814), rat C/EBPα (1058-bp NcoI coding region fragment; Landschulz et al. 1988), and mouse PPARγ (900-bp EcoRI fragment; Tontonoz et al. 1994).
Assays
Glucose was measured with a Glucometer Elite (Bayer). Insulin was measured by radioimmune assay (RIA) (Linco, St. Charles, MO) with rat insulin as the standard. Triglycerides, free fatty acids, β-hydroxybutyrate, and glycosylated hemoglobin were assayed with commercially available kits (Sigma and Boehringer Mannheim). Leptin was measured by Western blotting after immunoprecipitation (Barr et al. 1997) because RIA (Linco) was not reliable at the low levels of the A-ZIP/F-1 samples. Bound leptin was measured by gel filtration (Gavrilova et al. 1997). Serum chemistries were performed by Ani Lytics (Gaithersburg, MD). Osmolarity was calculated as 2[Na]+2[K]+[glucose]/18+[BUN]/2.8 with [Na] and [K] in mm, [glucose] in mg/dl, and [BUN] in mg/dl. Statistical significance was determined using two-tailed t-tests (paired and unpaired, as appropriate).
A-ZIP/F protein concentration in A-ZIP/F-1 residual adipose tissue were determined by Western blotting with recombinant E. coli protein (Flag-φ10-4heptad-Fos; Olive et al. 1997) as a standard. The A-ZIP/F amino-terminal Flag epitope was detected by use of anti-Flag M5 mouse monoclonal antibody (Kodak). Tissue (50 mg) was homogenized with a polytron in 150 μl of ice-cold RIPA buffer (containing 100 mg/ml PMSF and 300 mg/ml aprotinin), incubated (on ice, 30 min), spun (15,000g, 20 min, 4°C), the disc of lipid floating at the top removed, and the supernatant collected and spun as before. These samples were snap frozen and stored at −80°C until use. A total of 60 μg of lysate protein was mixed with an equal volume of 2× SDS sample buffer, boiled for 5 min, and loaded onto a 15% SDS polyacrylamide gel. To determine the number of cells, DNA content was measured by DAPI fluorescence (Brunk et al. 1979), assuming 6 pg of DNA per diploid cell.
The effect of leptin on the fecundity of male A-ZIP/F-1 was measured with five male A-ZIP/F-1 mice (9–28 weeks old), each housed with two female mice. After an 8-day base line, males were injected daily with leptin (1 μg/g body weight, intraperitoneally) for 14 days. The females were examined for vaginal plugs daily and plugged females were replaced daily.
Acknowledgments
We thankfully acknowledge the gift of the aP2 (422) promoter from M. Daniel Lane and the SV40 polyadenylation fragment from Bruce Patterson. We also thank Heiner Westphal for generation of the founders, Valarie Barr for the leptin Westerns, Laszlo Szilak for help with the graphics, Asa Dorsey for animal care, and Elif Arioglu, Anna Mae Diehl, Frank Gonzalez, Robert Millar, and Simeon Taylor for stimulating discussions.
The publication costs of this article were defrayed in part by payment of page charges. This article must therefore be hereby marked ‘advertisement’ in accordance with 18 USC section 1734 solely to indicate this fact.
Footnotes
E-MAIL mlr@helix.nih.gov; vinsonc@dc37a.nci.nih.gov; FAX (301) 402-0573; (301) 402-3095.
References
- Ahn S, Olive M, Aggarwal S, Krylov D, Ginty DD, Vinson C. A dominant-negative inhibitor of CREB reveals that it is a general mediator of stimulus-dependent transcription of c-fos. Mol Cell Biol. 1998;18:967–977. doi: 10.1128/mcb.18.2.967. [DOI] [PMC free article] [PubMed] [Google Scholar]
- Ailaud G, Hauner H. Development of white adipose tissue. In: Bray GA, Bouchard C, James WPT, editors. Handbook of obesity. New York, NY: Marcel Dekker; 1998. pp. 359–378. [Google Scholar]
- Altman DG. Practical statistics for medical research. London, UK: Chapman & Hall; 1991. [Google Scholar]
- Aoyama T, Souri M, Kamijo T, Ushikubo S, Hashimoto T. Peroxisomal acyl-coenzyme A oxidase is a rate-limiting enzyme in a very-long-chain fatty acid beta-oxidation system. Biochem Biophys Res Commun. 1994;201:1541–1547. doi: 10.1006/bbrc.1994.1879. [DOI] [PubMed] [Google Scholar]
- Aoyama T, Peters JM, Iritani N, Nakajima T, Furihata K, Hashimoto T, Gonzalez FJ. Altered constitutive expression of fatty acid-metabolizing enzymes in mice lacking the peroxisome proliferator-activated receptor α (PPARα) J Biol Chem. 1998;273:5678–5684. doi: 10.1074/jbc.273.10.5678. [DOI] [PubMed] [Google Scholar]
- Ausubel FM, Brent R, Kingston RE, Moore DD, Seidman JG, Smith JA, Struhl K. Current protocols in molecular biology. New York, NY: Wiley; 1997. [Google Scholar]
- Barr VA, Malide D, Zarnowski MJ, Taylor SI, Cushman SW. Insulin stimulates both leptin secretion and production by rat white adipose tissue. Endocrinology. 1997;138:4463–4472. doi: 10.1210/endo.138.10.5451. [DOI] [PubMed] [Google Scholar]
- Benson KF, Chada K. Mini-mouse: Phenotypic characterization of a transgenic insertional mutant allelic to pygmy. Genet Res. 1994;64:27–33. doi: 10.1017/s0016672300032511. [DOI] [PubMed] [Google Scholar]
- Bernlohr DA, Angus CW, Lane MD, Bolanowski MA, Kelly TJ., Jr Expression of specific mRNAs during adipose differentiation: Identification of an mRNA encoding a homologue of myelin P2 protein. Proc Natl Acad Sci. 1984;81:5468–5472. doi: 10.1073/pnas.81.17.5468. [DOI] [PMC free article] [PubMed] [Google Scholar]
- Bernlohr DA, Doering TL, Kelly TJ, Jr, Lane MD. Tissue specific expression of p422 protein, a putative lipid carrier, in mouse adipocytes. Biochem Biophys Res Commun. 1985;132:850–855. doi: 10.1016/0006-291x(85)91209-4. [DOI] [PubMed] [Google Scholar]
- Bouillaud F, Ricquier D, Thibault J, Weissenbach J. Molecular approach to thermogenesis in brown adipose tissue: cDNA cloning of the mitochondrial uncoupling protein. Proc Natl Acad Sci. 1985;82:445–448. doi: 10.1073/pnas.82.2.445. [DOI] [PMC free article] [PubMed] [Google Scholar]
- Brunk CF, Jones KC, James TW. Assay for nanogram quantities of DNA in cellular homogenates. Anal Biochem. 1979;92:497–500. doi: 10.1016/0003-2697(79)90690-0. [DOI] [PubMed] [Google Scholar]
- Burant CF, Sreenan S, Hirano K, Tai TA, Lohmiller J, Lukens J, Davidson NO, Ross S, Graves RA. Troglitazone action is independent of adipose tissue. J Clin Invest. 1997;100:2900–2908. doi: 10.1172/JCI119839. [DOI] [PMC free article] [PubMed] [Google Scholar]
- Carr A, Samaras K, Chisholm DJ, Cooper DA. Pathogenesis of HIV-1-protease inhibitor-associated peripheral lipodystrophy, hyperlipidaemia, and insulin resistance. Lancet. 1998;351:1881–1883. doi: 10.1016/S0140-6736(98)03391-1. [DOI] [PubMed] [Google Scholar]
- Chehab FF, Lim ME, Lu R. Correction of the sterility defect in homozygous obese female mice by treatment with the human recombinant leptin. Nat Genet. 1996;12:318–320. doi: 10.1038/ng0396-318. [DOI] [PubMed] [Google Scholar]
- Chen H, Charlat O, Tartaglia LA, Woolf EA, Weng X, Ellis SJ, Lakey ND, Culpepper J, Moore KJ, Breitbart RE, Duyk GM, Tepper RI, Morgenstern JP. Evidence that the diabetes gene encodes the leptin receptor: Identification of a mutation in the leptin receptor gene in db/db mice. Cell. 1996;84:491–495. doi: 10.1016/s0092-8674(00)81294-5. [DOI] [PubMed] [Google Scholar]
- Christy RJ, Yang VW, Ntambi JM, Geiman DE, Landschulz WH, Friedman AD, Nakabeppu Y, Kelly TJ, Lane MD. Differentiation-induced gene expression in 3T3-L1 preadipocytes: CCAAT/enhancer binding protein interacts with and activates the promoters of two adipocyte-specific genes. Genes & Dev. 1989;3:1323–1335. doi: 10.1101/gad.3.9.1323. [DOI] [PubMed] [Google Scholar]
- Clarke SL, Robinson CE, Gimble JM. CAAT/enhancer binding proteins directly modulate transcription from the peroxisome proliferator-activated receptor gamma 2 promoter. Biochem Biophys Res Commun. 1997;240:99–103. doi: 10.1006/bbrc.1997.7627. [DOI] [PubMed] [Google Scholar]
- Coleman DL. Obese and diabetes: Two mutant genes causing diabetes-obesity syndromes in mice. Diabetologia. 1978;14:141–148. doi: 10.1007/BF00429772. [DOI] [PubMed] [Google Scholar]
- Comuzzie AG, Allison DB. The search for human obesity genes. Science. 1998;280:1374–1377. doi: 10.1126/science.280.5368.1374. [DOI] [PubMed] [Google Scholar]
- Cook JS, Lucas JJ, Sibley E, Bolanowski MA, Christy RJ, Kelly TJ, Lane MD. Expression of the differentiation-induced gene for fatty acid-binding protein is activated by glucocorticoid and cAMP. Proc Natl Acad Sci. 1988;85:2949–2953. doi: 10.1073/pnas.85.9.2949. [DOI] [PMC free article] [PubMed] [Google Scholar]
- Cummings DE, Brandon EP, Planas JV, Motamed K, Idzerda RL, McKnight GS. Genetically lean mice result from targeted disruption of the RII beta subunit of protein kinase A. Nature. 1996;382:622–626. doi: 10.1038/382622a0. [DOI] [PubMed] [Google Scholar]
- Distel RJ, Ro HS, Rosen BS, Groves DL, Spiegelman BM. Nucleoprotein complexes that regulate gene expression in adipocyte differentiation: Direct participation of c-fos. Cell. 1987;49:835–844. doi: 10.1016/0092-8674(87)90621-0. [DOI] [PubMed] [Google Scholar]
- Flier JS. Leptin expression and action: New experimental paradigms. Proc Natl Acad Sci. 1997;94:4242–4245. doi: 10.1073/pnas.94.9.4242. [DOI] [PMC free article] [PubMed] [Google Scholar]
- Foster DW. The lipodystrophies and other rare disorders of adipose tissue. In: Isselbacher KJ, Braunwald E, Wilson JD, Martin JB, Fauci AS, Kasper DL, editors. Harrison’s principles of internal medicine. New York, NY: McGraw-Hill; 1994. pp. 2131–2136. [Google Scholar]
- Freytag SO, Paielli DL, Gilbert JD. Ectopic expression of the CCAAT/enhancer-binding protein α promotes the adipogenic program in a variety of mouse fibroblastic cells. Genes & Dev. 1994;8:1654–1663. doi: 10.1101/gad.8.14.1654. [DOI] [PubMed] [Google Scholar]
- Fukuda H, Iritani N, Noguchi T. Transcriptional regulatory region for expression of the rat ATP citrate-lyase gene. Eur J Biochem. 1997a;247:497–502. doi: 10.1111/j.1432-1033.1997.00497.x. [DOI] [PubMed] [Google Scholar]
- Fukuda H, Iritani N, Noguchi T. Transcriptional regulatory regions for expression of the rat fatty acid synthase. FEBS Lett. 1997b;406:243–248. doi: 10.1016/s0014-5793(97)00219-6. [DOI] [PubMed] [Google Scholar]
- Gamble J, Lopaschuk GD. Insulin inhibition of 5′ adenosine monophosphate-activated protein kinase in the heart results in activation of acetyl coenzyme A carboxylase and inhibition of fatty acid oxidation. Metabolism. 1997;46:1270–1274. doi: 10.1016/s0026-0495(97)90229-8. [DOI] [PubMed] [Google Scholar]
- Gavrilova O, Barr V, Marcus-Samuels B, Reitman M. Hyperleptinemia of pregnancy associated with the appearance of a circulating form of the leptin receptor. J Biol Chem. 1997;272:30546–30551. doi: 10.1074/jbc.272.48.30546. [DOI] [PubMed] [Google Scholar]
- Gorman CM, Moffat LF, Howard BH. Recombinant genomes which express chloramphenicol acetyltransferase in mammalian cells. Mol Cell Biol. 1982;2:1044–1051. doi: 10.1128/mcb.2.9.1044. [DOI] [PMC free article] [PubMed] [Google Scholar]
- He Y, Chen H, Quon MJ, Reitman M. The mouse obese gene. Genomic organization, promoter activity, and activation by CCAAT/enhancer-binding protein α. J Biol Chem. 1995;270:28887–28891. doi: 10.1074/jbc.270.48.28887. [DOI] [PubMed] [Google Scholar]
- Hill JO, Peters JC. Environmental contributions to the obesity epidemic. Science. 1998;280:1371–1374. doi: 10.1126/science.280.5368.1371. [DOI] [PubMed] [Google Scholar]
- Himms-Hagen J, Ricquier D. Brown adipose tissue. In: Bray GA, Bouchard C, James WPT, editors. Handbook of obesity. New York, NY: Marcel Dekker; 1998. pp. 415–441. [Google Scholar]
- Hogan B, Beddington R, Costantini F, Lacy E. Manipulating the mouse embryo. Cold Spring Harbor, NY: Cold Spring Harbor Laboratory Press; 1994. [Google Scholar]
- Houstek J, Kopecky J, Rychter Z, Soukup T. Uncoupling protein in embryonic brown adipose tissue—existence of nonthermogenic and thermogenic mitochondria. Biochim Biophys Acta. 1988;935:19–25. doi: 10.1016/0005-2728(88)90103-x. [DOI] [PubMed] [Google Scholar]
- Jacobsson A, Stadler U, Glotzer MA, Kozak LP. Mitochondrial uncoupling protein from mouse brown fat. Molecular cloning, genetic mapping, and mRNA expression. J Biol Chem. 1985;260:16250–16254. [PubMed] [Google Scholar]
- Kamohara S, Burcelin R, Halaas JL, Friedman JM, Charron MJ. Acute stimulation of glucose metabolism in mice by leptin treatment. Nature. 1997;389:374–377. doi: 10.1038/38717. [DOI] [PubMed] [Google Scholar]
- Katz EB, Stenbit AE, Hatton K, DePinho R, Charron MJ. Cardiac and adipose tissue abnormalities but not diabetes in mice deficient in GLUT4. Nature. 1995;377:151–155. doi: 10.1038/377151a0. [DOI] [PubMed] [Google Scholar]
- Kopecky J, Clarke G, Enerback S, Spiegelman B, Kozak LP. Expression of the mitochondrial uncoupling protein gene from the aP2 gene promoter prevents genetic obesity. J Clin Invest. 1995;96:2914–2923. doi: 10.1172/JCI118363. [DOI] [PMC free article] [PubMed] [Google Scholar]
- Kozak LP, Kozak UC, Clarke GT. Abnormal brown and white fat development in transgenic mice overexpressing glycerol 3-phosphate dehydrogenase. Genes & Dev. 1991;5:2256–2264. doi: 10.1101/gad.5.12a.2256. [DOI] [PubMed] [Google Scholar]
- Kozak LP, Kozak U, Clarke G, Enerback S, Kopecky J. Genes of energy balance: Modulation in transgenic mice. In: Bray GA, Ryan DA, editors. Molecular and genetic aspects of obesity. Baton Rouge, LA: Louisiana State University Press; 1996. pp. 609–623. [Google Scholar]
- Krylov D, Olive M, Vinson C. Extending dimerization interfaces: The bZIP basic region can form a coiled coil. EMBO J. 1995;14:5329–5337. doi: 10.1002/j.1460-2075.1995.tb00217.x. [DOI] [PMC free article] [PubMed] [Google Scholar]
- Krylov D, Kasai K, Echlin DR, Taparowsky EJ, Arnheiter H, Vinson C. A general method to design dominant negatives to B-HLHZIP proteins that abolish DNA binding. Proc Natl Acad Sci. 1997;94:12274–12279. doi: 10.1073/pnas.94.23.12274. [DOI] [PMC free article] [PubMed] [Google Scholar]
- Landschulz WH, Johnson PF, Adashi EY, Graves BJ, McKnight SL. Isolation of a recombinant copy of the gene encoding C/EBP. Genes & Dev. 1988;2:786–800. doi: 10.1101/gad.2.7.786. [DOI] [PubMed] [Google Scholar]
- Levak-Frank S, Radner H, Walsh A, Stollberger R, Knipping G, Hoefler G, Sattler W, Weinstock PH, Breslow JL, Zechner R. Muscle-specific overexpression of lipoprotein lipase causes a severe myopathy characterized by proliferation of mitochondria and peroxisomes in transgenic mice. J Clin Invest. 1995;96:976–986. doi: 10.1172/JCI118145. [DOI] [PMC free article] [PubMed] [Google Scholar]
- Lin FT, Lane MD. CCAAT/enhancer binding protein alpha is sufficient to initiate the 3T3-L1 adipocyte differentiation program. Proc Natl Acad Sci. 1994;91:8757–8761. doi: 10.1073/pnas.91.19.8757. [DOI] [PMC free article] [PubMed] [Google Scholar]
- Luetteke NC, Lee DC, Palmiter RD, Brinster RL, Sandgren EP. Regulation of fat and muscle development by transforming growth factor alpha in transgenic mice and in cultured cells. Cell Growth Differ. 1993;4:203–213. [PubMed] [Google Scholar]
- Mandrup S, Lane MD. Regulating adipogenesis. J Biol Chem. 1997;272:5367–5370. doi: 10.1074/jbc.272.9.5367. [DOI] [PubMed] [Google Scholar]
- Mason MM, He Y, Chen H, Quon MJ, Reitman M. Regulation of leptin promoter function by Sp1, C/EBP, and a novel factor. Endocrinology. 1998;139:1013–1022. doi: 10.1210/endo.139.3.5792. [DOI] [PubMed] [Google Scholar]
- McGarry JD. What if Minkowski had been ageusic? An alternative angle on diabetes. Science. 1992;258:766–770. doi: 10.1126/science.1439783. [DOI] [PubMed] [Google Scholar]
- McKnight SL, Lane MD, Gluecksohn-Waelsch S. Is CCAAT/enhancer-binding protein a central regulator of energy metabolism? Genes & Dev. 1989;3:2021–2024. doi: 10.1101/gad.3.12b.2021. [DOI] [PubMed] [Google Scholar]
- Nicholls DG, Locke RM. Thermogenic mechanisms in brown fat. Physiol Rev. 1984;64:1–64. doi: 10.1152/physrev.1984.64.1.1. [DOI] [PubMed] [Google Scholar]
- Olive M, Krylov D, Echlin DR, Gardner K, Taparowsky E, Vinson C. A dominant negative to activation protein-1 (AP1) that abolishes DNA binding and inhibits oncogenesis. J Biol Chem. 1997;272:18586–18594. doi: 10.1074/jbc.272.30.18586. [DOI] [PubMed] [Google Scholar]
- O’Shea EK, Rutkowski R, Stafford WFD, Kim PS. Preferential heterodimer formation by isolated leucine ZIPpers from fos and jun. Science. 1989;245:646–648. doi: 10.1126/science.2503872. [DOI] [PubMed] [Google Scholar]
- O’Shea EK, Rutkowski R, Kim PS. Mechanism of specificity in the Fos-Jun oncoprotein heterodimer. Cell. 1992;68:699–708. doi: 10.1016/0092-8674(92)90145-3. [DOI] [PubMed] [Google Scholar]
- Randle PJ, Garland PB, Hales CN, Hewsholme EA. The glucose fatty-acid cycle, its role in insulin sensitivity and the metabolic disturbances of diabetes mellitus. Lancet. 1963;1:785–789. doi: 10.1016/s0140-6736(63)91500-9. [DOI] [PubMed] [Google Scholar]
- Reitman M, Lee E, Westphal H, Felsenfeld G. An enhancer/locus control region is not sufficient to open chromatin. Mol Cell Biol. 1993;13:3990–3998. doi: 10.1128/mcb.13.7.3990. [DOI] [PMC free article] [PubMed] [Google Scholar]
- Ross SR, Graves RA, Spiegelman BM. Targeted expression of a toxin gene to adipose tissue: Transgenic mice resistant to obesity. Genes & Dev. 1993;7:1318–1324. doi: 10.1101/gad.7.7b.1318. [DOI] [PubMed] [Google Scholar]
- Rossetti L, Mallillon D, Barzilai N, Vuguin P, Chen W, Hawkins M, Wu J, Wang J. Short term effect of leptin on hepatic gluconeogenesis and in vivo insulin action. J Biol Chem. 1997;272:27758–27763. doi: 10.1074/jbc.272.44.27758. [DOI] [PubMed] [Google Scholar]
- Salmon DM, Flatt JP. Effect of dietary fat content on the incidence of obesity among ad libitum fed mice. Int J Obes. 1985;9:443–449. [PubMed] [Google Scholar]
- Seip, M. and O. Trygstad. 1996. Generalized lipodystrophy, congenital and acquired (lipoatrophy). Acta Paediatr. (Suppl.) 413: 2–28. [DOI] [PubMed]
- Smith PJ, Wise LS, Berkowitz R, Wan C, Rubin CS. Insulin-like growth factor-I is an essential regulator of the differentiation of 3T3-L1 adipocytes. J Biol Chem. 1988;263:9402–9408. [PubMed] [Google Scholar]
- Soloveva V, Graves RA, Rasenick MM, Spiegelman BM, Ross SR. Transgenic mice overexpressing the beta 1-adrenergic receptor in adipose tissue are resistant to obesity. Mol Endocrinol. 1997;11:27–38. doi: 10.1210/mend.11.1.9870. [DOI] [PubMed] [Google Scholar]
- Spiegelman BM, Frank M, Green H. Molecular cloning of mRNA from 3T3 adipocytes. Regulation of mRNA content for glycerophosphate dehydrogenase and other differentiation-dependent proteins during adipocyte development. J Biol Chem. 1983;258:10083–10089. [PubMed] [Google Scholar]
- Stephens JM, Butts MD, Pekala PH. Regulation of transcription factor mRNA accumulation during 3T3-L1 preadipocyte differentiation by tumour necrosis factor-alpha. J Mol Endocrinol. 1992;9:61–72. doi: 10.1677/jme.0.0090061. [DOI] [PubMed] [Google Scholar]
- Taketo M, Schroeder AC, Mobraaten LE, Gunning KB, Hanten G, Fox RR, Roderick TH, Stewart CL, Lilly F, Hansen CT, Overbeek PA. FVB/N: An inbred mouse strain preferable for transgenic analyses. Proc Natl Acad Sci. 1991;88:2065–2069. doi: 10.1073/pnas.88.6.2065. [DOI] [PMC free article] [PubMed] [Google Scholar]
- Tanaka T, Yoshida N, Kishimoto T, Akira S. Defective adipocyte differentiation in mice lacking the C/EBPβ and/or C/EBPδ gene. EMBO J. 1997;16:7432–7443. doi: 10.1093/emboj/16.24.7432. [DOI] [PMC free article] [PubMed] [Google Scholar]
- Thomas PR. Weighing the options. Washington, D.C.: National Academy Press; 1995. [Google Scholar]
- Tontonoz P, Hu E, Graves RA, Budavari AI, Spiegelman BM. mPPARγ2: Tissue-specific regulator of an adipocyte enhancer. Genes & Dev. 1994;8:1224–1234. doi: 10.1101/gad.8.10.1224. [DOI] [PubMed] [Google Scholar]
- Trayhurn P. Brown adipose tissue and energy balance. In: Trayhurn P, Nicholls DG, editors. Brown adipose tissue. London, UK: Edward Arnold; 1986. pp. 299–338. [Google Scholar]
- Vinson CR, Hai T, Boyd SM. Dimerization specificity of the leucine ZIPper-containing bZIP motif on DNA binding: Prediction and rational design. Genes & Dev. 1993;7:1047–1058. doi: 10.1101/gad.7.6.1047. [DOI] [PubMed] [Google Scholar]
- Wang ND, Finegold MJ, Bradley A, Ou CN, Abdelsayed SV, Wilde MD, Taylor LR, Wilson DR, Darlington GJ. Impaired energy homeostasis in C/EBP alpha knockout mice. Science. 1995;269:1108–1112. doi: 10.1126/science.7652557. [DOI] [PubMed] [Google Scholar]
- West DB, Boozer CN, Moody DL, Atkinson RL. Dietary obesity in nine inbred mouse strains. Am J Physiol. 1992;262:R1025–R1032. doi: 10.1152/ajpregu.1992.262.6.R1025. [DOI] [PubMed] [Google Scholar]
- Wu Z, Bucher NL, Farmer SR. Induction of peroxisome proliferator-activated receptor gamma during the conversion of 3T3 fibroblasts into adipocytes is mediated by C/EBPbeta, C/EBPdelta, and glucocorticoids. Mol Cell Biol. 1996;16:4128–4136. doi: 10.1128/mcb.16.8.4128. [DOI] [PMC free article] [PubMed] [Google Scholar]
- Yubero P, Manchado C, Cassard-Doulcier AM, Mampel T, Vinas O, Iglesias R, Giralt M, Villarroya F. CCAAT/enhancer binding proteins alpha and beta are transcriptional activators of the brown fat uncoupling protein gene promoter. Biochem Biophys Res Commun. 1994;198:653–659. doi: 10.1006/bbrc.1994.1095. [DOI] [PubMed] [Google Scholar]
- Zhang Y, Proenca R, Maffei M, Barone M, Leopold L, Friedman JM. Positional cloning of the mouse obese gene and its human homologue. Nature. 1994;372:425–432. doi: 10.1038/372425a0. [DOI] [PubMed] [Google Scholar]


