

Abstract
Background: Among obese adults, sodium intake has been associated with cardiovascular disease. Few data are available on sodium intake and albuminuria, a marker of kidney damage and risk factor for cardiovascular disease.
Objective: We examined the relation between dietary sodium and potassium intakes and the ratio of sodium to potassium (Na/K) with albuminuria by BMI in the Reasons for Geographic and Racial Differences in Stroke (REGARDS) Study (n = 30,239 adults aged ≥45 y).
Design: A modified Block 98 food-frequency questionnaire was used for dietary assessment in 21,636 participants, and nutritional variables were categorized by sex-specific quintiles. Normal weight, overweight, and obese were defined as BMI (in kg/m2) categories of 18.5–24.9, 25–29.9, and ≥30, respectively. Albuminuria was defined as a ratio (mg/g) of urinary albumin to creatinine of ≥30.
Results: The prevalences of albuminuria were 11.5%, 11.6%, and 16.0% in normal-weight, overweight, and obese participants, respectively. The multivariable-adjusted ORs for albuminuria in a comparison of the highest with the lowest quintile of Na/K intake (≥1.12 to <0.70 for men and ≥1.07 to <0.62 for women) were 0.89 (95% CI: 0.65, 1.22), 1.08 (95% CI: 0.85, 1.36), and 1.28 (95% CI: 1.02, 1.61) in normal-weight, overweight, and obese participants, respectively. The highest quintile of dietary sodium was associated with an increased OR for albuminuria in obese participants (OR: 1.44; 95% CI: 1.00, 2.07) but not in normal-weight or overweight participants. Dietary potassium was not associated with albuminuria.
Conclusion: In obese adults, higher dietary Na/K and sodium intakes were associated with albuminuria.
INTRODUCTION
Albuminuria, a marker of kidney damage, is common among US adults (1). Studies have reported an overall albuminuria prevalence of 6% to 10% among US adults, 13% to 16% in individuals with hypertension, and 28% to 38% in individuals with diabetes mellitus (2–4). Several recent studies have documented a continuous positive relation between albuminuria and cardiovascular events and end-stage renal disease (5).
Dietary sodium and potassium intakes are also associated with cardiovascular disease (6). In addition, a higher sodium intake is associated with hypertension, and this relation is stronger in overweight and obese populations (7, 8). A higher potassium intake has been associated with blood pressure reduction and improved hypertension control and may be particularly beneficial in the setting of a high-sodium diet (9–12). Although the association between sodium and potassium and cardiovascular disease and hypertension is well established, the relation with albuminuria is not as well documented, especially for obese individuals.
Because hypertension is also a known risk factor for albuminuria (13), we hypothesized that high dietary sodium and low potassium intakes would be associated with a higher prevalence of albuminuria. To test this hypothesis, we used data from the baseline visit of the REGARDS5 Study—a large population-based cohort of US adults aged ≥45 y (14). Because other researchers have reported that sodium intake has a more adverse effect on cardiovascular disease among obese individuals, we a priori decided to examine this association for normal-weight, overweight, and obese individuals separately (15–17).
SUBJECTS AND METHODS
Participants
The design and objectives of the REGARDS Study were described previously (14). Briefly, by design, the study oversampled blacks and included an approximately equal representation of men and women. Enrollment began in January of 2003 and concluded in October of 2007. In addition, ∼50% of the participants were recruited from the “stroke belt” (North Carolina, South Carolina, Georgia, Tennessee, Alabama, Mississippi, Arkansas, and Louisiana). The REGARDS study participants were identified by using a commercial, nationwide list of >250 million individuals in the United States (Genesys Incorporated). A trained interviewer contacted households by telephone, and one resident per household aged ≥45 y was randomly screened for eligibility. The response rate (the percentage agreeing to be interviewed among known eligible candidates contacted after adjustment for those of unknown eligibility) was 41%. Exclusion criteria included race other than black or white, active treatment of cancer, medical conditions preventing long-term participation, cognitive impairment as judged by the telephone interviewer, residence in or on a waiting list for a nursing home, and inability to communicate in English.
Of the 30,239 participants enrolled in the REGARDS Study, 8603 participants who did not complete the modified Block 98 FFQ were excluded from the current analysis (Figure 1). In addition, 1430 participants with missing serum creatinine or urinary albumin or creatinine values, 115 participants with missing BMI values, and 207 underweight [BMI (in kg/m2) <18.5) participants were excluded. Excluded individuals were younger, more likely to be women, had a higher mean BMI, and were less likely to be smokers or have diabetes or hypertension than were the participants included in this analysis. After these exclusions, data for 19,884 participants were available for the current analyses. The REGARDS Study was approved by the institutional review boards of the participating institutions, and all participants provided verbal consent before the telephone interview was conducted and written informed consent before completion of the in-home study visit.
FIGURE 1.

Exclusionary cascade for analyses in the REGARDS Study. REGARDS, Reasons for Geographic and Racial Differences in Stroke.
Data collection
Data were collected during a telephone interview, during an in-home visit, and via self-administered questionnaires that were left for participants to complete after the in-home visit. Of relevance to the current analysis, the telephone interview included information on age, race, sex, education, household income, physical activity, current smoking status, alcohol consumption, self-rated health, a prior diagnosis of hypertension and/or diabetes mellitus, self-report of a previous diagnosis of myocardial infarction, and use of antihypertensive, lipid-lowering, and/or antidiabetes medications.
During the in-home study visit, weight, height, and waist circumference were measured following a standardized protocol. BMI was calculated as weight (in kg) divided by height squared (in m). Participants were categorized as being normal weight (BMI: 18.5–24.9), overweight (BMI: 25.0–29.9), or obese (BMI ≥ 30.0). With a tape measure, waist circumference was measured midway between the lowest rib and the iliac crest while the participants were standing. Abdominal obesity was defined as a waist circumference >88 cm for women and >102 cm for men. On the basis of the mean of 2 seated blood pressure measurements, hypertension was defined as a systolic blood pressure ≥140 mm Hg, a diastolic blood pressure ≥90 mm Hg, or the use of antihypertensive medication.
Participants were asked to fast for 10 to 12 h before the in-home study visit. A blood sample was collected, centrifuged, refrigerated, and shipped overnight to the REGARDS central laboratory at the University of Vermont. Total cholesterol, HDL cholesterol, triglycerides, serum glucose, and serum creatinine were measured by colorimetric reflectance spectrophotometry by using the Ortho Vitros Clinical Chemistry System 950IRC instrument (Johnson & Johnson Clinical Diagnostics). LDL cholesterol was calculated by using the Friedewald equation for individuals with triglycerides <400 mg/dL. Dyslipidemia was defined as total cholesterol ≥240 mg/dL, LDL cholesterol ≥160 mg/dL, HDL cholesterol ≤40 mg/dL, or the use of lipid-lowering medication.
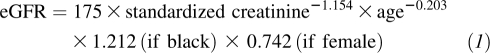
As described previously (18), an isotope dilution mass spectrometry–traceable equation was used in the calibration of REGARDS serum creatinine values for calculating the eGFR by using the Modification of Diet in Renal Disease (MDRD) formula (19):
 |
Diabetes mellitus was defined as a fasting glucose concentration ≥126 mg/dL (≥200 mg/dL for participants who did not fast) or self-reported current use of antidiabetes medication.
Measurement of urinary albumin and creatinine
Albumin from spot urine samples was measured in batches during enrollment by using the BN ProSpec Nephelometer (Dade Behring). The assay range is 2.4–76.9 mg/L on initial sampling. Automatic dilutions are performed on specimens with higher concentrations. The interassay CVs were 2.2% at 109.9 mg/L and 4.3% at 12.7 mg/L. Urinary creatinine was measured in batches during enrollment by using the Modular-P chemistry analyzer from Roche/Hitachi. The assay range was 1–650 mg/dL on initial sampling. Automatic dilutions were performed on specimens with higher concentrations. The interassay CVs were 2.6% at 66.6 mg/dL and 8.6% at 15.6 mg/dL. Albuminuria was defined as a urinary albumin–to–creatinine ratio ≥30 mg/g.
Nutritional assessment
At the conclusion of the in-home study visit, participants were asked to complete additional questionnaires, which included the Block 98 FFQ. The full-length Block FFQ originally was developed by Gladys Block (National Cancer Institute) and has since been enhanced and updated (20, 21). Different versions of this questionnaire have been studied extensively and validated in diverse populations (20, 21). The Block 98 version developed by Block Dietary Data Systems and distributed by NutritionQuest (www.Nutritionquest.com) is an 8-page paper-and-pencil form with more than 150 multiple-choice questions based on 107 food items that can be completed at home in ∼20–40 min. The Block FFQ has been validated for most nutrients, including sodium and potassium, by using multiple diet records (20, 22, 23).
In the REGARDS Study, the Block 98 FFQ was used to assess energy intake, consumption type (eg, dairy products, whole grains, fruit and vegetables), dietary fat, and nutrient intakes. Each participant recorded food and nutrient intakes for 1 wk before their in-home visit, and data were subsequently entered into a database by study personnel. FFQs, compared with diary techniques, tend to underestimate nutrient intake; however, this underestimation usually is uniformly distributed across study subpopulations (20–22, 24). Therefore, it is generally recommended that estimated nutrient intakes from FFQs should be reported and analyzed as either ranked values (eg, quintiles) or ratios of 2 different nutrients rather than as absolute values per individual (23, 25). Thus, sex-specific quintiles of sodium, potassium, and the ratio of sodium to potassium (Na/K) were used in all analyses.
Statistical analysis
Because the association of sodium with cardiovascular disease has been reported to differ by BMI, we a priori decided to perform all analyses for normal-weight, overweight, and obese participants separately. Characteristics of the participant were calculated for each BMI category separately. Next, the prevalence and multivariable-adjusted ORs for albuminuria associated with sex-specific quintiles of Na/K were calculated. Multivariable adjusted ORs were calculated by using logistic regression with 4 levels of adjustment. The first models included adjustment for age and total energy intake. The second models included additional adjustment for sex and race. The third models included additional adjustment for education, income, smoking status, alcohol consumption, self-rated health, and physical activity. The fourth models were further adjusted for hypertension, dyslipidemia, and diabetes mellitus. As a secondary analysis, the ORs for albuminuria associated with Na/K intake were calculated for normal-weight, overweight, and obese participants stratified by race. The prevalence and ORs for albuminuria associated with sex-specific quintiles of sodium intake, and separately for potassium intake, were determined in secondary analyses. In sensitivity analyses, the ORs for albuminuria associated with sex-specific quintile of Na/K were calculated separately for participants with and without abdominal obesity. The analyses were performed with SAS version 9.2 software (SAS Institute Inc).
RESULTS
The mean ages for normal-weight, overweight, and obese participants were 66.1, 65.6, and 63.1 y, respectively. Individuals in the higher BMI categories were more likely to be black, to have less than a high school education, to have an annual income <$20,000, to have fair or poor self-rated health, to have a sedentary lifestyle, and to have dyslipidemia, hypertension, and diabetes mellitus. In addition, systolic and diastolic blood pressure levels were higher at higher BMI categories. In contrast, current smoking and current alcohol consumption were less common at higher BMI categories. The median sodium and Na/K intake was higher at higher BMI categories, whereas potassium intake and total energy intake were not substantially different by BMI (Table 1).
TABLE 1.
Characteristics of participants in the REGARDS Study by BMI1
| BMI category (kg/m2) |
|||
| Characteristic | Normal weight (18.5–24.9) | Overweight (25–29.9) | Obese (≥30) |
| No. of subjects | 4979 | 7637 | 7268 |
| Age (y) | 66.1 ± 10.02 | 65.6 ± 9.2 | 63.1 ± 8.4 |
| Black (%) | 21.7 | 29.6 | 44.4 |
| Women (%) | 57.3 | 47.1 | 61.8 |
| Less than high school education (%) | 7.6 | 8.7 | 11.5 |
| Annual income <$20,000 (%) | 13.4 | 13.0 | 18.8 |
| Currently smoking (%) | 17.4 | 12.2 | 11.5 |
| Currently consumes alcohol (%) | 45.3 | 42.9 | 32.7 |
| Fair/poor self-reported health status (%) | 11.2 | 11.7 | 22.3 |
| Sedentary (%)3 | 28.0 | 28.0 | 38.0 |
| Dyslipidemia (%) | 46.3 | 61.4 | 64.1 |
| Hypertension (%) | 42.9 | 53.8 | 69.2 |
| Diabetes mellitus (%) | 7.4 | 14.7 | 29.1 |
| SBP (mm Hg) | 123 ± 17.3 | 127 ± 15.7 | 130 ± 15.8 |
| DBP (mm Hg) | 73.5 ± 10.5 | 75.9 ± 9.2 | 78.4 ± 9.6 |
| eGFR (mL · min−1 · 1.73 m−2) | 84.3 ± 17.9 | 84.1 ± 18.5 | 86.5 ± 20.3 |
| Ratio of urinary albumin to creatinine (mg/g)4 | 7.1 (4.7, 13.5)5 | 6.8 (4.4, 13.1) | 7.5 (4.7, 17.0) |
| Dietary intake (mg/d) | |||
| Sodium | 1996 (1492, 2687) | 2103 (1532, 2787) | 2123 (1536, 2911) |
| Potassium | 2519 (1889, 3275) | 2516 (1894, 3264) | 2444 (1806, 3215) |
| Ratio of sodium to potassium | 0.82 (0.66, 0.99) | 0.85 (0.69, 1.03) | 0.90 (0.72, 1.09) |
| Total energy (kcal) | 1559 (1193, 2012) | 1592 (1206, 2081) | 1594 (1186, 2136) |
DBP, diastolic blood pressure; eGFR, estimated glomerular filtration rate; REGARDS, Reasons for Geographic and Racial Differences in Stroke; SBP, systolic blood pressure.
Mean ± SD (all such values).
Defined as no self-reported weekly physical activity.
Albuminuria is defined as a urinary albumin to creatinine ratio ≥30 mg/g.
Median; 25th–75th percentile in parentheses (all such values).
Overall, the prevalences of albuminuria were 11.5%, 11.6%, and 16.0% in normal-weight, overweight, and obese participants, respectively. Among participants in each BMI category, albuminuria was most common in the highest sex-specific quintile of Na/K (Figure 2). After adjustment for age and total energy intake, in each BMI category, individuals in the highest sex-specific quintile of Na/K had higher ORs for albuminuria (Table 2). After further adjustment for sex and race, among normal-weight individuals, the association between the highest sex-specific quintile of Na/K and albuminuria was attenuated. After adjustment for education, income, smoking status, alcohol consumption, self-reported health status, and physical activity category, no association was present between sex-specific quintiles of Na/K and albuminuria in normal-weight or overweight individuals. Among obese participants, the OR for albuminuria in those in the highest compared with the lowest sex-specific quintile of Na/K was 1.30 (95% CI: 1.04, 1.62). This association remained present after further adjustment for dyslipidemia, hypertension, and diabetes mellitus. Consistent with the main findings, after multivariable adjustment, no association was present between higher sex-specific quintiles of Na/K and albuminuria for normal-weight or overweight whites (see Supplementary Table 1 under “Supplemental data” in the online issue) or blacks (see Supplementary Table 2 under “Supplemental data” in the online issue). Among obese individuals, the OR for albuminuria associated with the highest compared with the lowest sex-specific quintile of Na/K was 1.48 (95% CI: 1.06, 2.06) for whites and 1.17 (95% CI: 0.86, 1.60) for blacks (P-interaction = 0.68).
FIGURE 2.

Prevalence of albuminuria by sex-specific quintile of the ratio of dietary sodium to potassium (Na/K) for normal-weight, overweight, and obese participants in the REGARDS Study. Albuminuria is defined as a urinary albumin to creatinine ratio ≥30 mg/g. †Normal weight is defined as a BMI (in kg/m2) of 18.5–24.9, overweight as a BMI of 25–29.9, and obese as a BMI of ≥30. Q, quintile; REGARDS, Reasons for Geographic and Racial Differences in Stroke.
TABLE 2.
ORs (and 95% CIs) for albuminuria associated with sex-specific quintiles of dietary sodium to potassium ratio intake for normal-weight, overweight, and obese participants in the REGARDS Study1
| Quintile of dietary sodium to potassium ratio | |||||
| 1 | 2 | 3 | 4 | 5 | |
| Men2 | 0.24–0.70 | 0.70–0.83 | 0.83–0.96 | 0.96–1.12 | 1.12–2.92 |
| Women2 | 0.07–0.62 | 0.62–0.76 | 0.76–0.90 | 0.90–1.07 | 1.07–2.52 |
| Model 13 | |||||
| Normal weight | Reference | 0.95 (0.73, 1.25) | 1.05 (0.80, 1.38) | 1.05 (0.79, 1.40) | 1.47 (1.11, 1.94) |
| Overweight | Reference | 0.83 (0.67, 1.04) | 0.92 (0.74, 1.15) | 1.12 (0.89, 1.39) | 1.41 (1.13, 1.76) |
| Obese | Reference | 1.12 (0.90, 1.41) | 1.04 (0.83, 1.30) | 1.15 (0.93, 1.43) | 1.47 (1.20, 1.82) |
| Model 24 | |||||
| Normal weight | Reference | 0.95 (0.73, 1.25) | 1.04 (0.79, 1.36) | 0.98 (0.74, 1.30) | 1.25 (0.94, 1.66) |
| Overweight | Reference | 0.86 (0.69, 1.08) | 0.95 (0.76, 1.19) | 1.12 (0.89, 1.40) | 1.31 (1.05, 1.64) |
| Obese | Reference | 1.15 (0.92, 1.44) | 1.06 (0.85, 1.33) | 1.17 (0.94, 1.45) | 1.44 (1.17, 1.77) |
| Model 35 | |||||
| Normal weight | Reference | 0.86 (0.65, 1.14) | 0.94 (0.71, 1.25) | 0.85 (0.63, 1.14) | 0.97 (0.72, 1.32) |
| Overweight | Reference | 0.83 (0.66, 1.05) | 0.87 (0.68, 1.09) | 1.05 (0.84, 1.32) | 1.12 (0.89, 1.41) |
| Obese | Reference | 1.15 (0.91, 1.45) | 1.05 (0.83, 1.33) | 1.09 (0.87, 1.37) | 1.30 (1.04, 1.62) |
| Model 46 | |||||
| Normal weight | Reference | 0.88 (0.66, 1.17) | 0.92 (0.69, 1.23) | 0.85 (0.63, 1.16) | 0.89 (0.65, 1.22) |
| Overweight | Reference | 0.79 (0.62, 1.00) | 0.82 (0.65, 1.05) | 0.98 (0.78, 1.24) | 1.08 (0.85, 1.36) |
| Obese | Reference | 1.13 (0.89, 1.44) | 1.06 (0.83, 1.35) | 1.11 (0.88, 1.40) | 1.28 (1.02, 1.61) |
Normal weight is defined as a BMI (in kg/m2) of 18.5–24.9, overweight as 25–29.9, and obese as ≥30. Albuminuria is defined as a urinary albumin to creatinine ratio ≥30 mg/g. REGARDS, Reasons for Geographic and Racial Differences in Stroke.
Values are ranges.
Adjusted for age and total energy intake.
Adjusted for variables in model 1 plus sex and race.
Adjusted for variables in model 2 plus education category, income category, smoking status, alcohol consumption, self-reported health status, and physical activity category.
Adjusted for variables in model 3 plus dyslipidemia, hypertension, and diabetes mellitus.
Among participants without abdominal obesity, the age- and total energy intake–adjusted OR for albuminuria in a comparison of the highest with the lowest sex-specific quintile of Na/K was 1.37 (95% CI: 1.13, 1.66; Table 3). This association was attenuated after adjustment for sex and race (OR: 1.21; 95% CI: 0.99, 1.48) and was no longer present after further adjustment for education, income, smoking status, alcohol consumption, self-reported health status, and physical activity (OR: 0.96; 95% CI: 0.78, 1.18). For participants with abdominal obesity, the OR for a comparison of the highest with the lowest sex-specific quintile of Na/K was 1.51 (95% CI: 1.26, 1.82) after adjustment for age and total energy intake. The OR was attenuated but remained present (OR: 1.27; 95% CI: 1.04, 1.55) after multivariable adjustment.
TABLE 3.
ORs (and 95% CIs) for albuminuria associated with sex-specific quintiles of dietary sodium to potassium ratio intake for participants in the REGARDS Study with and without abdominal obesity1
| Quintile of dietary sodium to potassium ratio | |||||
| 1 | 2 | 3 | 4 | 5 | |
| Men2 | 0.24–0.70 | 0.70–0.83 | 0.83–0.96 | 0.96–1.12 | 1.12–2.92 |
| Women2 | 0.07–0.62 | 0.62–0.76 | 0.76–0.90 | 0.90–1.07 | 1.07–2.52 |
| Model 13 | |||||
| Abdominal obesity | |||||
| No | Reference | 0.91 (0.75, 1.10) | 0.97 (0.80, 1.18) | 1.05 (0.86, 1.27) | 1.37 (1.13, 1.66) |
| Yes | Reference | 1.03 (0.85, 1.24) | 1.02 (0.84, 1.24) | 1.17 (0.97, 1.41) | 1.51 (1.26, 1.82) |
| Model 24 | |||||
| Abdominal obesity | |||||
| No | Reference | 0.92 (0.76, 1.12) | 0.98 (0.81, 1.19) | 1.01 (0.83, 1.23) | 1.21 (0.99, 1.48) |
| Yes | Reference | 1.06 (0.87, 1.29) | 1.04 (0.86, 1.27) | 1.18 (0.98, 1.43) | 1.46 (1.22, 1.76) |
| Model 35 | |||||
| Abdominal obesity | |||||
| No | Reference | 0.87 (0.71, 1.06) | 0.91 (0.74, 1.11) | 0.90 (0.73, 1.11) | 0.96 (0.78, 1.18) |
| Yes | Reference | 1.03 (0.84, 1.26) | 1.00 (0.82, 1.22) | 1.11 (0.92, 1.35) | 1.31 (1.09, 1.59) |
| Model 46 | |||||
| Abdominal obesity | |||||
| No | Reference | 0.85 (0.69, 1.04) | 0.88 (0.72, 1.08) | 0.88 (0.71, 1.09) | 0.91 (0.74, 1.13) |
| Yes | Reference | 1.00 (0.81, 1.23) | 0.98 (0.80, 1.21) | 1.10 (0.90, 1.34) | 1.27 (1.04, 1.55) |
Abdominal obesity is defined as a waist circumference >102 cm (40 inches) in men and >88 cm (35 inches) in women. Albuminuria is defined as a urinary albumin to creatinine ratio ≥30 mg/g. REGARDS, Reasons for Geographic and Racial Differences in Stroke.
Values are ranges.
Adjusted for age and total energy intake.
Adjusted for variables in model 1 plus sex and race.
Adjusted for variables in model 2 plus education category, income category, smoking status, alcohol consumption, self-reported health status, and physical activity category.
Adjusted for variables in model 3 plus dyslipidemia, hypertension, and diabetes mellitus.
After adjustment for age and total energy intake, dietary sodium intake alone was not associated with albuminuria (see Supplementary Table 3 under “Supplemental data” in the online issue). After further adjustment, an increased OR for albuminuria was present for obese individuals in the highest compared with the lowest sex-specific quintile of sodium intake. After adjustment for age and total energy intake, higher dietary potassium intake was associated with a lower OR for albuminuria among normal-weight, overweight, and obese individuals (see Supplementary Table 4 under “Supplemental data” in the online issue). These associations were no longer present after multivariable adjustment.
DISCUSSION
In the current study, obese participants with diets both high in sodium and low in potassium had a higher prevalence of albuminuria. This finding was consistent after multivariable adjustment for potential confounders and when defining obesity on the basis of BMI or waist circumference. In contrast, no association was present between dietary sodium or potassium intake and albuminuria among normal-weight or overweight individuals.
Prior studies showed an association between sodium intake and urinary albumin (15, 26). In a group of 839 individuals (471 men and 368 women) aged 15–70 y, du Cailar et al (15) examined the relation of sodium intake with microalbuminuria using 2 consecutive measurements of 24-h urinary sodium excretion. In that study, an association was found between the relation of higher concentrations of urinary sodium excretion with microalbuminuria after adjustment for sex, age, BMI, and systolic blood pressure.
Fox et al (26) evaluated the relation between urinary sodium, based on a spot measure and albuminuria, among 2700 participants in the Framingham Offspring Study (53% women; mean age: 58 y) who underwent routine examination between 1995 and 1998. Using multivariate regression techniques, they found a robust correlation between log urinary sodium and the log albumin-to-creatinine ratio.
The relation between sodium intake and albuminuria by level of BMI was reported in at least one prior study (17). The PREVEND Study used cross-sectional data from 7850 adults aged 28–75 y from the Netherlands to study the relation between sodium intake (as determined by the mean sodium value from two 24-h urine collections) and albuminuria in normal-weight, overweight, and obese participants separately. This cohort was enriched with participants with elevated urinary albumin concentrations. The PREVEND investigators showed a positive relation between sodium intake and albuminuria among normal-weight, overweight, and obese individuals. However, the association was strongest for obese individuals. Although potassium was included in the adjusted models, it was not used in a ratio with sodium. In that cohort, potassium was positively associated with urinary albumin excretion, whereas our analyses showed no association. In contrast with PREVEND, which was limited to a population from one Dutch city, the current study extended the prior results to a US cohort of black and white adults. In addition, this study bolstered the data presented by Verhave et al (17) because an FFQ was used in the REGARDS Study to derive dietary sodium and potassium intakes.
The mechanisms underlying the association between Na/K intake and albuminuria are not completely understood. Salt sensitivity has been found to be correlated with specific phenotypic and metabolic characteristics—particularly for blacks in the United States (27, 28) and for those with increased body fat (7, 29, 30). Mechanisms in animal and human studies point to a direct endothelial insult because elevated dietary sodium has been implicated in the initiation of angiotensin type II–induced oxidative stress (31). Angiotensin type II increases T cell activation, the production of proinflammatory cytokines, and infiltration into perivascular fat. Within the perivascular fat, the T cell can produce cytokines and release other mediators that affect the smooth muscle cells and endothelium of the adjacent vessel (32). Endothelial injury subsequently leads to suboptimal nitric oxide production, which results in unopposed excess vascular transforming growth factor-β production. This signaling cascade fosters reduced vascular compliance and amplifies peripheral arterial constriction (33–35). Thus, whereas a reduction of sodium in the diet results in lower blood pressure independent of weight loss (36), it also results in further reductions in blood pressure in the setting of antihypertensive therapy (37, 38) and improves hypertension control (39, 40).
The distinction of the Na/K ratio may be important because dietary potassium intake may play a protective role in the incidence of albuminuria. This theory was detailed by Meneely and Ball (41) >50 y ago and was based on their observations that rats fed toxic amounts of sodium chloride survived longer if they also received higher amounts of potassium. Dietary potassium intake and supplementation have also been found to counteract the harmful effects of dietary salt in humans (12, 36).
Although it appears contradictory, the protective effect of potassium is more intense in the presence of excess dietary sodium as compared with salt depletion (9). The mechanistic action by which dietary potassium attenuates the effect of dietary sodium excess is not fully understood; however, animal and clinical studies have shown that the effect may be associated with sympathetic nerve inhibition in salt-sensitive hypertension (42). A high-potassium diet improves vascular function with respect to generation of vasodilators—nitric oxide and other endothelium-derived factors. Experimental studies suggest that a potassium-rich diet may decrease cardiovascular disease risk through one or more of the following mechanisms (38, 43): inhibition of free radical formation from vascular endothelial cells and macrophages, reduced proliferation of vascular smooth muscle cells, decreases in platelet aggregation and arterial thrombosis, and a reduction of renal vascular resistance and a subsequent increase in GFR.
The current study had potential limitations. We were unable to assess causality because of the study's observational cross-sectional design. In addition, the assessment of albuminuria was determined from spot urine samples as opposed to a timed or 24-h urine collection; however, spot urine measurement has been shown to perform well at detecting abnormal urinary albumin excretion, and the one time collection avoids error introduced by inadequate collections over time (44, 45). Another limitation of the current study was that sodium and potassium intakes were estimated by dietary recall rather than by 24-h urine collections—the gold standard for urinary electrolyte measurement. A well-known issue with dietary assessment instruments is the underreporting of nutritional intakes. Several factors (eg, age, sex, race, socioeconomic status, and other lifestyle factors) influence eating habits and the reporting of nutritional intake (37, 40). To address this limitation, dietary sodium, potassium, and Na/K were analyzed by using quintiles rather by than estimating daily intakes. In addition, dietary questionnaires provide acceptable classification of nutrient intakes on an individual level and are widely accepted in cohort studies with large sample sizes (39, 46). Some bias may have potentially been introduced because about one-third of the cohort was excluded, mainly because of missing FFQs. Despite these limitations, the REGARDS Study had several notable strengths, including the enrollment of a large sample of whites and blacks from the continental United States and the collection of dietary data with the use of a standardized and validated FFQ. In addition, urinary albumin and creatinine were measured at a central laboratory following standardized procedures.
In conclusion, in the current study obese individuals with a diet high in sodium and low in potassium were more likely to have albuminuria. Although the physiologic mechanisms are not fully understood, diets high in potassium may mediate the adverse effects of dietary sodium and serve to protect the vascular endothelium from sodium-induced injury. If the results from the current study are confirmed in the future, testing the effect of sodium reduction on albuminuria in randomized trials may be warranted.
Supplementary Material
Acknowledgments
The authors’ responsibilities were as follows—KJA and RCC: conceived of and designed the study, interpreted the data, and wrote and critically reviewed the manuscript; SEJ: analyzed and interpreted the data, critically reviewed the manuscript, and assisted with the writing of the manuscript; PM: critically reviewed and assisted with the writing of the manuscript; and PWS: assisted with the conception of the study and with the interpretation of the data and critically reviewed and edited the manuscript. None of the authors had a conflict of interest or any financial disclosures.
Footnotes
eGFR, estimated glomerular filtration rate; FFQ, food-frequency questionnaire; PREVEND, Prevention of Renal and Vascular End-stage Disease; REGARDS, Reasons for Geographic and Racial Differences in Stroke.
REFERENCES
- 1.Coresh J, Selvin E, Stevens LA, Manzi J, Kusek JW, Eggers P, Van Lente F, Levey AS. Prevalence of chronic kidney disease in the United States. JAMA 2007;298:2038–47 [DOI] [PubMed] [Google Scholar]
- 2.Camille AJ, Mildred EF, Mark SE, Blanche C, Josef C, Michael E, John WK, Danita B-H, Narayan KMV, William HH, et al. Microalbuminuria in the US population: third National Health and Nutrition Examination Survey. Am J Kidney Dis 2002;39(3):445–59 [DOI] [PubMed] [Google Scholar]
- 3.Gerstein HC, Mann JFE, Yi Q, Zinman B, Dinneen SF, Hoogwerf B, Halle JP, Young J, Rashkow A, Joyce C, et al. Albuminuria and risk of cardiovascular events, death, and heart failure in diabetic and nondiabetic individuals. JAMA 2001;286:421–6 [DOI] [PubMed] [Google Scholar]
- 4.Hillege HL, Janssen WMT, Bak AAA, Diercks GFH, Grobbee DE, Crijns HJGM, Gilst WHV, Zeeuw DD, Jong PED. Microalbuminuria is common, also in a nondiabetic, nonhypertensive population, and an independent indicator of cardiovascular risk factors and cardiovascular morbidity. J Intern Med 2001;249:519–26 [DOI] [PubMed] [Google Scholar]
- 5.Hermans MM, Henry R, Dekker JM, Kooman JP, Kostense PJ, Nijpels G, Heine RJ, Stehouwer CD. Estimated glomerular filtration rate and urinary albumin excretion are independently associated with greater arterial stiffness: the Hoorn Study. J Am Soc Nephrol 2007;18:1942–52 [DOI] [PubMed] [Google Scholar]
- 6.Cook NR, Obarzanek E, Cutler JA, Buring JE, Rexrode KM, Kumanyika SK, Appel LJ, Whelton PK. Joint effects of sodium and potassium intake on subsequent cardiovascular disease: the Trials of Hypertension Prevention follow-up study. Arch Intern Med 2009;169:32–40 [DOI] [PMC free article] [PubMed] [Google Scholar]
- 7.Rocchini AP, Key J, Bondie D, Chico R, Moorehead C, Katch V, Martin M. The Effect of Weight Loss on the Sensitivity of Blood Pressure to Sodium in Obese Adolescents. N Engl J Med 1989;321:580–5 [DOI] [PubMed] [Google Scholar]
- 8.Whelton PK, Appel LJ, Espeland MA, Applegate WB, Ettinger WH, Jr, Kostis JB, Kumanyika S, Lacy CR, Johnson KC, Folmar S, et al. Sodium reduction and weight loss in the treatment of hypertension in older persons: a randomized controlled trial of nonpharmacologic interventions in the elderly (TONE). TONE Collaborative Research Group. JAMA 1998;279:839–46 [DOI] [PubMed] [Google Scholar]
- 9.Ando K MH, Fujita M, Fujita T. Protective effect of dietary potassium against cardiovascular damage in salt-sensitive hypertension: possible role of its antioxidant action. Curr Vasc Pharmacol 2010;8:59–63 [DOI] [PubMed] [Google Scholar]
- 10.Ying WZ, Aaron K, Wang PX, Sanders PW. Potassium inhibits dietary salt-induced transforming growth factor-beta production. Hypertension 2009;54:1159–63 [DOI] [PMC free article] [PubMed] [Google Scholar]
- 11.Kido M, Ando K, Onozato ML, Tojo A, Yoshikawa M, Ogita T, Fujita T. Protective effect of dietary potassium against vascular injury in salt-sensitive hypertension. Hypertension 2008;51:225–31 [DOI] [PubMed] [Google Scholar]
- 12.Matsui H, Shimosawa T, Uetake Y, Wang H, Ogura S, Kaneko T, Liu J, Ando K, Fujita T. Protective effect of potassium against the hypertensive cardiac dysfunction: association with reactive oxygen species reduction. Hypertension 2006;48:225–31 [DOI] [PubMed] [Google Scholar]
- 13.de Zeeuw D, Hillege HL, de Jong PE. The kidney, a cardiovascular risk marker, and a new target for therapy. Kidney Int Suppl 2005;Sep:S25–9 [DOI] [PubMed] [Google Scholar]
- 14.Howard VJ, Cushman M, Pulley L, Gomez CR, Go RC, Prineas RJ, Graham A, Moy CS, Howard G. The Reasons for Geographic and Racial Differences in Stroke Study: objectives and design. Neuroepidemiology 2005;25:135–43 [DOI] [PubMed] [Google Scholar]
- 15.du Cailar G, Ribstein J, Mimran A. Dietary sodium and target organ damage in essential hypertension. Am J Hypertens 2002;15:222–9 [DOI] [PubMed] [Google Scholar]
- 16.He J, Ogden LG, Vupputuri S, Bazzano LA, Loria C, Whelton PK. Dietary sodium intake and subsequent risk of cardiovascular disease in overweight adults. JAMA. JAMA 1999;282:2027–34 [DOI] [PubMed] [Google Scholar]
- 17.Verhave JC, Hillege HL, Burgerhof JGM, Janssen WMT, Gansevoort RT, Navis GJ, Zeeuw D, Jong PE. Sodium intake affects urinary albumin excretion especially in overweight subjects. J Intern Med 2004;256:324–30 [DOI] [PubMed] [Google Scholar]
- 18.Manjula Kurella T, Virginia W, Kristine Y, Leslie AM, George H, Rodney G, Richard MA, David GW, William M. Kidney function and cognitive impairment in US adults: the Reasons for Geographic and Racial Differences in Stroke (REGARDS) Study. Am J Kidney Dis. 2008;52(2):227–34 [DOI] [PMC free article] [PubMed] [Google Scholar]
- 19.Levey AS, Coresh J, Greene T, Marsh J, Stevens LA, Kusek JW, Van Lente F. for the Chronic Kidney Disease Epidemiology Collaboration. Expressing the modification of diet in renal disease study equation for estimating glomerular filtration rate with standardized serum creatinine values. Clin Chem 2007;53:766–72 [DOI] [PubMed] [Google Scholar]
- 20.Block G, Woods M, Potosky A, Clifford C. Validation of a self-administered diet history questionnaire using multiple diet records. J Clin Epidemiol 1990;43:1327–35 [DOI] [PubMed] [Google Scholar]
- 21.Block G, Thompson FE, Hartman AM, Larkin FA, Guire KE. Comparison of two dietary questionnaires validated against multiple dietary records collected during a 1-year period. J Am Diet Assoc 1992;92:686–93 [PubMed] [Google Scholar]
- 22.Block G, Hartman AM, Naughton D. A reduced dietary questionnaire: development and validation. Epidemiology 1990;1:58–64 [DOI] [PubMed] [Google Scholar]
- 23.Alonso A, Nettleton JA, Ix JH, de Boer IH, Folsom AR, Bidulescu A, Kestenbaum BR, Chambless LE, Jacobs DR., Jr Dietary phosphorus, blood pressure, and incidence of hypertension in the atherosclerosis risk in communities study and the multi-ethnic study of atherosclerosis. Hypertension 2010;55:776–84 [DOI] [PMC free article] [PubMed] [Google Scholar]
- 24.Day N, McKeown N, Wong M, Welch A, Bingham S. Epidemiological assessment of diet: a comparison of a 7-day diary with a food frequency questionnaire using urinary markers of nitrogen, potassium and sodium. Int J Epidemiol 2001;30:309–17 [DOI] [PubMed] [Google Scholar]
- 25.Noori N, Kalantar-Zadeh K, Kovesdy CP, Bross R, Benner D, Kopple JD. Association of dietary phosphorus intake and phosphorus to protein ratio with mortality in hemodialysis patients. Clin J Am Soc Nephrol 2010;5:683–92 [DOI] [PMC free article] [PubMed] [Google Scholar]
- 26.Fox CS, Larson MG, Hwang SJ, Leip EP, Rifai N, Levy D, Benjamin EJ, Murabito JM, Meigs JB, Vasan RS. Cross-sectional relations of serum aldosterone and urine sodium excretion to urinary albumin excretion in a community-based sample. Kidney Int 2006;69:2064–9 [DOI] [PubMed] [Google Scholar]
- 27.Campese VM, Parise M, Karubian F, Bigazzi R. Abnormal renal hemodynamics in black salt-sensitive patients with hypertension. Hypertension 1991;18:805–12 [DOI] [PubMed] [Google Scholar]
- 28.Calhoun DA, Oparil S. Racial differences in the pathogenesis of hypertension. Am J Med Sci 1995;310(suppl 1):S86–90 [DOI] [PubMed] [Google Scholar]
- 29.Esposito K, Pontillo A, Di Palo C, Giugliano G, Masella M, Marfella R, Giugliano D. Effect of weight loss and lifestyle changes on vascular inflammatory markers in obese women: a randomized trial. JAMA 2003;289:1799–804 [DOI] [PubMed] [Google Scholar]
- 30.Hoffmann IS, Alfieri AB, Cubeddu LX. Salt-resistant and salt-sensitive phenotypes determine the sensitivity of blood pressure to weight loss in overweight/obese patients. J Clin Hypertens (Greenwich) 2008;10:355–61 [DOI] [PMC free article] [PubMed] [Google Scholar]
- 31.Agarwal R, Campbell RC, Warnock DG. Oxidative stress in hypertension and chronic kidney disease: role of angiotensin II. Semin Nephrol 2004;24:101–14 [DOI] [PubMed] [Google Scholar]
- 32.Hoch NE, Guzik TJ, Chen W, Deans T, Maalouf SA, Gratze P, Weyand C, Harrison DG. Regulation of T-cell function by endogenously produced angiotensin II. Am J Physiol Regul Integr Comp Physiol 2009;296:R208–16 [DOI] [PMC free article] [PubMed] [Google Scholar]
- 33.Garg JP, Bakris GL. Microalbuminuria: marker of vascular dysfunction, risk factor for cardiovascular disease. Vasc Med 2002;7:35–43 [DOI] [PubMed] [Google Scholar]
- 34.Stehouwer CD, Henry RM, Dekker JM, Nijpels G, Heine RJ, Bouter LM. Microalbuminuria is associated with impaired brachial artery, flow-mediated vasodilation in elderly individuals without and with diabetes: further evidence for a link between microalbuminuria and endothelial dysfunction—the Hoorn Study. Kidney Int Suppl 2004;Nov:S42–4 [DOI] [PubMed] [Google Scholar]
- 35.Sanders PW. Vascular consequences of dietary salt intake. Am J Physiol Renal Physiol 2009;297:F237–43 [DOI] [PMC free article] [PubMed] [Google Scholar]
- 36.Whelton PK, He J, Cutler JA, Brancati FL, Appel LJ, Follmann D, Klag MJ. Effects of oral potassium on blood pressure. JAMA 1997;277:1624–32 [DOI] [PubMed] [Google Scholar]
- 37.Livingstone MB, Prentice AM, Strain JJ, Coward WA, Black AE, Barker ME, McKenna PG, Whitehead RG. Accuracy of weighed dietary records in studies of diet and health. BMJ 1990;300:708–12 [DOI] [PMC free article] [PubMed] [Google Scholar]
- 38.McCabe RD, Young DB. Potassium inhibits cultured vascular smooth muscle cell proliferation. Am J Hypertens 1994;7:346–50 [DOI] [PubMed] [Google Scholar]
- 39.Dyer A, Elliott P, Chee D, Stamler J. Urinary biochemical markers of dietary intake in the INTERSALT study. Am J Clin Nutr 1997;65(suppl):1246S–53S [DOI] [PubMed] [Google Scholar]
- 40.Johnson RK, Goran MI, Poehlman ET. Correlates of over- and underreporting of energy intake in healthy older men and women. Am J Clin Nutr 1994;59:1286–90 [DOI] [PubMed] [Google Scholar]
- 41.Meneely GR, Ball CO. Experimental epidemiology of chronic sodium chloride toxicity and the protective effect of potassium chloride. Am J Med 1958;25:713–25 [DOI] [PubMed] [Google Scholar]
- 42.Fujita T, Ando K. Hemodynamic and endocrine changes associated with potassium supplementation in sodium-loaded hypertensives. Hypertension 1984;6:184–92 [PubMed] [Google Scholar]
- 43.McCabe RD, Bakarich MA, Srivastava K, Young DB. Potassium inhibits free radical formation. Hypertension 1994;24:77–82 [DOI] [PubMed] [Google Scholar]
- 44.Ng WY, Lui K, Thai A. Evaluation of a rapid screening test for microalbuminuria with a spot measurement of urine albumin-creatinine ratio. Ann Acad Med Singapore 2000;29:62–5. [PubMed] [Google Scholar]
- 45.Nathan DM, Rosenbaum C, Protasowicki V. Single-void urine samples can be used to estimate quantitative microalbuminuria. Diabetes Care 1987;10:414–8 [DOI] [PubMed] [Google Scholar]
- 46.Toft U, Kristoffersen L, Ladelund S, Bysted A, Jakobsen J, Lau C, Jorgensen T, Borch-Johnsen K, Ovesen L. Relative validity of a food frequency questionnaire used in the Inter99 study. Eur J Clin Nutr 2008;62:1038–46 [DOI] [PubMed] [Google Scholar]
Associated Data
This section collects any data citations, data availability statements, or supplementary materials included in this article.