Abstract
Ionizing radiation (IR) induces proapoptotic gene expression programs that inhibit cell survival. These programs often involve RNA-binding proteins that associate with their mRNA targets to elicit changes in mRNA stability and/or translation. The RNA-binding protein IMP-3 is an oncofetal protein overexpressed in many human malignancies. IMP-3 abundance correlates with tumor aggressiveness and poor prognosis. As such, IMP-3 is proving to be a highly significant biomarker in surgical pathology. Among its many mRNA targets, IMP-3 binds to and promotes translation of insulin-like growth factor II (IGFII) mRNA. Our earlier studies showed that reducing IMP-3 abundance with siRNAs reduced proliferation of human K562 chronic myeloid leukemia cells because of reduced IGF-II biosynthesis. However, the role of IMP-3 in apoptosis is unknown. Here, we have used IR-induced apoptosis of K562 cells as a model to explore a role for IMP-3 in cell survival. Knockdown of IMP-3 with siRNA increased susceptibility of cells to IR-induced apoptosis and led to reduced IGF-II production. Gene reporter assays revealed that IMP-3 acts through the 5′ UTR of IGFII mRNA during apoptosis to promote translation. Finally, culture of IR-treated cells with recombinant IGF-II partially reversed the effects of IMP-3 knockdown on IR-induced apoptosis. Together, these results indicate that IMP-3 acts in part through the IGF-II pathway to promote cell survival in response to IR. Thus, IMP-3 might serve as a new drug target to increase sensitivity of CML cells or other cancers to IR therapy.
Keywords: Apoptosis, Insulin-like Growth Factor (IGF), RNA Binding Protei, Translation Control, Translation Regulation, IMP-3, K562 Chronic Myeloid Leukemia Cells, VICKZ Proteins, γ Irradiation
Introduction
The human insulin-like growth factor II mRNA-binding protein (IMP)3 family consists of three closely related members: IMP-1, IMP-2, and IMP-3 (1, 2). IMP-1 is identical to the MYC coding region determinant-binding protein (CRD-BP). CRD-BP/IMP-1 stabilizes MYC mRNA by masking an endoribonucleolytic cleavage site in the coding region (3, 4). It also protects the coding region of βTrCP1 mRNA from miR-181-directed degradation (5). IMP-1 is also identical to the zipcode-binding protein-1 (ZBP-1). This protein binds β-actin mRNA and localizes it to lamellipodia for translation during cell movement (6, 7). IMP-2 is the most ubiquitously expressed IMP and is essential for cell motility; for example, muscle cells (8). IMP-3 is identical to both the human KH domain-containing protein overexpressed in cancer (KOC), first identified in pancreatic cancer, and to the Xenopus laevis Vg1 mRNA-binding protein (Vg1-RBP/Vera) (9–11). Vg1-RBP is a transforming growth factor β-like protein and a homologue of human KOC. These proteins have been collectively grouped into the VICKZ (Vg1 RBP/Vera, IMP, CRD-BP, KOC, and ZBP-1) family of RNA-binding proteins (2). As noted in the examples above, VICKZ proteins participate in the stability, localization, and translation of the mRNA subsets to which they bind. As such, VICKZ proteins are involved in cell polarity, migration, proliferation, and in cancer.
IMP-3 is largely expressed in fetal and neonatal mammals and in many cancers, suggesting that it is an oncofetal protein. IMP-3 appears early in mouse development, peaks at embryonic day 12.5, and then declines until birth (1). Its level is very low or absent in tissues of adult mammals. It is also expressed in human embryonic stem cells and may be required to control the stem cell state (12). IMP-3 protein and mRNA are elevated in many tumors with variable positivity, including pancreas, gastrointestinal tract, hepatobiliary, gynecologic, lung, lymphoid, thyroid, central nervous system, breast, bone, soft tissue, and many other tumors (13). These and other observations suggest that IMP-3 can serve as a biomarker for tumor aggressiveness and metastasis and that its expression correlates with a poorer prognosis in many cancers. Often, the distinction between low-grade and high-grade tumors and between reactive processes and malignant neoplasms can be quite challenging. From a practical point of view, the ability to measure IMP3 gene expression by RT-PCR has thus been proven to be invaluable in pathology practice. For example, detection of IMP3 mRNA in lesions initially diagnosed as indeterminate by cytology has permitted subsequent malignant diagnoses (13, 14).
As noted above, IMP-3 exerts its effects on gene expression and biological processes via the mRNAs to which it binds. Although to our knowledge most of its mRNA-binding targets remain uncharacterized, it was identified by its binding to insulin-like growth factor II (IGFII) mRNA. There are four IGFII mRNA isoforms, all with the same coding region and 3′ UTRs but four distinct 5′ UTRs designated leader-1 to leader-4, respectively (L1-L4) (15). L4 is 100 nt in length and promotes constitutive translation of IGFII mRNA. L3, a major isoform in mammalian cells, is 1170 nt long and highly (48%) cytidine-rich. L3 permits proliferation-dependent translation. In response to activation of mammalian target of rapamycin, L3 permits cap-independent translation of IGFII mRNA, and this requires IMP-2 (16). Messenger ribonucleoprotein immunoprecipitation experiments revealed that IMP-3 binds the L3 5′ UTR, and this promotes translation of the mRNA in proliferating cells (17). IMP-3 also binds the 3′ UTRs of all the IGFII mRNA isoforms, although the significance is not clear (18). The fetal growth factor IGF-II plays a pivotal role in embryonic development. Its expression is very high in the fetus and some tumors, whereas its abundance is greatly reduced or absent in adult tissues (19–27). Its oncofetal expression pattern is similar to that of IMP-3 (1). IGF-II also promotes cell survival and inhibits apoptosis (28–31). Thus, as an RNA-binding protein and translational regulator of IGFII mRNA (17), IMP-3 may also impact apoptosis.
Human chronic myeloid leukemia (CML) is a clonal hematopoietic stem cell disease presenting unregulated tyrosine kinase activity by the breakpoint cluster region and c-Abl oncoprotein (BCR-ABL) (32). Most CML patients possess the characteristic Philadelphia (Ph) chromosome, which is a translocation between chromosomes 9 and 22 that yields a fusion protein, BCR-ABL. BCR-ABL is a constitutively active, non-receptor tyrosine kinase in Ph+ CML cells. BCR-ABL activates numerous downstream signal transduction pathways, stimulating myeloid proliferation and causing resistance of CML cells to various chemo- and ionizing radiation (IR)-based therapies. Resistance to apoptosis can be reversed by specific inhibitors of BCR-ABL kinase activity, such as imatinib mesylate. However, CML cells have emerged with resistance to numerous kinase inhibitors (33). Thus, finding additional means to increase the susceptibility of CML cells to apoptosis could provide efficacy for combination therapy of chronic myeloid leukemia.
BCR-ABL also alters gene expression in a way that favors increased translation of mRNAs encoding antiapoptotic proteins (34). Given the aforementioned links between IMP-3 and IGFII gene expression, we examined the effects of IMP-3 on IR-induced apoptosis in the K562 CML cell model in this study. To this end, we reduced IMP-3 abundance by RNA interference in K562 cells undergoing IR-induced apoptosis and found that IMP-3 controls translation of IGFII mRNA during apoptosis. Moreover, IMP-3 knockdown significantly increased the susceptibility of cells to IR-induced apoptosis, at least in part through reduced IGF-II production. Thus, IMP-3 acts to promote cell survival after IR exposure.
EXPERIMENTAL PROCEDURES
siRNAs
Human IMP-3 SMARTpool siRNA and control siRNA duplexes (Dharmacon) were the same as those used previously (17, 35).
Cell Culture and RNA Interference
K562 cells (human, chronic myeloid leukemia in blast crisis, ATCC) were cultured in RPMI 1640 medium supplemented with 10% FBS, 2 mm glutamine (Invitrogen) at 37 °C in 5% CO2. Cells were transfected with siRNAs or buffer (mock control) by electroporation exactly as described (35). Cells were maintained for the times indicated in the figure legends. Knockdown efficiency was assessed by Western blot analysis of IMP-3.
Western Blot Analysis
Nuclear and cytoplasmic extracts were prepared from K562 cells using the CellLytic NuCLEARTM extraction kit (Sigma). Total protein concentration in extracts was examined by Bradford assay using the protein assay reagent (Bio-Rad) according to the manufacturer's protocol. For Western blot analysis, cytoplasmic (40 μg) and nuclear (20 μg) lysates were size-fractionated by SDS-PAGE and transferred onto nitrocellulose membranes (Fisher). Antibodies used and their dilutions were as follows: α-tubulin (Sigma) 1:8000, IMP-1 and IMP-3 1:5000 (17, 35), goat anti-mouse IgG (H+L) horseradish peroxidase conjugate (Promega) 1:2500, and goat anti-rabbit IgG horseradish peroxidase conjugate (Sigma) 1:3000. Detection and analyses were performed as described (17, 35).
ELISA
IGF-II concentrations in cytoplasmic lysates and culture media were examined by ELISA with the non-extraction IGF-II ELISA kit (Diagnostic Systems Laboratories, Inc.) exactly as described previously (35). A standard curve was prepared, and sample IGF-II concentrations were calculated using Prism software (version 2.0, GraphPad software).
Dual-luciferase Reporter Assay
The dual-luciferase reporter assay kit (Promega) was employed to assess luciferase activity following transfection of reporter plasmids and siRNAs exactly as described (17, 35). The plasmids utilized were pcDNA-IGF-II leader-3/luciferase (pcDNA-IGF-II-L3-Luc) and pcDNA-IGF-II leader-4/luciferase (pcDNA-IGF-II-L4-Luc, both provided by Dr. Jan Christiansen). These contain the firefly luciferase coding region and the complete IGF-II L3 or L4 exon, respectively, in plasmid pcDNA3.1 (Invitrogen). Plasmid pRL-SV40 (Promega) encoding Renilla luciferase served as an internal control. Firefly luciferase activity was normalized to Renilla luciferase activity in the same cell extract and plotted as a ratio of firefly/Renilla luciferase activity.
Quantitative real-time RT-PCR
Total RNA samples were prepared with the RNeasy kit (Qiagen) and digested with RNase-free DNase (Promega). IGF-II, IGF-II L3, IGF-II L4, luciferase, IMP-3, IMP-1, and GAPDH mRNA levels were determined by one-step, real-time, quantitative reverse transcription PCR (qRT-PCR) with the QuantiTect Probe RT-PCR kit (Qiagen) and the same dual-fluorescence labeled probes as described previously (17, 35).
γ Irradiation
Cells in culture medium were kept in the sample container and subjected to irradiation under a cesium-137 source with a Gammacell® 40 Exactor (Nordion International, Inc., Canada) at a dose rate of 0.92 Gy/min. The γ-irradiated cells were subsequently cultured for the indicated times. Untreated control cells were kept at room temperature for the same time as the irradiation time.
Analysis of Apoptosis
Apoptosis was examined by flow cytometry with the VybrantTM apoptosis assay kit #3 (annexin V-FITC/propidium iodide double staining kit, Molecular Probes) according to the manufacturer's protocol. Briefly, cells were harvested and washed in cold PBS. Five hundred thousand cells were resuspended in 100 μl of 1× annexin-binding buffer and incubated with 5 μl of FITC-labeled annexin V and 1 μl of 100 μg/ml propidium iodide (PI) working solution at room temperature for 20 min, followed by addition of 400 μl of 1× annexin-binding buffer, mixed gently, and kept on ice. After staining, apoptotic cells showed green fluorescence (annexin V-FITC-positive), dead cells showed red and green fluorescence, and live cells showed little or no fluorescence signal. Ten thousand events were analyzed with a FC-500 flow cytometer (Beckman Coulter), and percent apoptosis was determined with the included software.
Cell Survival Assay
Cell survival was assessed by MTS assay using the CellTiter 96® Aqueous One Solution cell proliferation assay kit (Promega). Briefly, 20 μl of CellTiter 96® Aqueous One Solution reagent, MTS (3-(4,5-dimethylthiazol-2yl)-5-(3-carboxymethoxyphenyl)-2-(4-sulfophenyl)-2H-tetrazolium), was added to each well of a 96-well culture plate containing K562 cells in 100 μl of culture medium. The plate was incubated for 2 h at 37 °C in 5% CO2. Absorbance was measured at 490 nm and a reference of 660 nm with an SLT Rainbow 96-well plate reader (Tecan). The 490-nm absorbance is directly proportional to the number of viable cells in culture.
Treatment of Cells with Recombinant Human IGF-II
Cells were cultured in 96-well plates for cell proliferation assays or 100-mm dishes for apoptosis analyses. Recombinant human IGF-II (Sigma), prepared in PBS following the manufacturer's instructions, was added to cell cultures at concentrations of 10, 100, 500 and 800 ng/ml, respectively. 20 μl/ml PBS alone and 500 ng/ml BSA (Sigma) dissolved in PBS were used as mock control and negative control, respectively. Cells were maintained for 48 h and used for analyses of apoptosis and proliferation as described above.
Statistical Analyses
Experimental results were analyzed by analysis of variance followed by Scheffé test or two-tailed Student's t test. The data were expressed as mean ± S.E. p < 0.05 was considered to be statistically significant.
RESULTS
IR Induces Apoptosis of K562 CML Cells
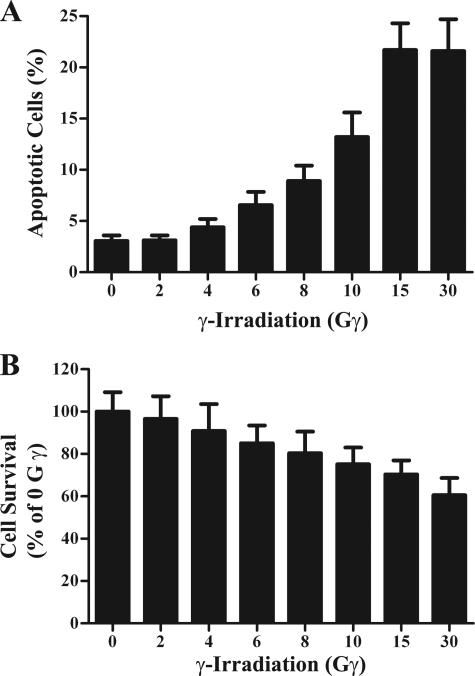
To explore roles for IMP-3 during apoptosis, we generated an apoptotic cell model by exposing K562 cells, a human chronic myeloid leukemia cell line (36), to IR. Cells were harvested 24 h after irradiation for examination of apoptosis by flow cytometric analyses with FITC annexin V/PI double staining and examination of cell survival by MTS assay. Phosphatidylserine is normally located on the cytoplasmic surface of the cell membrane, but it translocates from the inner to the outer leaflet of the plasma membrane during apoptosis but not during necrosis (37). Annexin V, the human anticoagulant, can bind phosphatidylserine with high affinity. Fluorescein isothiocyanate-labeled annexin V (FITC annexin V) was used for identification of apoptotic cells. The red-fluorescent, nucleic acid-binding dye PI stains necrotic cells. However, it is impermeable to live cells and apoptotic cells. PI staining was used to exclude dead cells in the analysis. After immunostaining, these populations among 10,000 cells were identified by flow cytometry. IR induced apoptosis in K562 cells (Fig. 1A) and was confirmed by reduced cell survival (B). IR doses ranging from 2–15 Gy led to 3–21% apoptosis (Fig. 1A). Increasing the dose to 30 Gy increased the percentage of necrotic cells (not shown) but not the percentage of apoptotic cells (Fig. 1). This suggests that K562 cells are somewhat resistant to IR. Clinically relevant doses are typically 2 Gy (38). Thus, the ability of IR to induce apoptosis was dose-dependent from 2–15 Gy. For this reason, 15 Gy IR was chosen for subsequent experiments because approximately 70% of cells still survived at this dose of irradiation (Fig. 1B).
FIGURE 1.
γ-Irradiation induces apoptotic cell death. Cells were exposed to varying doses of γ-irradiation and maintained 24 h under normal culture conditions. Cells were then examined for apoptosis by cytometry with FITC annexin V/PI double staining (n = 6) (A) and cell survival by MTS assay (n = 20) (B). The experiment was repeated three times independently.
IMP-3 Knockdown Enhances IR-induced Apoptosis
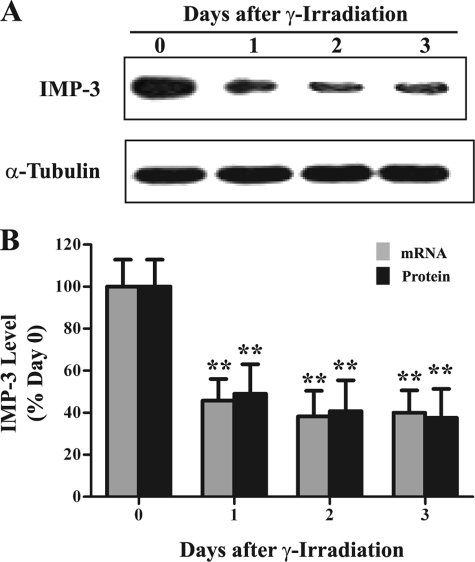
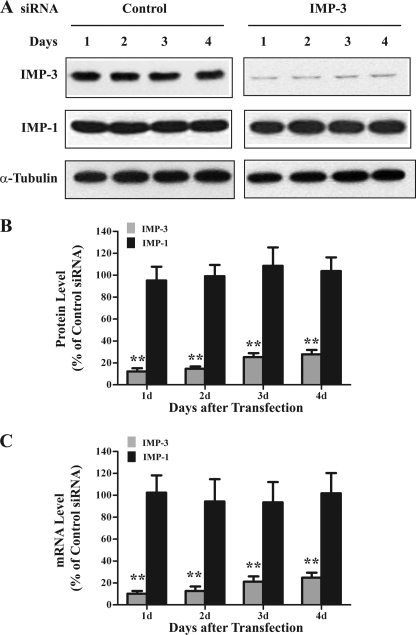
IMP-3 is an RNA-binding protein and translational activator of IGFII mRNA with the L3 5′ UTR (1, 17). IGF-II is a growth factor that promotes cell proliferation and inhibits apoptosis. However, a relationship between IMP-3 and apoptosis is unknown. To address this issue, we first examined IMP3 gene expression during IR-induced apoptosis. Both IMP-3 protein and mRNA levels were reduced by 50–60% 1–3 days after IR exposure compared with unexposed cells (Fig. 2, p < 0.01). These results suggest that the remaining IMP-3 might contribute to the resistance of K562 cells to IR-induced apoptosis. Accordingly, the abundance of IMP-3 was reduced by RNA interference in K562 cells. Equal amounts of IMP-3 siRNA or negative control siRNA were transfected into K562 cells. An equal volume of oligonucleotide buffer without siRNAs (i.e. buffer only) served as a mock control. IMP-3 protein and mRNA levels were examined by Western blot analysis and qRT-PCR, respectively. Transfection of IMP-3 siRNA reduced cytoplasmic protein (Fig. 3, A and B) and mRNA levels (C) by 70–85% during the 4-day time course compared with the control siRNA transfection. The buffer-only (not shown) and control siRNA transfections had no effect on IMP-3 protein and mRNA abundance (Fig. 3). IMP-3 knockdown did not alter either α-tubulin (Fig. 3A) or IMP-1 (A and B) protein levels compared with the control siRNA transfection, indicating knockdown specificity.
FIGURE 2.
IR reduces IMP3 gene expression. Cytoplasmic IMP-3 protein and mRNA levels were assayed by Western blot analysis and qRT-PCR, respectively, in IR-treated K562 cells. A, Western blot analysis of IMP-3 and α-tubulin following IR exposure. B, quantitative analyses of qRT-PCRs and Western blot analyses (n = 6). GAPDH mRNA served as an internal control for qRT-PCR. α-Tubulin was used as a loading control for the Western blot analysis. The experiment was repeated three times independently.
FIGURE 3.
Selective knockdown of IMP-3 in K562 cells. A, representative Western blot analyses for IMP-3, IMP-1, and α-tubulin cytoplasmic protein abundance 1–4 days after transfection of control and IMP-3 siRNAs. B, quantitative analyses of the indicated Western blot analyses (n = 6). α-Tubulin served as a loading control. C, quantitative analyses of qRT-PCRs for the indicated mRNAs following transfection of control and IMP-3 siRNAs (n = 6). For B and C, results are plotted as a percentage of levels compared with control siRNA-transfected cells. The experiment was performed three times independently. **, p < 0.01.
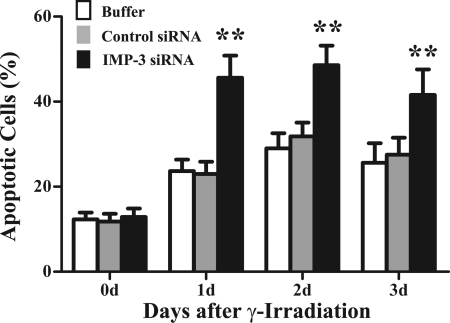
K562 cells transfected with IMP-3 siRNA, control siRNA, or buffer only were cultured 24 h, exposed to 15 Gy γ-irradiation, and maintained 1–3 days in culture. Cells were examined for apoptosis by annexin V/PI double staining and flow cytometry. Non-transfected cells that were not exposed to IR served as a basal apoptosis control. The percentage of apoptotic cells under these basal conditions was typically 2–5%. Cells transfected by electroporation with buffer only, control siRNA, or IMP-3 siRNA showed about 10–13% apoptosis after 2 days (data not shown). This suggests that although electroporation may induce apoptosis in a small percentage of cells, knockdown of IMP-3 does not in itself promote apoptosis. However, IR exposure of cells transfected with buffer only or control siRNA increased the percentage of apoptotic cells to 20–28% during the 3-day time course, with a peak 2 days after irradiation (Fig. 4). By contrast, IMP-3 knockdown increased the percentage of apoptotic cells to 40–50% between 1–3 days (Fig. 4, p < 0.01). These results were confirmed by cell survival assays (data not shown). These findings suggest that IMP-3 knockdown significantly increases the susceptibility of cells to apoptosis induced by IR. Thus, we next investigated a possible mechanism by which IMP-3 regulates apoptosis.
FIGURE 4.
IMP-3 knockdown enhances IR-induced apoptosis. K562 cells were transfected with control siRNA, IMP-3 siRNA, or buffer only and maintained under normal culture conditions. Twenty-four hours later, cells were exposed to 15 Gy IR and cultured for an additional 1–3 days. Apoptosis was assessed by annexin V/PI double staining/flow cytometry. Quantitations of the percentage of apoptotic cells over the time course are shown (n = 6), with statistical comparisons of cells transfected with IMP-3 siRNA to cells transfected with control siRNA. The experiment was repeated three times independently. **, p < 0.01.
IMP-3 Knockdown Reduces Translation of IGFII mRNA in Cells Exposed to IR
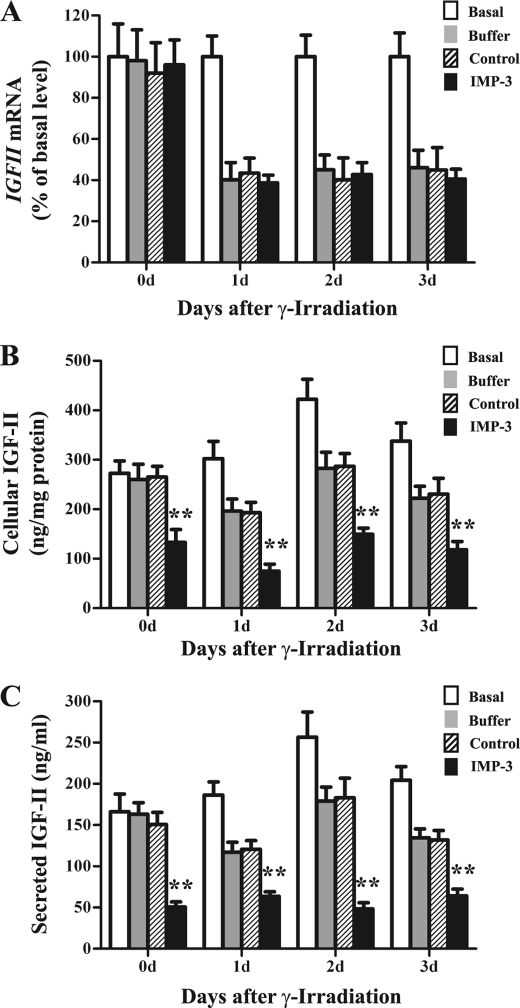
IMP-3 binds to and promotes translation of IGFII mRNA with the L3 5′ UTR during cell proliferation (17). To determine whether IMP-3 has similar effects on IGFII gene expression in cells exposed to IR, IMP-3 abundance was reduced by siRNA transfection immediately after induction of apoptosis by IR. IGF-II protein and mRNA levels were examined thereafter. IMP-3 knockdown had no obvious effect on IGFII mRNA levels (Fig. 5A, Basal), consistent with previous studies (17). However, IR significantly decreased IGFII mRNA levels 1–3 days after IR (Fig. 5A). Concomitant IMP-3 knockdown did not further reduce IGFII mRNA levels compared with control siRNA transfections (Fig. 5A). Accordingly, we examined IGF-II protein levels after combined IR exposure and IMP-3 knockdown. As expected, IR decreased both cellular and secreted IGF-II protein levels compared with basal conditions (i.e. no transfection and no IR exposure, Fig. 5, B and C). However, concomitant IMP-3 knockdown further decreased IGF-II protein levels by 48–62% compared with control siRNA-transfected cells (Fig. 5, B and C, p < 0.01). These results suggest that IMP-3 can promote translation of IGFII mRNA during apoptosis.
FIGURE 5.
Effects of IMP-3 knockdown on IGFII gene expression during apoptosis. After 15-Gy IR, cells were immediately transfected with control siRNA, IMP-3 siRNA, or buffer only and maintained for 0–3 days. Cells were assessed for IGFII mRNA by qRT-PCR (A), intracellular protein by Western blot analysis (B), and secreted protein by ELISA of cell culture supernatants (C). The experiment was repeated three times independently. For each experiment, n = 6. Basal, cells not transfected and not exposed to IR. **, p < 0.01.
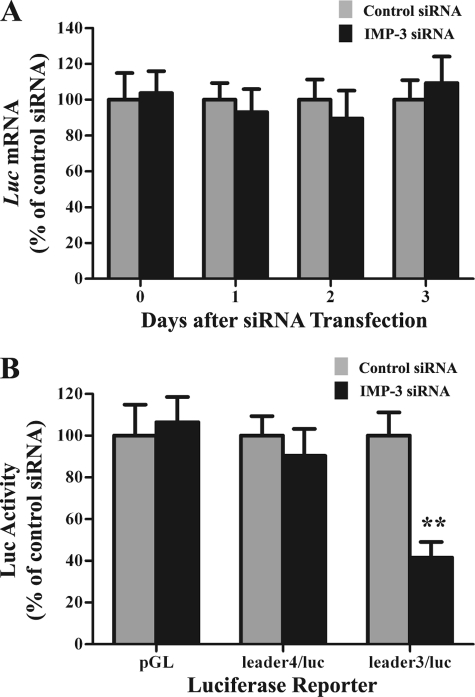
Consequently, we examined the effects of IR and IMP-3 knockdown on translation of reporter mRNAs. Cells were exposed to IR. Twenty-four hours later, cells were cotransfected with IMP-3 siRNA or control siRNA together with the pcDNA-IGF-II-L3/luciferase or pcDNA-IGF-II-L4/luciferase reporter plasmids and the pRL-SV40 Renilla luciferase plasmid (as an internal control). IMP-3 knockdown had no effects on mRNA levels, as expected (Fig. 6A). However, IMP-3 knockdown significantly reduced IGFII L3-mediated luciferase activity by approximately 60% (Fig. 6B, p < 0.01). There was little effect on L4-mediated luciferase activity or control firefly luciferase activity (i.e. pGL) 48 h after transfection compared with control siRNA transfection (Fig. 6B, p > 0.05), even though L4 IGFII mRNA is also a binding target of IMP-3 (17). Similar results were obtained at 24 and 72 h after transfection (data not shown). These results indicate that IMP-3 knockdown reduces IGFII gene expression by reducing translation of the L3 mRNA isoform during apoptosis.
FIGURE 6.
IMP-3 knockdown reduces translation of IGFII L3/luciferase reporter mRNA in cells exposed to IR. Cells were exposed to 15-Gy IR and maintained in culture for 24 h. Cells were then cotransfected with control siRNA or IMP-3 siRNA together with either the IGFII L3/luciferase or IGFII L4/luciferase reporter plasmids and the Renilla pRL-SV40 internal control plasmid. The plasmid pGL-Promoter, containing the coding region of firefly luciferase, was used as a negative control. A, luciferase mRNA levels were assessed by qRT-PCR (n = 6). B, luciferase activities are plotted as the ratio of firefly/Renilla luciferase (n = 6). The experiment was performed three times independently. luc, luciferase; pGL, pGL-Promoter plasmid. **, p < 0.01.
Recombinant Human IGF-II Reduces Apoptosis Induced by IR and IMP-3 Knockdown
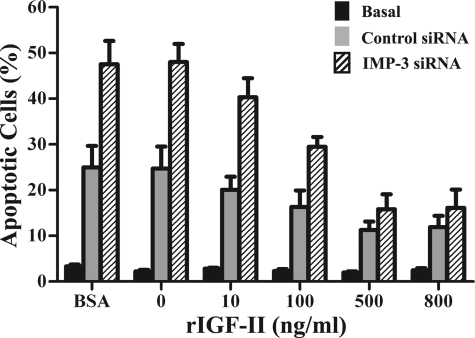
The above results indicate that IR and IMP-3 knockdown may exert their effects on apoptosis through IGFII gene expression. To address this, recombinant human IGF-II was applied to cell cultures. Cells were transfected with IMP-3 siRNA or control siRNA and 24 h later, cells were exposed to 15 Gy γ-irradiation and maintained in culture medium supplemented with either 500 ng/ml BSA; PBS alone (i.e. 0 ng/ml); or 10, 100, 500, or 800 ng/ml human IGF-II, respectively, for 48 h. IMP-3 knockdown markedly enhanced IR-induced apoptosis, as expected (Fig. 7, p < 0.01). BSA or PBS alone (0 ng/ml IGF-II) did not reduce the percentage of apoptotic cells, also as expected (Fig. 7, p > 0.05). By contrast, addition of recombinant IGF-II at concentrations of 10, 100, 500 and 800 ng/ml to irradiated cells transfected with control siRNA decreased the percentage of apoptotic cells by 20%, 35% (p < 0.05), 55% (p < 0.01), and 53% (gray bars in Fig. 7, p < 0.01), respectively, compared with the BSA control. These results are consistent with the antiapoptotic property of IGF-II. Moreover, recombinant IGF-II significantly reduced the percentage of apoptotic cells in a dose-dependent manner from 10 to 500 ng/ml in irradiated cells transfected with IMP-3 siRNA (Fig. 7, shaded bars) compared with BSA-treated cells transfected with IMP-3 siRNA (Fig. 7, shaded bars, p < 0.01). Additionally, 800 ng/ml recombinant IGF-II decreased the percentage of apoptotic cells with IMP-3 knockdown to that of cells transfected with control siRNA (i.e. the difference is not statistically significant, p > 0.05, Fig. 7). As we noted earlier, transfection by electroporation induces apoptosis in 10–12% of cells. Thus, IGF-II does not reduce the percentage of apoptotic cells to that of cells under basal conditions (no transfection, no IR) in which 2–3% of cells undergo apoptosis (Fig. 7, black bars). Taken together, these results indicate that IMP-3-IGF-II represents an important axis promoting cell survival in response to IR exposure.
FIGURE 7.
Recombinant human IGF-II reduces IR-induced apoptosis upon IMP-3 knockdown. Cells were transfected with control siRNA or IMP-3 siRNA and maintained 24 h in culture. Cells were then exposed to 15-Gy IR and incubated with 10, 100, 500, or 800 ng/ml recombinant human IGF-II or the same volume of PBS alone (0 ng/ml IGF-II) or 500 ng/ml BSA for 48 h. Apoptosis was examined by annexin V/PI double staining and flow cytometry (n = 5). For statistical analyses described in the text, results from distinct treatments were compared with that observed in the BSA-treated cells transfected with control siRNA, unless noted otherwise. The experiment was repeated three times independently. Basal, non-transfected cells, no IR exposure. Control siRNA, control siRNA-transfected cells exposed to IR. IMP-3 siRNA, IMP-3 siRNA-transfected cells exposed to IR. rIGF-II, recombinant human IGF-II; BSA, 500 ng/ml bovine serum albumin.
DISCUSSION
γ-irradiation induces DNA damage and subsequent apoptosis. Several known pathways controlling apoptosis involve proteins such as BRCA1, E2F-1, and p53 (39, 40). The fetal growth factor IGF-II inhibits apoptosis and promotes cell proliferation. Our earlier work identified the RNA-binding protein IMP-3 as a translational activator of IGFII mRNA and a protein abundantly expressed in K562 CML cells (17). As K562 cells appear relatively resistant to IR-induced apoptosis (Fig. 1), we speculated that resistance may be due in part to IMP-3-dependent synthesis of IGF-II. Indeed, although IR exposure led to reduced IMP-3 protein and mRNA, it remained relatively abundant. However, >90% knockdown of IMP-3 by siRNA transfection led to a substantial increase in apoptosis (Fig. 4). The effect of IMP-3 knockdown was due in part to reduced IGF-II secretion because application of recombinant IGF-II to cultures restored resistance to IR-induced apoptosis (Fig. 7), i.e. exogenous IGF-II reduced the percentage of apoptotic cells in response to IR. Thus, the ability of IMP-3 to maintain IGF-II secretion after IR exposure promotes maintenance of cell survival.
RNA-binding proteins and microRNAs continue to emerge as essential regulators of gene expression, especially in the processes of apoptosis and cell survival during stresses. For example, UVC irradiation induces AUF1 binding to bcl2 mRNA, which promotes degradation of bcl2 mRNA, permitting apoptosis (41). IR leads to global dissociation of HuR from its mRNA-binding targets, which promotes cell survival (42). By contrast, the apoptosis-inducing agent etoposide induces HuR expression and its binding to XIAP (X chromosome-linked inhibitor of apoptosis) mRNA. This promotes translation of XIAP mRNA and confers cytoprotection from etoposide (43). Likewise, a number of microRNAs control apoptosis, and their expression patterns are predictive of the outcomes of chemo- and radiotherapy (44, 45). For example, miR-21 modulates sensitivity to doxorubicin (46), miR-148a promotes apoptosis by targeting bcl2 (47), and microRNA expression profiles even change in response to exposure of cells to IR (38).
Another emerging theme is that the actions of RNA-binding proteins and microRNAs are not always mutually exclusive (48). For example, phosphorylation of RNA-binding protein Pumilio in response to EGF alters local RNA structure in the p27Kip 3′ UTR to unmask a binding site for miR-221/222. This represses p27 synthesis, permitting cell cycle entry (49). How might IMP-3 control translation of IGFII mRNA? Perhaps IMP-3 controls microRNA access like IMP-1 does for βTrCP mRNA (50). This might also explain the significance of IMP-3 binding to both the 5′ and 3′ UTRs of selected IGFII mRNA isoforms. There may be microRNAs that span both untranslated regions. There is precedence for microRNA bridging (51). Indeed, a search of the miR-Bridge database suggests that IGFII 5′ and 3′ UTRs could potentially be bridged by several microRNAs, including miR-10a/b, miR-15b, and miR-152, among others (51). Future work will be required to address possible roles for IMP-3 in microRNA-mediated translational control of IGFII mRNA.
In any event, it is no wonder that IMP-3 can serve as a biomarker for tumor aggressiveness and that its expression levels correlate with metastasis and poor prognosis (13). This is likely due to additional mRNA targets beside IGFII mRNA. For example, IMP-3 plays important roles controlling genes required for cell adhesion and motility (52). Clearly, it is important that future work characterize the regulation of its likely myriad mRNA targets to identify new pathways through which IMP-3 acts to control tumor aggressiveness and resistance to IR. Nonetheless, our work suggests that IMP-3 may be a novel target for drugs that affect its ability to bind its mRNA targets. In the case of IGFII mRNA, this could conceivably confer increased sensitivity of tumors to IR to increase efficacy of chemo-and-IR combination therapies.
Acknowledgments
We thank Dr. Jan Christiansen for providing the pcDNA-IGF-II leader-3 and leader-4 luciferase reporter plasmids and Dr. David Herrick for providing IMP antibodies.
This work was supported, in whole or in part, by National Institutes of Health Grant R01 CA052443 (to G. B.).
- IMP
- IGF-II mRNA-binding protein
- CML
- chronic myeloid leukemia
- BCR-ABL
- breakpoint cluster region and c-Abl oncoprotein
- IR
- ionizing radiation
- Gy
- Gray
- PI
- propidium iodide
- MTS
- 3-(4,5-dimethylthiazol-2yl)-5-(3-carboxymethoxyphenyl)-2-(4-sulfophenyl)-2H-tetrazolium
- qRT-PCR
- quantitative RT-PCR
- UTR
- untranslated region.
REFERENCES
- 1. Nielsen J., Christiansen J., Lykke-Andersen J., Johnsen A. H., Wewer U. M., Nielsen F. C. (1999) Mol. Cell. Biol. 19, 1262–1270 [DOI] [PMC free article] [PubMed] [Google Scholar]
- 2. Yisraeli J. K. (2005) Biol. Cell 97, 87–96 [DOI] [PubMed] [Google Scholar]
- 3. Bernstein P. L., Herrick D. J., Prokipcak R. D., Ross J. (1992) Genes Dev. 6, 642–654 [DOI] [PubMed] [Google Scholar]
- 4. Prokipcak R. D., Herrick D. J., Ross J. (1994) J. Biol. Chem. 269, 9261–9269 [PubMed] [Google Scholar]
- 5. Elcheva I., Goswami S., Noubissi F. K., Spiegelman V. S. (2009) Mol. Cell 35, 240–246 [DOI] [PMC free article] [PubMed] [Google Scholar]
- 6. Ross A. F., Oleynikov Y., Kislauskis E. H., Taneja K. L., Singer R. H. (1997) Mol. Cell. Biol. 17, 2158–2165 [DOI] [PMC free article] [PubMed] [Google Scholar]
- 7. Hüttelmaier S., Zenklusen D., Lederer M., Dictenberg J., Lorenz M., Meng X., Bassell G. J., Condeelis J., Singer R. H. (2005) Nature 438, 512–515 [DOI] [PubMed] [Google Scholar]
- 8. Boudoukha S., Cuvellier S., Polesskaya A. (2010) Mol. Cell. Biol. 30, 5710–5725 [DOI] [PMC free article] [PubMed] [Google Scholar]
- 9. Müeller-Pillasch F., Lacher U., Wallrapp C., Micha A., Zimmerhackl F., Hameister H., Varga G., Friess H., Büchler M., Beger H. G., Vila M. R., Adler G., Gress T. M. (1997) Oncogene 14, 2729–2733 [DOI] [PubMed] [Google Scholar]
- 10. Elisha Z., Havin L., Ringel I., Yisraeli J. K. (1995) EMBO J. 14, 5109–5114 [DOI] [PMC free article] [PubMed] [Google Scholar]
- 11. Havin L., Git A., Elisha Z., Oberman F., Yaniv K., Schwartz S. P., Standart N., Yisraeli J. K. (1998) Genes Dev. 12, 1593–1598 [DOI] [PMC free article] [PubMed] [Google Scholar]
- 12. Kim C. G., Lee J. J., Jung D. Y., Jeon J., Heo H. S., Kang H. C., Shin J. H., Cho Y. S., Cha K. J., Do B. R., Kim K. S., Kim H. S. (2006) Mol. Cells 21, 343–355 [PubMed] [Google Scholar]
- 13. Findeis-Hosey J. J., Xu H. (2011) Hum. Pathol. 42, 303–314 [DOI] [PubMed] [Google Scholar]
- 14. Mueller F., Bommer M., Lacher U., Ruhland C., Stagge V., Adler G., Gress T. M., Seufferlein T. (2003) Br. J. Cancer 88, 699–701 [DOI] [PMC free article] [PubMed] [Google Scholar]
- 15. van Dijk E. L., Sussenbach J. S., Holthuizen P. E. (2001) Nucleic Acids Res. 29, 3477–3486 [DOI] [PMC free article] [PubMed] [Google Scholar]
- 16. Dai N., Rapley J., Angel M., Yanik M. F., Blower M. D., Avruch J. (2011) Genes Dev. 25, 1159–1172 [DOI] [PMC free article] [PubMed] [Google Scholar]
- 17. Liao B., Hu Y., Herrick D. J., Brewer G. (2005) J. Biol. Chem. 280, 18517–18524 [DOI] [PubMed] [Google Scholar]
- 18. Nielsen J., Kristensen M. A., Willemoës M., Nielsen F. C., Christiansen J. (2004) Nucleic Acids Res. 32, 4368–4376 [DOI] [PMC free article] [PubMed] [Google Scholar]
- 19. Zhang Q., Berggren P. O., Tally M. (1997) J. Biol. Chem. 272, 23703–23706 [DOI] [PubMed] [Google Scholar]
- 20. Macaulay V. M. (1992) Br. J. Cancer 65, 311–320 [DOI] [PMC free article] [PubMed] [Google Scholar]
- 21. Khandwala H. M., McCutcheon I. E., Flyvbjerg A., Friend K. E. (2000) Endocr. Rev. 21, 215–244 [DOI] [PubMed] [Google Scholar]
- 22. Singh P., Dai B., Yallampalli C., Xu Z. (1994) Am. J. Physiol. 267, G608–617 [DOI] [PubMed] [Google Scholar]
- 23. Tally M., Li C. H., Hall K. (1987) Biochem. Biophys. Res. Commun. 148, 811–816 [DOI] [PubMed] [Google Scholar]
- 24. Hammarberg B., Tally M., Samuelsson E., Wadensten H., Holmgren E., Hartmanis M., Hall K., Uhlén M., Moks T. (1991) J. Biol. Chem. 266, 11058–11062 [PubMed] [Google Scholar]
- 25. Sandberg A. C., Engberg C., Lake M., von Holst H., Sara V. R. (1988) Neurosci. Lett. 93, 114–119 [DOI] [PubMed] [Google Scholar]
- 26. Yi H. K., Hwang P. H., Yang D. H., Kang C. W., Lee D. Y. (2001) Eur. J. Cancer 37, 2257–2263 [DOI] [PubMed] [Google Scholar]
- 27. Pepe M. G., Ginzton N. H., Lee P. D., Hintz R. L., Greenberg P. L. (1987) J. Cell Physiol. 133, 219–227 [DOI] [PubMed] [Google Scholar]
- 28. Zapf J., Froesch E. R. (1986) Horm. Res. 24, 121–130 [DOI] [PubMed] [Google Scholar]
- 29. Jones J. I., Clemmons D. R. (1995) Endocr. Rev. 16, 3–34 [DOI] [PubMed] [Google Scholar]
- 30. Sun F. L., Dean W. L., Kelsey G., Allen N. D., Reik W. (1997) Nature 389, 809–815 [DOI] [PubMed] [Google Scholar]
- 31. Weksberg R., Shen D. R., Fei Y. L., Song Q. L., Squire J. (1993) Nat. Genet. 5, 143–150 [DOI] [PubMed] [Google Scholar]
- 32. Quintás-Cardama A., Cortes J. (2009) Blood 113, 1619–1630 [DOI] [PMC free article] [PubMed] [Google Scholar]
- 33. Diamond J. M., Melo J. V. (2011) Leuk. Lymphoma 52, 12–22 [DOI] [PubMed] [Google Scholar]
- 34. Perrotti D., Harb J. G. (2011) Leuk. Lymphoma 52, 30–44 [DOI] [PMC free article] [PubMed] [Google Scholar]
- 35. Liao B., Patel M., Hu Y., Charles S., Herrick D. J., Brewer G. (2004) J. Biol. Chem. 279, 48716–48724 [DOI] [PubMed] [Google Scholar]
- 36. Lozzio C. B., Lozzio B. B. (1975) Blood 45, 321–334 [PubMed] [Google Scholar]
- 37. Coxon K. M., Duggan J., Cordeiro M. F., Moss S. E. (2011) Methods Mol. Biol. 731, 293–308 [DOI] [PubMed] [Google Scholar]
- 38. Niemoeller O. M., Niyazi M., Corradini S., Zehentmayr F., Li M., Lauber K., Belka C. (2011) Radiat. Oncol. 6, 29. [DOI] [PMC free article] [PubMed] [Google Scholar]
- 39. Ahn J., Urist M., Prives C. (2004) DNA Repair 3, 1039–1047 [DOI] [PubMed] [Google Scholar]
- 40. Bartek J., Lukas J. (2003) Cancer Cell 3, 421–429 [DOI] [PubMed] [Google Scholar]
- 41. Lapucci A., Donnini M., Papucci L., Witort E., Tempestini A., Bevilacqua A., Nicolin A., Brewer G., Schiavone N., Capaccioli S. (2002) J. Biol. Chem. 277, 16139–16146 [DOI] [PubMed] [Google Scholar]
- 42. Masuda K., Abdelmohsen K., Kim M. M., Srikantan S., Lee E. K., Tominaga K., Selimyan R., Martindale J. L., Yang X., Lehrmann E., Zhang Y., Becker K. G., Wang J. Y., Kim H. H., Gorospe M. (2011) EMBO J. 30, 1040–1053 [DOI] [PMC free article] [PubMed] [Google Scholar]
- 43. Durie D., Lewis S. M., Liwak U., Kisilewicz M., Gorospe M., Holcik M. (2011) Oncogene 30, 1460–1469 [DOI] [PMC free article] [PubMed] [Google Scholar]
- 44. Hummel R., Hussey D. J., Haier J. (2010) Eur. J. Cancer 46, 298–311 [DOI] [PubMed] [Google Scholar]
- 45. Wang Y., Lee C. G. (2009) J. Cell Mol. Med. 13, 12–23 [DOI] [PMC free article] [PubMed] [Google Scholar]
- 46. Tao J., Lu Q., Wu D., Li P., Xu B., Qing W., Wang M., Zhang Z., Zhang W. (2011) Oncol. Rep. 25, 1721–1729 [DOI] [PubMed] [Google Scholar]
- 47. Zhang H., Li Y., Huang Q., Ren X., Hu H., Sheng H., Lai M. (2011) Cell Death Differ., in press [DOI] [PMC free article] [PubMed] [Google Scholar]
- 48. George A. D., Tenenbaum S. A. (2006) RNA Biol. 3, 57–59 [DOI] [PubMed] [Google Scholar]
- 49. Kedde M., van Kouwenhove M., Zwart W., Oude Vrielink J. A., Elkon R., Agami R. (2010) Nat. Cell Biol. 12, 1014–1020 [DOI] [PubMed] [Google Scholar]
- 50. Noubissi F. K., Elcheva I., Bhatia N., Shakoori A., Ougolkov A., Liu J., Minamoto T., Ross J., Fuchs S. Y., Spiegelman V. S. (2006) Nature 441, 898–901 [DOI] [PubMed] [Google Scholar]
- 51. Lee I., Ajay S. S., Yook J. I., Kim H. S., Hong S. H., Kim N. H., Dhanasekaran S. M., Chinnaiyan A. M., Athey B. D. (2009) Genome Res. 19, 1175–1183 [DOI] [PMC free article] [PubMed] [Google Scholar]
- 52. Vikesaa J., Hansen T. V., Jønson L., Borup R., Wewer U. M., Christiansen J., Nielsen F. C. (2006) EMBO J. 25, 1456–1468 [DOI] [PMC free article] [PubMed] [Google Scholar]


