Abstract
Cellobiohydrolase I (Cel7A) of the fungus Trichoderma reesei (now classified as an anamorph of Hypocrea jecorina) hydrolyzes crystalline cellulose to soluble sugars, making it of key interest for producing fermentable sugars from biomass for biofuel production. The activity of the enzyme is pH-dependent, with its highest activity occurring at pH 4–5. To probe the response of the solution structure of Cel7A to changes in pH, we measured small angle neutron scattering of it in a series of solutions having pH values of 7.0, 6.0, 5.3, and 4.2. As the pH decreases from 7.0 to 5.3, the enzyme structure remains well defined, possessing a spatial differentiation between the cellulose binding domain and the catalytic core that only changes subtly. At pH 4.2, the solution conformation of the enzyme changes to a structure that is intermediate between a properly folded enzyme and a denatured, unfolded state, yet the secondary structure of the enzyme is essentially unaltered. The results indicate that at the pH of optimal activity, the catalytic core of the enzyme adopts a structure in which the compact packing typical of a fully folded polypeptide chain is disrupted and suggest that the increased range of structures afforded by this disordered state plays an important role in the increased activity of Cel7A through conformational selection.
Keywords: Biophysics, Enzyme Structure, Neutron Scattering, Protein Stability, Protein Structure, Biofuels, Cellobiohydrolase I, Cellulose, Small Angle Neutron Scattering
Introduction
Lignocellulosic biomass has the potential to be a plentiful feedstock for the production of biofuels. One of the main challenges to realizing this renewable energy source lies in mastering the process of producing fermentable sugars from the recalcitrant complex of cellulose, hemicellulose, and lignin that comprises lignocellulosic biomass. The fungus Trichoderma reesei (now classified as an anamorph of Hypocrea jecorina) breaks down biomass to meet its energy demands (1, 2) and efficiently degrades biomass into sugars by producing several enzymes with complementary activities. Due to its high levels of enzyme production, T. reesei is the primary commercial source of cellulases. Developing a fundamental understanding of their enzymatic mechanisms is one key to engineering improvements capable of increasing biofuel yields from biomass.
Of key interest among these enzymes is the cellobiohydrolase I (Cel7A)5 due to its ability to bind to and disrupt the surface of crystalline cellulose (3). As Cel7A progresses along the cellulose surface, the glucan chain that enters the active site tunnel is processively cleaved, releasing cellobiose (glucose dimer) units that are later hydrolyzed to glucose by the T. reesei β-glucosidase. The disruption of the cellulose surface by Cel7A also enables the endoglucanases and cellobiohydrolase II (Cel6) to degrade the cellulose chains further. These synergistic interactions result in rapid hydrolysis of crystalline cellulose. Thus, Cel7A carries out a critical first step in producing sugars that can be readily fermented into bioethanol.
Cellobiohydrolases such as Cel7A share a common organization of three general domains (4). A catalytic core is connected to a cellulose binding domain by a short linker. In Cel7A, these domains have 436, 36, and 24 amino acid residues, respectively. The enzyme is highly glycosylated (5–9), with sites on the catalytic core and linker.
The tertiary structure of Cel7A has been studied using a variety of techniques. Although the high resolution structure of the intact holoenzyme has not been determined, possibly due to difficulties in crystallization that result from the glycosylated and unstructured linker, the structures of the catalytic core and cellulose binding domains have been determined by crystallography (10, 11) and NMR (12), respectively. The catalytic core has an egg-like, globular structure with a long cleft identified as the binding site for the glucan chain (11). The cellulose binding domain is an antiparallel β-sheet (12) folded into a wedge-like shape that yields an amphipathic character. The low resolution structure of the intact enzyme has also been studied by small angle x-ray scattering (SAXS) (13, 14) and EM (15). The experiments performed at neutral pH found the enzyme to have a compact core with an extended tail (13–15). This shape was also found for a cellobiohydrolase from the fungus Humincola insolens (16), suggesting that cellobiohydrolases from different species share a common structure.
T. reesei is an acidophilic organism typically cultivated at pH 4.8 or 5.0. Its cellulases function optimally at acidic pH between 3 and 5 (17, 18). In particular, pH values between 4 and 5 are optimal for Cel7A (17, 18). Further, an acidic pH confers thermal stability to Cel7A (19). The pI values calculated from the amino acid sequences of the three domains (20) indicate that the catalytic core has a pI of 4.3, whereas those of the cellulose binding domain and linker are 6.4 and 12.3, respectively. The glycosylation of the enzyme is variable, resulting in a range of pI values for the holoenzyme. Isoforms having pI values between 3.5 and 4.2 are found depending on the growth conditions and the specific strain of the fungus (8, 9).
The mechanism driving the increased catalytic activity at acidic pH remains to be explored. It is possible that the pH-driven changes in the protonation states of key residues are responsible for the increase in activity. The pI of the catalytic core of the enzyme is very near the peak in the activity of the enzyme. A physical mechanism may also play a role in the activity of the enzyme. Changes in the relationship between the cellulose binding domain and the catalytic core could impact access of cellulose to the active site of the enzyme. A structural characterization of the enzyme as a function of pH is required to understand the activity of the enzyme better.
Here, we present a small-angle neutron scattering (SANS) study of the structure of Cel7A in a series of solutions of decreasing pH ranging from 7.0 to 4.2, the latter being the pH at which the enzyme is known to be the most active. At the higher pH values measured, the structure has features that are consistent with the high resolution structures of the catalytic core of the enzyme (10, 11) and the cellulose binding domain (12). The SANS data of Cel7A collected at pH 4.2 demonstrate that the enzyme undergoes a pH-dependent conformational change. Analysis and modeling of the SANS data indicate that the change is consistent with the catalytic core of the enzyme transitioning to a state intermediate between the compact structure determined by crystallography (10, 11) and a fully denatured ensemble. The scattering at pH 4.2 is not consistent with an ensemble of structures generated using the available high resolution structures of the domains of the enzyme (10–12) connected by flexible linkers. The results provide new insight into the structural basis for the pH-dependent activity of the enzyme that suggests that conformational selection (21–23) plays an important role in the function of the enzyme.
EXPERIMENTAL PROCEDURES
Sample Preparation
Cel7A was purified from a commercial culture filtrate produced by submerged fermentation of T. reesei QM9414 (Sigma-Aldrich) by ion-exchange and chromatofocusing chromatography using a method described previously (24). An AKTA basic chromatography system (GE Healthcare) was used for chromatofocusing and gel filtration. Polybuffer 74 was removed from the Cel7A following chromatofocusing by gel filtration on Superdex-200 (GE Healthcare) in 50 mm sodium citrate at the desired pH values for the studies. The Cel7A eluted as a single peak with a retention time consistent with elution of Cel7A monomers based on the reported molecular mass (25). The purified enzyme was shown by isoelectric focusing with a Phast Gel system (GE Healthcare) to have a major band with pI of 4.2 and a minor band with pI of 4.0.
CD Spectroscopy
CD measurements for Cel7A were collected at the series of pH values (4.2, 5.3, 6.0, and 7.0) using a Jasco J-810 CD spectrometer. Data were collected at room temperature in 1-mm path length quartz cuvettes. Spectra were recorded every 0.1 nm from 250 to 190 nm, but strong absorption by the buffer caused the data quality to be unacceptable below 200 nm.
SANS Measurements
SANS measurements were performed using the Center for Structural Molecular Biology Bio-SANS instrument at the High Flux Isotope Reactor of Oak Ridge National Laboratory (26). The wavelength was 6.0 Å, and the wavelength spread, Δλ/λ, was set to 0.14. To provide sufficient q range for the data analysis (0.025 Å−1 to 0.25 Å−1), a single sample-to-detector distance was used, namely 1.1 m. Both the pH 4.2 and 5.3 data were measured at an additional sample-to-detector distance, namely 6.8 m, to provide additional low q data (down to ∼0.007 Å−1) to verify that the samples were free of high molecular mass contaminants and aggregates at low pH. Data were corrected for transmission, detector sensitivity, dark current (electronic noise), and sample background according to standard procedures. The corrected data were azimuthally averaged to produce the one-dimensional intensity profile I(q) versus q.
SANS Data Analysis and Modeling
The small angle scattering intensity profile of monodisperse, identical particles in solution is given by Equation 1 (27),
 |
where ρ(r→) is the scattering length density of the particle as a function of position r→ within the particle volume V; ρs is the scattering length density of the solvent; and q→ is the momentum transfer, having the magnitude q = 4πsin(θ)/λ, where 2θ is the scattering angle and λ is the wavelength. The integration in Equation 1 is an ensemble and orientational average over all particles in the incident beam.
The radius of gyration, Rg, was determined according to Guinier and Fournet (27). Data were also analyzed for the distance distribution function, P(r). P(r) provides the frequency of distances between scattering centers within an object. The scattered intensity I(q) is related to P(r) by the Fourier transform in Equation 2,
 |
The indirect Fourier transform algorithm implemented in the software GNOM (28) was used to determine P(r) from measured intensity profiles. The boundary conditions P(r) = 0 at r = 0 and at the maximum linear dimension, dmax, were imposed to ensure proper behavior. dmax was a free parameter in the fitting. In addition to providing dmax, P(r) fitting also provides a second measure of Rg, which is the second moment of P(r). The uncertainty in dmax was estimated by testing GNOM with dmax values near the best fitting value. All data were analyzed over the same q range to provide consistency in the information content in the data.
Kratky plots (q2I(q) versus q) (29) were produced from the SANS data. A Kratky plot accentuates the scattering data at higher q values, making the decay behavior of the scattering curve readily apparent. It is known that a compact particle small angle scattering curve decays as q−4 (30), whereas a random polymer chain decays as q−1 (29). Kratky plots are useful for differentiating between compact and unfolded structures (31). A Kratky plot will display a slope of +1 at high q for a completely unfolded protein and a slope of −2 for a compact protein. Kratky plots are highly sensitive to background subtraction issues that can result from the incoherent scattering of neutrons by hydrogen. To build confidence in the plots, a constant base line was applied, and several values of the base line on the order of the experimental uncertainty in the data were tested to ensure that the features observed were not the result of subtle errors in background correction.
Structural modeling of Cel7A from the SANS data was accomplished using two different approaches. Restoration of the molecular envelope of the enzyme from the SANS data, representing the shape of the surface of the structure, was accomplished through the use of GA_STRUCT (32). All data were modeled over the same q range to provide consistency in the information content in the data. A set of 25 models was generated from each SANS dataset and used to produce the consensus envelope, representing the structure consistent across the set of models.
Additional structural modeling employed the ensemble optimization modeling method described by Bernado and co-workers (33). The modeling employed the crystallographic structure of the catalytic core of Cel7A (Protein Data Bank ID code 1CEL) (10) to which hydrogen atoms were added using the software WHAT-IF (34) and the NMR structure of the cellulose binding domain (12). It was not possible to create gylycosylated models using the software. However, because the total molecular mass of the sugars is much smaller than the total molecular mass of the enzyme, the resulting structures are reasonable representations of the conformations adopted by the enzyme in solution. The default options were used for the calculations with the exception of the number of points generated for the intensity calculation (101 instead of the default 51).
The H++ method (35, 36) was employed to calculate approximate pKa values of all the residues of Cel7A from the 6CEL (11) crystal structure. This method is based on classical continuum electrostatics and statistical mechanics calculations. A residue was considered as protonated when its pKa value is larger than the pH of the solution.
RESULTS
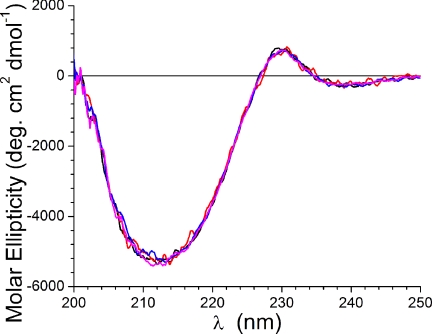
The CD spectra for Cel7A collected at the four pH values is shown in Fig. 1. The spectra indicate a very high β-structure content, as is expected based on the known structures of the domains of the enzyme (10–12). The data indicate that the secondary structure of the protein does not change significantly in response to decreasing the pH from 7.0 to 4.2.
FIGURE 1.
CD data collected for Cel7A at pH 7.0 (magenta), 6.0 (blue), 5.3 (red), and 4.2 (black).
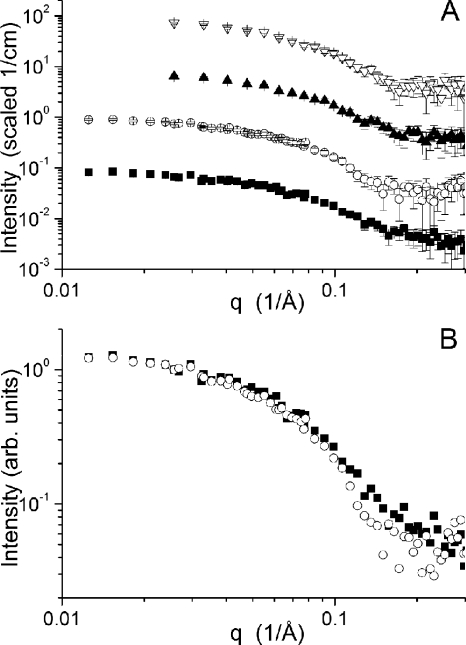
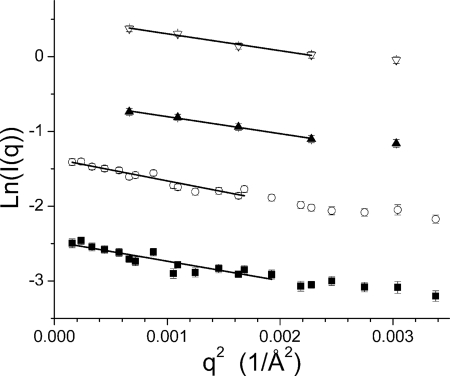
The SANS intensity profiles for Cel7A measured at the four pH values and the associated Guinier fits (27) are shown in Figs. 2 and 3, respectively. Beam time limitations did not allow the pH 6.0 and pH 7.0 samples to be measured in both configurations. Instead, only the shorter of the two instrument configurations were measured, yet the minimum q value accessible to this configuration (0.025/Å) is sufficient for the data analysis and modeling for a particle of this size, as can be seen in the two datasets collected at lower pH. The scattering data collected under the three solution conditions have a similar overall character, indicating that the gross features of the structures are similar. However, a clear difference is seen in the high q data, for which the profile collected at pH 4.2 lacks the break in the slope above q = 0.15 Å−1 visible in the three datasets collected at higher pH. This difference at high q is highlighted in Fig. 2B, where the pH 5.3 and pH 4.2 data are shown scaled relative to one another. The Guinier plots, which used all of the data available for each sample, are linear, suggesting that the particles are free of significant interparticle interference and aggregation. The Rg values of the pH 7.0, 6.0, 5.3, and 4.2 structures are 26.1 ± 2.1 Å, 26.1 ± 2.3 Å, 29.7 ± 1.2 Å, and 28.0 ± 1.4 Å, respectively.
FIGURE 2.
A, SANS data collected for Cel7A at pH 7.0 (▿), 6.0 (▴), 5.3 (○), and 4.2 (■). The curves have been offset for clarity. B, SANS data collected at pH 5.3 (○) and 4.2 (■) overlaid to make the differences between the curves more apparent.
FIGURE 3.
Guinier plots and fits for the SANS data collected for Cel7A at pH 7.0 (▿), 6.0 (▴), 5.3 (○), and 4.2 (■). The fit curves are the solid black lines. The curves have been offset for clarity.
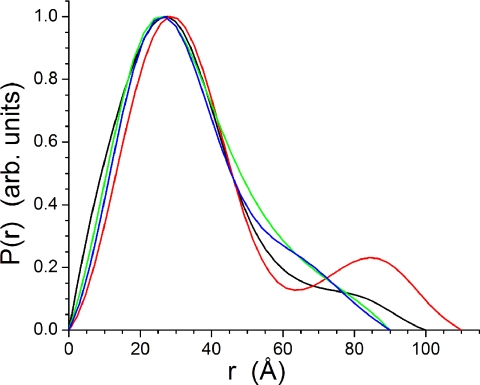
The P(r) profiles derived from the SANS data using GNOM are shown in Fig. 4. All of the fittings utilized the same q range to ensure reliable comparison. The profiles have very similar shapes and positions for the main peak, being at 27–28 Å. At the two highest pH values studied, the profiles trail off to a dmax of 90 ± 5 Å. There are subtle differences between the profiles, with the P(r) found at pH 7.0 having a clear indication of a shoulder near 65 Å that does not exist in the profile derived from the pH 6.0 data. The P(r) derived from the pH 5.3 data has a clear secondary maximum at 85 Å that provides a dmax of 110 ± 5 Å. Finally, at pH 4.2, the P(r) contracts slightly to a dmax of 100 ± 5 Å, and there is no secondary maximum. Instead, the profile decays with a tail to dmax.
FIGURE 4.
P(r) curves derived from the SANS data at pH 7. 0 (blue), pH 6.0 (green), pH 5.3 (red), and pH 4.2 (black) using the program GNOM (28). The curves have been scaled to a maximum height of 1.0 for ready comparison.
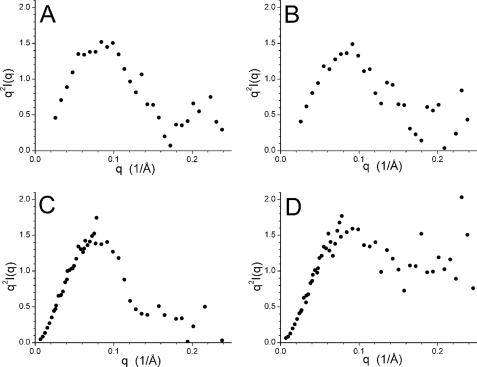
Kratky plots generated from the data are shown in Fig. 5. The data collected at pH 7.0, 6.0, and 5.3 possess a single peak and decay to zero at higher q values. This behavior is consistent with both a compact particle (31) and with structured domains connected by a flexible linker (37). The relative sizes of the catalytic core and the remainder of the structure raise the possibility that the effect of changes in their spatial relationship may not be visible on a Kratky plot. In contrast, the SANS data collected for Cel7A at pH 4.2 do not decay to zero at higher q values. Instead, the data level off to a non-zero value after decaying from the maximum value. Such a Kratky plot clearly indicates the presence of increased disorder and/or flexibility in the structure, which is intermediate between a fully folded, compact structure and a completely denatured configurational ensemble of random coil structures (31).
FIGURE 5.
Kratky plots generated from the SANS data collected for Cel7A at pH 7.0 (A), pH 6.0 (B), pH 5.3 (C), and pH 4.2 (D).
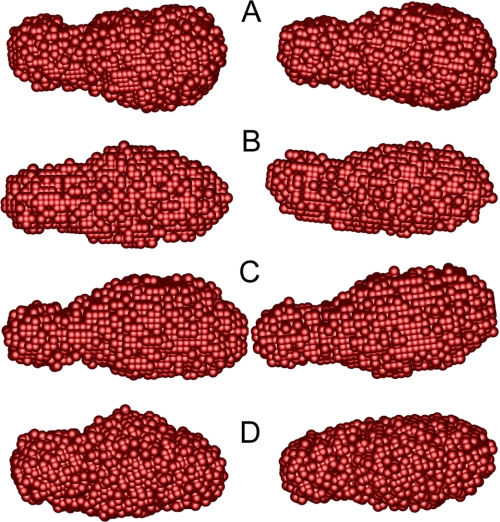
Shape restoration was applied to the SANS data using the program GA_STRUCT (32) to visualize the shape of the enzyme in solution. The resulting consensus envelopes for the pH values studied are shown in Fig. 6. The structures do not differ greatly, being ellipsoidal structures roughly twice as long as they are wide. The similarity of the models is consistent with the P(r) analysis, including the increased length of the pH 5.3 structure. The catalytic core of Cel7A is egg-shaped (10, 11), and it is 67 Å long with a cross-sectional width that varies between 41 and 57 Å at the widest point. All of the models generated from the SANS data are clearly narrowed toward one end of the structure. The widest points of the models are ∼45 Å, which is in reasonable agreement with the high resolution structure in light of the nature of the consensus envelopes (32). The narrowed ends of the models suggest a separation of the cellulose binding domain from the catalytic core. A model produced in this manner is the single structure that best fits what are in fact data from an ensemble of structures that results from the unstructured nature of the linker connecting the two domains and the very small size of the linker and cellulose binding domain relative to the catalytic core. Therefore, the narrowed end of the model structures should be considered only to represent an average region of density resulting from these structures rather than a distinct location occupied by the structures.
FIGURE 6.
Consensus envelopes generated by GA_STRUCT (32) from the SANS data collected for Cel7A at pH 7.0 (A), pH 6.0 (B), pH 5.3 (C), and pH 4.2 (D). Two orthogonal views of each model are shown, rotated around the long axis of the model.
The volumes of the consensus envelopes at pH 7.0, 6.0, and 4.2 are consistent and are in reasonable agreement with the expected volume of the enzyme (∼65,000 Å3). In contrast, the volume of the consensus envelope derived from the pH 5.3 data is ∼30% larger than expected, which raises the possibility that the enzyme has adopted a more flexible conformation than in the other pH conditions that gives rise to a larger ensemble of structures (38). The Kratky plot at pH 5.3 does decay at higher q values as is expected for a compact particle, but there is a suggestion of a tail to the curve. One explanation for this behavior is that the relationship between the catalytic core and the cellulose binding domain might have a much higher degree of variability than the conformational state adopted at the other pH values studied. Interestingly, the changes in the enzyme at pH 4.2 indicated by the Kratky plot do not produce an increased volume in the consensus envelope. Taking the CD results into account, the envelope volumes suggest that the relationship between the cellulose binding domain and the catalytic core at pH 4.2 is comparable with their relationship at pH 7.0, but the catalytic core has adopted a more flexible state in which the properly folded polypeptide chain is not tightly packed as it is at higher pH values, leading to the changes observed in the Kratky plot.
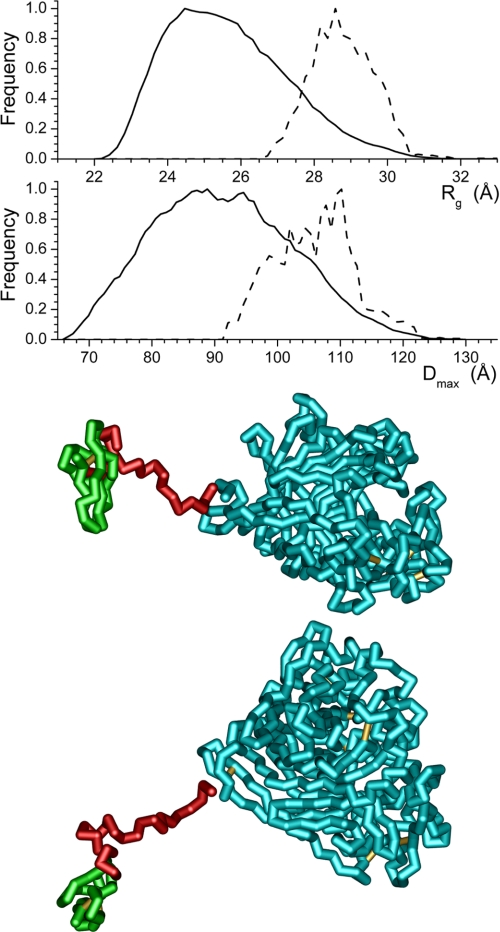
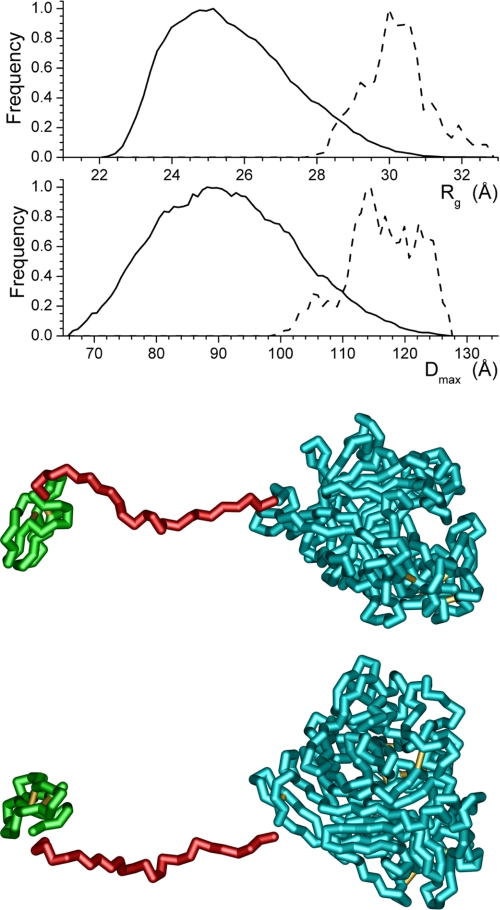
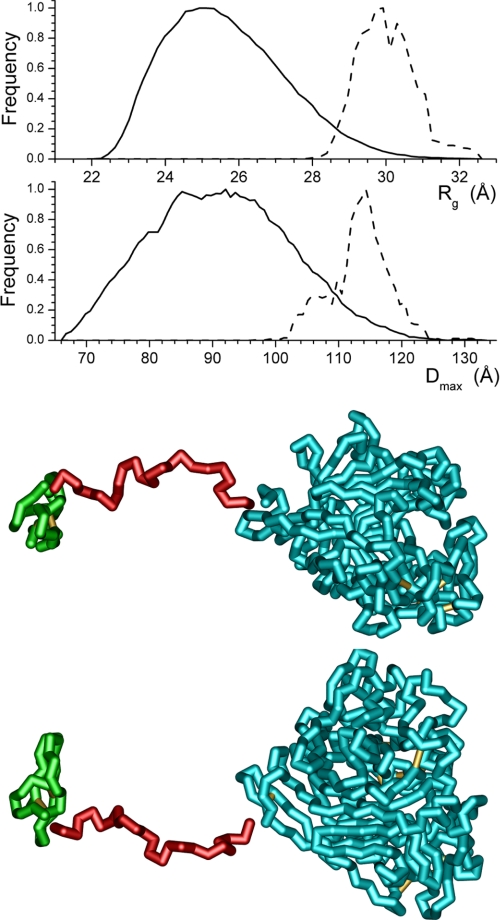
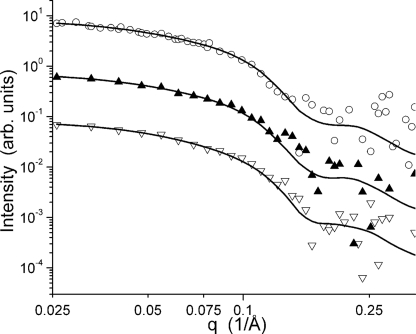
To understand better the change in the relationship between the cellulose binding domain and the catalytic core that takes place between pH 7.0 and pH 5.3, ensemble optimization modeling (33) was applied. In light of the nature of the data at pH 4.2 and the domination of the SANS data by the large catalytic core, application of this method of modeling the data is not appropriate at this pH. The Rg and dmax distributions of the structures generated, the distributions of the structures selected during the ensemble optimization, and the structure having the highest frequency in the optimized population are shown for pH 7.0 (Fig. 7), pH 6.0 (Fig. 8), and pH 5.3 (Fig. 9). Although the generated ensembles of structures have essentially the same distributions of Rg and dmax, as would be expected given the identical structures and amino acid sequences used for the modeling, the populations selected during the ensemble optimization processes implemented in the software utilized differ. At pH 6.0 and 5.3, the selected populations of structures are very similar and can be considered the same. In contrast, at pH 7.0, the distribution of structures selected during optimization clearly differs from those found for the other two pH values. The best fit profiles determined by the modeling process are shown in Fig. 10. The fits to the data are excellent, and it is important to note that although the distributions of selected structures found by the modeling differ, the feature in the model curves above 0.15 Å−1, which can be attributed to the catalytic core of the enzyme, is essentially unaltered.
FIGURE 7.
Structure distributions produced by the EOM modeling (33) from the SANS data collected at pH 7.0 using the high resolution structure of the catalytic core (10, 11) (shown in cyan) and cellulose binding domain (12) (shown in green). The solid lines are the distributions produced by the software, whereas the dashed lines are the final distributions of structural parameters from the models selected by the ensemble optimization process. The structure shown, which is the selected model having the highest frequency, is rotated 90° about the long axis of the structure to produce the two views. The breaks in the structure at the ends of the linker are shown to highlight the domains.
FIGURE 8.
Structure distributions produced by the EOM modeling (28) from the SANS data collected at pH 6.0 using the high resolution structure of the catalytic core (10, 11) (shown in cyan) and cellulose binding domain (12) (shown in green). The solid lines are the distributions produced by the software, whereas the dashed lines are the final distributions of structural parameters from the models selected by the ensemble optimization process. The structure shown, which is the selected model having the highest frequency, is rotated 90° about the long axis of the structure to produce the two views. The breaks in the structure at the ends of the linker are shown to highlight the domains.
FIGURE 9.
Structure distributions produced by the EOM modeling (28) from the SANS data collected at pH 5.3 using the high resolution structure of the catalytic core (10, 11) (shown in cyan) and cellulose binding domain (12) (shown in green). The solid lines are the distributions produced by the software, whereas the dashed lines are the final distributions of structural parameters from the models selected by the ensemble optimization process. The structure shown, which is the selected model having the highest frequency, is rotated 90° about the long axis of the structure to produce the two views. The breaks in the structure at the ends of the linker are shown to highlight the domains.
FIGURE 10.
Fits of the best profiles determined by the EOM modeling (33) to the SANS data collected at pH 7.0 (▿), 6.0 (▴), and 5.3 (○).
DISCUSSION
The degradation of biomass and cellulose, in particular, by fungi for food involves a concerted attack by several enzymes, including Cel7A. This process has attracted the attention of researchers who hope to leverage these enzymes in an industrial setting for the cost-effective production of biofuels. The SANS study presented here demonstrates that Cel7A undergoes a pH-driven transition between conformational states without a significant disruption of its secondary structure, providing new insight into the function of the enzyme.
The size and shape of the enzyme studied here at neutral pH are very similar to what were seen in previous studies of intact Cel7A. Early SAXS studies found a tadpole-like structure, having a head very similar in size to the models produced in the current work (13, 14). However, the length of the tail determined from the SAXS data in both studies was considerably longer, extending to 180 Å. The P(r) determined from the SAXS data is quite consistent in shape with the P(r) determined from the present SANS data, again except for the very long tail observed in the SAXS experiments. The authors of the earlier study suggested that a small amount of aggregation may have been present in the SAXS samples that was not observed with analytical ultracentrifugation (13), which could result in an artificially extended tail in the P(r) curve. A later EM study of the enzyme that employed negative staining generally supported the SAXS results, although the structure was found to have a dmax of 134 Å (15), which is considerably shorter than the earlier SAXS results, but longer than the dmax found in the current study.
The increase in average separation between the catalytic core and cellulose binding domain as the pH decreases from 7.0 to 5.3 is relatively subtle, but can be seen in the data and models. Such changes are not unexpected as the net charge of the domains of the enzyme changes with decreasing pH. The relatively extended state of the linker is consistent with the known glycosylation of the enzyme even though the models produced here lack glycosylation. The linker region is heavily glycosylated, with between one and three mannose at the nine serine and threonine residues (6, 7). The glycosylation sites used in recent molecular dynamics simulations of Cel7A (39, 40) are toward the C terminus of the linker (Thr-451, Thr-452, Thr-453, Ser-455, and Ser-456). The other glycosylation sites on the linker, Thr-443, Thr-444, Thr-445, and Thr-446, lie next to the catalytic domain in the model. These bulky groups in the linker region may help stabilize the extended conformation of the linker region, leaving the cellulose binding domain free to bind to cellulose rather than interacting with the catalytic core.
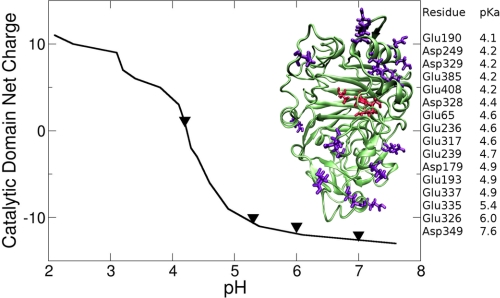
Electrostatics calculations on the enzyme shed light on the origin of the pH-dependent change. The results, shown in Fig. 11, suggest little change in the net charge of the catalytic domain at the three pH values at which the SANS profile also changes little (pH 7.0, 6.0, and 5.3), but then an abrupt and strong change in the net charge of the enzyme takes place between pH 5.3 and 4.2, with the net charge changing from −10 to 0. This strong change is likely to be responsible for the disordering effect seen in the SANS Kratky plot. The residues affected are also shown in the figure and are distributed throughout the domain, consistent with a global change. Most of the ionizable residues listed with Fig. 11 lie on surface of the catalytic domain and are far from the active site pocket.
FIGURE 11.
Left, calculated net charge of the catalytic domain as a function of the solution pH; triangles indicate the pH values of the SANS experiments. A schematic representation of the enzyme is shown in the inset, with the ionizable residues in violet and the catalytic residues in red. Right, approximate pKa values of the ionizable groups calculated employing the H++ method (35, 36).
The transition to the less structurally ordered state indicated by the SANS data collected at pH 4.2 suggests that disorder, or more likely flexibility, in the catalytic core is important for optimal activity of Cel7A. The SANS data suggest that the structure is not completely denatured by the acidic pH, whereas the CD data show that the secondary structure of Cel7A does not change. Fully denatured proteins can be readily identified from their SAXS and SANS profiles (for recent examples, see Refs. 41–43) as well as their CD spectrum, and the Rg of an unfolded protein is significantly larger than the native structure, which is not the case for Cel7A at pH 4.2. However, the Kratky plot at pH 4.2 shows clear evidence of some degree of disorder. According to random polymer theory, in cases where the scattering object obeys Gaussian statistics, a Kratky plot will contain a plateau in the q range 3Rg−1 < q < 1.4b−1, where b is the statistical length of the polymer chain, which has been seen in proteins denatured by guanidinium chloride (44). Some evidence of random polymer-like behavior is visible at pH 4.2 in Fig. 5. Taken together, the results presented here suggest that the catalytic core becomes flexible at pH 4.2 while retaining its secondary structure. One possibility would be some flexibility in packing between the secondary structural elements. This change would enhance flexibility, affording a broader ensemble of structures in solution than would exist if the catalytic core remained well ordered. Such a broader ensemble of structures would favor conformational selection, in which a ligand (cellulose) drives the selection of a functional enzyme structure from an ensemble of structures, over an induced fit mechanism of action, in which the ligand binds to the single, functional conformation of an enzyme (21–23).
Increased flexibility in the catalytic core of the enzyme has the potential to enhance substrate access to the active site. The structure of the catalytic core of the enzyme shows a well defined, long cleft into which the glucose chain must insert (10, 11). The cleft can be seen in the structure shown in Figs. 7–9 and is better described as a tunnel if the structure is viewed as a space-filling model. An increase in the flexibility of the structure of the catalytic core could allow the cleft to adopt conformations that are more open to the surrounding environment, making it easier for the enzyme to latch onto a glucose chain, starting the process of hydrolysis. The importance of a partially unfolded state of a protein for substrate recognition and binding has been described previously (45). Given the structure of crystalline cellulose, the increased binding opportunities afforded by a partially disordered structure would prove highly beneficial for extracting sugars from lignocellulosic biomass.
CONCLUSIONS
The current SANS study provides insight into the pH dependence of the structure of Cel7A and how it correlates with the activity of the enzyme. The structures above pH 5.0 are consistent with a model in which the linker domain adopts an ensemble of extended conformations and the catalytic core of the enzyme retains a well structured state. When exposed to acidic pH below 5.0, the SANS data demonstrate that the global structure of the enzyme changes into one with increased flexibility. This pH-dependent conformational change is well correlated with the known increase in catalytic activity of the enzyme and the pI of the Cel7A determined during the sample preparation.
Acknowledgment
We thank Mai Zahran for assistance.
This work was supported by the Genomic Science Program, Office of Biological and Environmental Research, U.S. Department of Energy, under Contract FWP ERKP752. The research at Oak Ridge National Laboratory Center for Structural Molecular Biology (CSMB) was supported by the Office of Biological and Environmental Research under Contract FWP ERKP291, using facilities supported by the U.S. Department of Energy. Oak Ridge National Laboratory is managed by UT-Battelle, LLC for the U.S. Department of Energy under Contract DE-AC05-00OR22725.
- Cel7A
- cellobiohydrolase I
- SANS
- small angle neutron scattering
- SAXS
- small angle x-ray scattering.
REFERENCES
- 1. Fägerstam L. G., Pettersson L. G., Engstrom J. A. (1984) FEBS Letters 167, 309–315 [Google Scholar]
- 2. Henrissat B., Driguez H., Viet C., Schulein M. (1985) BioTechnology 3, 722–726 [Google Scholar]
- 3. Lee I., Evans B. R., Woodward J. (2000) Ultramicroscopy 82, 213–221 [DOI] [PubMed] [Google Scholar]
- 4. Shoemaker S., Schweickart V., Ladner M., Gelfand D., Kwok S., Myambo K., Innis M. (1983) BioTechnology 1, 691–696 [Google Scholar]
- 5. Klarskov K., Piens K., Ståhlberg J., Høj P. B., Beeumen J. V., Claeyssens M. (1997) Carbohydr. Res. 304, 143–154 [DOI] [PubMed] [Google Scholar]
- 6. Harrison M. J., Nouwens A. S., Jardine D. R., Zachara N. E., Gooley A. A., Nevalainen H., Packer N. H. (1998) Eur. J. Biochem. 256, 119–127 [DOI] [PubMed] [Google Scholar]
- 7. Hui J. P. M., Lanthier P., White T. C., McHugh S. G., Yaguchi M., Roy R., Thibault P. (2001) J. Chromatogr. Biomed. Sci. Appl. 752, 349–368 [DOI] [PubMed] [Google Scholar]
- 8. Stals I., Sandra K., Devreese B., Van Beeumen J., Claeyssens M. (2004) Glycobiology 14, 725–737 [DOI] [PubMed] [Google Scholar]
- 9. Stals I., Sandra K., Geysens S., Contreras R., Van Beeumen J., Claeyssens M. (2004) Glycobiology 14, 713–724 [DOI] [PubMed] [Google Scholar]
- 10. Divne C., Ståhlberg J., Reinikainen T., Ruohonen L., Pettersson G., Knowles J. K. C., Teeri T. T., Jones T. A. (1994) Science 265, 524–528 [DOI] [PubMed] [Google Scholar]
- 11. Divne C., Ståhlberg J., Teeri T. T., Jones T. A. (1998) J. Mol. Biol. 275, 309–325 [DOI] [PubMed] [Google Scholar]
- 12. Kraulis P. J., Clore G. M., Nilges M., Jones T. A., Pettersson G., Knowles J., Gronenborn A. M. (1989) Biochemistry 28, 7241–7257 [DOI] [PubMed] [Google Scholar]
- 13. Schmuck M., Pilz I., Hayn M., Esterbauer H. (1986) Biotechnol. Lett. 8, 397–402 [Google Scholar]
- 14. Abuja P. M., Schmuck M., Pilz I., Tomme P., Claeyssens M., Esterbauer H. (1988) Eur. Biophys. J. Biophys. Lett. 15, 339–342 [Google Scholar]
- 15. Lee H. J., Brown R. M. (1997) J. Biotechnol. 57, 127–136 [Google Scholar]
- 16. Receveur V., Czjzek M., Schülein M., Panine P., Henrissat B. (2002) J. Biol. Chem. 277, 40887–40892 [DOI] [PubMed] [Google Scholar]
- 17. Boer H., Teeri T. T., Koivula A. (2000) Biotechnol. Bioeng. 69, 486–494 [DOI] [PubMed] [Google Scholar]
- 18. Becker D., Braet C., Brumer H., 3rd, Claeyssens M., Divne C., Fagerström B. R., Harris M., Jones T. A., Kleywegt G. J., Koivula A., Mahdi S., Piens K., Sinnott M. L., Ståhlberg J., Teeri T. T., Underwood M., Wohlfahrt G. (2001) Biochem. J. 356, 19–30 [DOI] [PMC free article] [PubMed] [Google Scholar]
- 19. Boer H., Koivula A. (2003) Eur. J. Biochem. 270, 841–848 [DOI] [PubMed] [Google Scholar]
- 20. Gasteiger E., Gattiker A., Hoogland C., Ivanyi I., Appel R. D., Bairoch A. (2003) Nucleic Acids Res. 31, 3784–3788 [DOI] [PMC free article] [PubMed] [Google Scholar]
- 21. Boehr D. D., Nussinov R., Wright P. E. (2009) Nat. Chem. Biol. 5, 789–796 [DOI] [PMC free article] [PubMed] [Google Scholar]
- 22. Csermely P., Palotai R., Nussinov R. (2010) Trends Biochem. Sci. 35, 539–546 [DOI] [PMC free article] [PubMed] [Google Scholar]
- 23. Ma B., Nussinov R. (2010) Curr. Opin. Chem. Biol. 14, 652–659 [DOI] [PMC free article] [PubMed] [Google Scholar]
- 24. Evans B. R., Margalit R., Woodward J. (1994) Arch. Biochem. Biophys. 312, 459–466 [DOI] [PubMed] [Google Scholar]
- 25. Woodward J., Brown J. P., Evans B. R., Affholter K. A. (1994) Biotechnol. Appl. Biochem. 19, 141–153 [PubMed] [Google Scholar]
- 26. Lynn G. W., Heller W., Urban V., Wignall G. D., Weiss K., Myles D. A. A. (2006) Physica B 385–86, 880–882 [Google Scholar]
- 27. Guinier A., Fournet G. (1955) Small-angle Scattering of X-rays, Wiley, New York [Google Scholar]
- 28. Svergun D. I. (1992) J. Appl. Crystallogr. 25, 495–503 [Google Scholar]
- 29. Kriste R. G., Oberthür R. C. (1982) Small Angle X-ray Scattering (Glatter O., Kratky O. eds) pp. 387–431, Academic Press, New York [Google Scholar]
- 30. Porod V. G. (1951) Kolloid Z. 124, 83–114 [Google Scholar]
- 31. Doniach S. (2001) Chem. Rev. 101, 1763–1778 [DOI] [PubMed] [Google Scholar]
- 32. Heller W. T., Krueger J. K., Trewhella J. (2003) Biochemistry 42, 10579–10588 [DOI] [PubMed] [Google Scholar]
- 33. Bernadó P., Mylonas E., Petoukhov M. V., Blackledge M., Svergun D. I. (2007) J. Am. Chem. Soc. 129, 5656–5664 [DOI] [PubMed] [Google Scholar]
- 34. Vriend G. (1990) J. Mol. Graph. 8, 52–56 [DOI] [PubMed] [Google Scholar]
- 35. Gordon J. C., Myers J. B., Folta T., Shoja V., Heath L. S., Onufriev A. (2005) Nucleic Acids Res. 33, W368–371 [DOI] [PMC free article] [PubMed] [Google Scholar]
- 36. Myers J., Grothaus G., Narayanan S., Onufriev A. (2006) Proteins 63, 928–938 [DOI] [PubMed] [Google Scholar]
- 37. Bernado P. (2010) Eur. Biophys. J. Biophys. Lett. 39, 769–780 [DOI] [PubMed] [Google Scholar]
- 38. Heller W. T. (2005) Acta Crystallogr. D Biol. Crystallogr. 61, 33–44 [DOI] [PubMed] [Google Scholar]
- 39. Zhong L., Matthews J. F., Crowley M. F., Rignall T., Talon C., Cleary J. M., Walker R. C., Chukkapalli G., McCabe C., Nimlos M. R., Brooks C. L., Himmel M. E., Brady J. W. (2008) Cellulose 15, 261–273 [Google Scholar]
- 40. Zhong L., Matthews J. F., Hansen P. I., Crowley M. F., Cleary J. M., Walker R. C., Nimlos M. R., Brooks C. L., 3rd, Adney W. S., Himmel M. E., Brady J. W. (2009) Carbohydr. Res. 344, 1984–1992 [DOI] [PubMed] [Google Scholar]
- 41. Segel D. J., Fink A. L., Hodgson K. O., Doniach S. (1998) Biochemistry 37, 12443–12451 [DOI] [PubMed] [Google Scholar]
- 42. Das A., Chitra R., Choudhury R. R., Ramanadham M. (2004) Pramana J. Phys. 63, 363–368 [Google Scholar]
- 43. Baker G. A., Heller W. T. (2009) Chem. Eng. J. 147, 6–12 [Google Scholar]
- 44. Calmettes P., Durand D., Desmadril M., Minard P., Receveur V., Smith J. C. (1994) Biophys. Chem. 53, 105–113 [DOI] [PubMed] [Google Scholar]
- 45. Shoemaker B. A., Portman J. J., Wolynes P. G. (2000) Proc. Natl. Acad. Sci. U.S.A. 97, 8868–8873 [DOI] [PMC free article] [PubMed] [Google Scholar]


