

Abstract
In these studies, we find that the vascular endothelial growth factor (VEGF) receptor KDR is expressed on subsets of mitogen-activated CD4+ and CD8+ T cells in vitro. We also found that KDR colocalizes with CD3 on mitogen-activated T cells in vitro and on infiltrates within rejecting human allografts in vivo. To evaluate whether VEGF and KDR mediate lymphocyte migration across endothelial cells (ECs), we used an in vitro live-time transmigration model and observed that both anti-VEGF and anti-KDR antibodies inhibit the transmigration of both CD4+ and CD8+ T cells across tumor necrosis factorα (TNFα)–activated, but not unactivated ECs. In addition, we found that interactions among CD4+ or CD8+ T cells and TNFα–activated ECs result in the induction of KDR on each T cell subset, and that KDR-expressing lymphocytes preferentially transmigrate across TNFα–activated ECs. Finally, using a humanized severe combined immunodeficient mouse model of lymphocyte trafficking, we found that KDR-expressing lymphocytes migrate into human skin in vivo, and that migration is reduced in mice treated with a blocking anti-VEGF antibody. These observations demonstrate that induced expression of KDR on subsets of T cells, and locally expressed VEGF, facilitate EC-dependent lymphocyte chemotaxis, and thus, the localization of T cells at sites of inflammation.
Introduction
Vascular endothelial growth factor (VEGF), an angiogenesis factor, is established to function in the migration, proliferation, and survival of endothelial cells (ECs).1,2 VEGF is well known to function in wound healing, organ development, and tumor growth and it serves to promote tissue protection and repair after acute injury.3 VEGF is also expressed in association with cell-mediated immune inflammation and acute and chronic inflammatory reactions.4 In chronic inflammatory disease processes, VEGF fails to elicit effective tissue repair, and rather may induce a pathologic form of angiogenesis that has been proposed to augment disease activity.4,5 Indeed, several studies have demonstrated that blockade of VEGF may attenuate the progression of chronic diseases such as arthritis, atherosclerosis, and allograft rejection.6–8
Although relatively underappreciated, VEGF has potent proinflammatory properties including an ability to mediate leukocyte trafficking into sites of cell-mediated immunity.7–13 The proinflammatory properties of VEGF are reported to be dependent on its ability to interact directly with monocytes resulting in chemotaxis,10 its ability to induce the expression of endothelial adhesion molecules9,11 and chemokine production,8,12,14 and its ability to enhance vascular permeability.2 Furthermore, VEGF has been reported to have direct chemoattractant effects on murine and human T cells,13,15 and blockade of VEGF in vivo has been found to inhibit lymphocyte trafficking into skin and rejecting cardiac allografts.8,16,17 However, the mechanism underlying the ability of VEGF to interact with T cells is not known, and the molecular basis for its ability to facilitate lymphocyte chemotaxis in vitro or in vivo is poorly understood.
Several recent studies have determined that the VEGF receptors Flt-1 (VEGF receptor 1), KDR (VEGF receptor 2) and neuropilin-1 may be expressed on subsets of T cells.13,15,18–21 Murine effector T cells express both Flt-1 and KDR,13 and murine populations of CD4+CD25+FoxP3+ T regulatory cells selectively express neuropilin-1.20,22,23 Human T-cell lines express all VEGF receptors,15,18,19 and purified subsets of human T cells including CD4+CD45RO+ cells express both Flt-1 and KDR.15 In addition, KDR,24,25 like neuropilin-1,20,26 has been found to be expressed by human FoxP3+CD4+ T regulatory cells. Neuropilin-1 has also been reported to be expressed on populations of human naive T cells, where it functions in the initiation of T-cell activation, and in primary immune responses.27 Classically, neuropilin-1 serves as an accessory coreceptor to bind VEGF and mediate crosslinking to KDR.28,29 However, VEGF has never been implicated as a ligand for T cells, or to function in T cell–antigen-presenting cell interactions.
Nevertheless, VEGF has been reported to be associated with T helper type 1,30,31 T helper type 2,13,32, and T helper type 1733 responses in vitro and in vivo, and VEGF-KDR interactions may qualitatively and quantitatively regulate memory CD4+ T cell reactivation, including the costimulation of interferon-γ production.15,31,33 Also, although VEGF receptors have been reported to be expressed by T regulatory cells,20,24–26 the function of VEGF–VEGF receptor interactions on immunoregulatory cell activity is currently unknown. Collectively, these studies indicate that VEGF may have direct effects on different subsets of T effector and T regulatory cells via interactions with its receptors. Furthermore, because KDR is a dominant receptor on both subsets of T cells, it is possible that VEGF-inducible signaling via KDR may be most important in human immunologic responses.
In this study, we find that KDR is induced in expression on activated CD4+ and CD8+ T cells in vitro, and furthermore, we find that it is expressed on T-cell infiltrates within human allografts in vivo. In addition, we demonstrate that KDR is induced in expression on T cells after interactions with tumor necrosis factor α (TNFα)–activated ECs, and that VEGF and KDR function in transendothelial migration. Together, these observations identify T cell KDR as an important molecule in immunity, and suggest that VEGF–KDR interactions facilitate transendothelial migration of lymphocytes and their localization at sites of inflammation.
Methods
Reagents
Description of antibodies and reagents used in these studies is in supplemental Methods (available on the Blood Web site; see the Supplemental Materials link at the top of the online article).
Human subjects
Human peripheral blood mononuclear cells (PBMCs) was obtained from healthy volunteers. Informed consent was obtained in accordance with the guidelines of the Committee on Clinical Investigation at Children's Hospital Boston. The protocol for the collection of neonatal foreskin and the protocol for the use of cardiac transplant biopsy tissue in our research studies were approved by the Human Research Committee at the Brigham and Women's Hospital, Boston, MA. Endomyocardial biopsy samples were collected from cardiac transplant recipients as part of routine posttransplantation care. Diagnostic specimens were processed for clinicopathologic analysis according to standard care and specimens were used for research when clinical diagnosis was complete. Renal biopsy specimens were obtained for clinical indications from renal transplant recipients at Children's Hospital Boston. Research studies were also performed after clinicopathologic diagnoses and clinical care was completed. Both cardiac and renal biopsy specimens were obtained more than 5 years ago and were stored at −80°C until use in this study.
EC culture
Human umbilical vein endothelial cells (HUVECs) were isolated and cultured as previously described.34 Briefly, HUVECs were serially passaged at 37°C in 5% CO2 in M199 medium (BioWhittaker) supplemented with 20% heat-inactivated fetal calf serum (FCS; GibcoBRL Products), 50 μg/mL EC growth supplement (ECGS; Biomedical Technologies), and 100 μg/mL heparin (Sigma-Aldrich), 2 mM l-glutamine, 100 IU/mL penicillin and 100 μg/mL streptomycin (Invitrogen). Confluent HUVECs were harvested using .025% trypsin/ .01% EDTA (Sigma-Aldrich).
Transfection
A validated KDR siRNA (Sense-r (CGC UGA CAU GUA CGG UCU A) dTdT Antisense-r (UAG ACC GUA CAU GUC AGC G) dTdT) and control (AllStars negative control siRNA, #1027280) were purchased from QIAGEN, and were transfected (25 nM) into HUVECs using Hiperfect Transfection Reagent (QIAGEN), according to the manufacturer's instructions. The efficiency of siRNA for knockdown was assessed by Western blot analysis.
Leukocyte isolation and coculture experiments
CD4+ and CD8+ T cells were isolated from PBMCs by positive selection using magnetic beads (CD4 and CD8 Kits; Dynal Inc) according to the manufacturer's instructions. Purified cells were cultured overnight in RPMI 1640 medium supplemented with 10% FCS (Sigma-Aldrich) and penicillin (100 U/mL), streptomycin (100 mcg/mL), l-glutamine (2mM) at 37° in 5% C02. For some experiments, CD4+T cells and CD8+ T cells were stimulated with plate bound anti-CD3 (0.5-1 μg/mL) and soluble anti-CD28 (0.5-1 μg/mL) for 3 days prior to their use in transmigration assays. Also, for some experiments, untreated or TNFα–treated HUVECs (100 U/mL for 6 hours) were harvested and cocultured with CD4+ or CD8+ T cells (1 × 10⁵ cells, ratio of 1:1 in round bottom 96-well plates).
Lymphocyte migration assays
Briefly, 3μM pore membrane Falcon FluoroBlok transwell inserts (Becton Dickinson) were coated with .01% gelatin and subsequently with 3 μg/well of human fibronectin (Sigma-Aldrich), similar to that described.35 Subsequently, 3 × 10⁴ HUVECs (subculture 2-3) were seeded onto the membranes. After 5 to 6 days of culture, and prior to each experiment, the integrity of confluent EC monolayer was assessed by microscopy and by Coomassie stain. In addition, the confluency of the EC monolayer was assessed occasionally using the FITC-labeled dextran permeability assay, as described.35 siRNA-transfected ECs were plated onto Falcon FluoroBlok transwells (Becton Dickinson) approximately 24 hours after transfection, and were cultured for an additional 18 hours before transmigration assays.
For transmigration assays, confluent EC monolayers were used untreated or after treatment with TNFα (100U/mL) for 6 hours and were washed prior to transmigration assays. CFSE-labeled (2.5uM) CD4+ or CD8+ T cells (5 × 10⁵ cells) were added into the upper chamber of the transwell in the absence or presence of blocking antibodies (anti-VEGF [1 μg/mL], anti-KDR [2 μg/mL]) or control IgG antibodies, as indicated. Antibodies were added to the transwell prior to addition of the lymphocytes. In some experiments, mitogen-activated CD4+ or CD8+ T cells were used untreated or after preincubation with anti-KDR (2 μg/mL) or mouse IgG for 3h at 37°C. After pretreatment, T cells were washed in culture medium prior to use in the assay.
Lymphocyte migration was monitored by the assessment of increasing fluorescence in the lower chamber of the transwell using an automated plate reader (Victor, Perkin Elmer, Wallac Inc). Automated fluorometric readings were assessed real time every 15 minutes so that increases in fluorescence intensity were reflective of increases in transendothelial migration. The number of cells transmigrating into the lower chamber was calculated using a standard curve generated by assessing the relative fluorescence intensity of increasing numbers of cells in control wells.
Chemotaxis assays were also performed across type 1 collagen coated 5μM pore polycarbonate filters using the standard Boyden Chamber, according to the manufacturer's instructions (Neuro Probe) as previously described15 (supplemental Methods).
FACS analysis
Fluorescence-activated cell sorting (FACS) was performed using standard techniques14 with FITC-, PE-, APC-, and Fluorescein-conjugated mAbs, or appropriate isotype control antibodies. After incubation with antibodies at 4°C for 30 minutes, the cells were washed and fixed in 1% paraformaldehyde and were analyzed using a FACSCalibur flow cytometer (Becton Dickinson), and CellQuest (Version 5.2.1) and FlowJo (Version 9.0.1) software.
Western blot analysis
Cultured cells were washed in PBS, were lysed with ice-cold RIPA buffer (Boston Bioproducts) and were separated on a SDS–polyacrylamide gel, and transferred onto a polyvinylidene difluoride membrane (Millipore Corporation). Using standard methodology as described,36 membrances were blocked with 5% milk in TBS–Tween 20 for 1 hour and incubated overnight with the primary antibody. Membranes were washed and incubated with a secondary peroxidase-linked antibody and the reactive bands were detected by chemiluminescence (Pierce).
Real-time PCR
Total RNA was prepared using the RNeasy isolation kit (QIAGEN). cDNA synthesis and polymerase chain reaction (PCR) were performed using the SuperScript One-Step RT-PCR kit (Invitrogen) and cDNA was synthesized using cloned AMV first-strand synthesis kit (Invitrogen). Quantitative real-time PCR was performed using the 7300 real-time PCR system and the Assays-on-Demand Gene Expression Product (TaqMan, MGC probes; Applied Biosystems). Gene-specific primers for the analysis of human KDR and GAPDH by real-time PCR were obtained from Applied Biosystems. Ct values for the evaluation of KDR expression were calculated. Change(s) in the mRNA expression of KDR after T-cell activation was evaluated as fold change relative to untreated cells as follows: fold change = 2x (where X = Ct value for the control group − Ct value for each experimental group).
In vivo humanized SCID mouse model of lymphocyte trafficking
Human neonatal foreskin grafts were transplanted onto severe combined immunodeficient (SCID) mice as described8,37,38 and were allowed to heal for 6 weeks. Prior to humanization, the mice were treated with 100 μl of anti-asialo GM1 antibody (Wako Chemicals) by intraperitoneal injection to neutralize host natural killer cells. After approximately 24 hours, 3 × 10⁸ human PBMCs were injected intraperitoneally as described.37,38 The mice were untreated or were treated with humanized anti–human VEGF (5mg/kg every other day by intraperitoneal injection; Genentech). After 14 days, the skin grafts were harvested from the mice and divided into 2. One portion was frozen in OCT for cryosectioning, immunostaining, and analysis of cellular infiltrates. The other portion was fixed in formalin, embedded in paraffin, and processed for H&E staining. All studies were performed in accordance with protocol approval by the Animal Care and Use Committee, Children's Hospital Boston.
Immunostaining/immunofluorescence microscopy
Four micron cryostat sections were fixed in acetone, and were blocked in 5% goat serum and/or endogenous peroxidase activity was quenched with hydrogen peroxide in phosphate buffered saline (PBS). Subsequently the sections were incubated with the primary antibodies anti-KDR (55B11) and anti-CD3 (UCHT1) in increasing dilutions in 5% goat serum in PBS overnight at 4°C. After 3 washes in PBS, sections were incubated with a secondary biotinylated antibody or with Alexa Fluor 488 and Alexa Fluor 594 secondary antibodies (Molecular Probes), diluted according to the manufacturers recommendations. After washing, immunohistochemical staining was performed using the Vectastain ABC avidin biotin-peroxidase enzyme complex kit (Vector Laboratories); and immunofluorescence stained sections were mounted with ProLong Gold antifade reagent with DAPI (Molecular Probes). Immunofluorescence microscopy was performed using a Nikon eclipse 80i microscope (MVI Instruments). Confocal laser scanning microscopy was carried out with a LSM 510 META NLO microscope (Carl Zeiss MicroImaging Inc) and each image was collected, processed and analyzed using LSM Image Brower (Version 4.2) software.
For single cell staining, T cells or ECs were harvested, and 2 × 10⁵ cells were cytospun at 500 rpm for 7 minutes onto noncoated Shandon slides and mounted for confocal micrscopy. The cells were fixed in 3%, formaldehyde, washed 3 times in PBS, and blocked in 5% goat serum/.3% Triton X for 1 hour, prior to incubation with the primary antibodies anti-KDR (55B11; Cell Signaling) and anti-CD3 (UCHT1; BD Pharmingen) or anti-CD31 (BD Pharmingen). After washing, the cells were incubated with goat anti–mouse Alexa Fluor 488 and goat anti–rabbit Alexa Fluor 594 secondary antibodies, diluted in 5% goat serum in PBS. The slides were washed 4 times in PBS and mounted over ProLong Gold antifade reagent with DAPI (Molecular Probes). Confocal microscopy was performed using the LSM 510 META NLO microscope and LSM Image Brower (Version 4.2) software (Zeiss) using standard techniques.
Statistical analysis
Statistical analysis was performed using the Mann Whitney U test.
Results
Expression of VEGF receptor-2 (KDR) on human T cells in vitro and in vivo
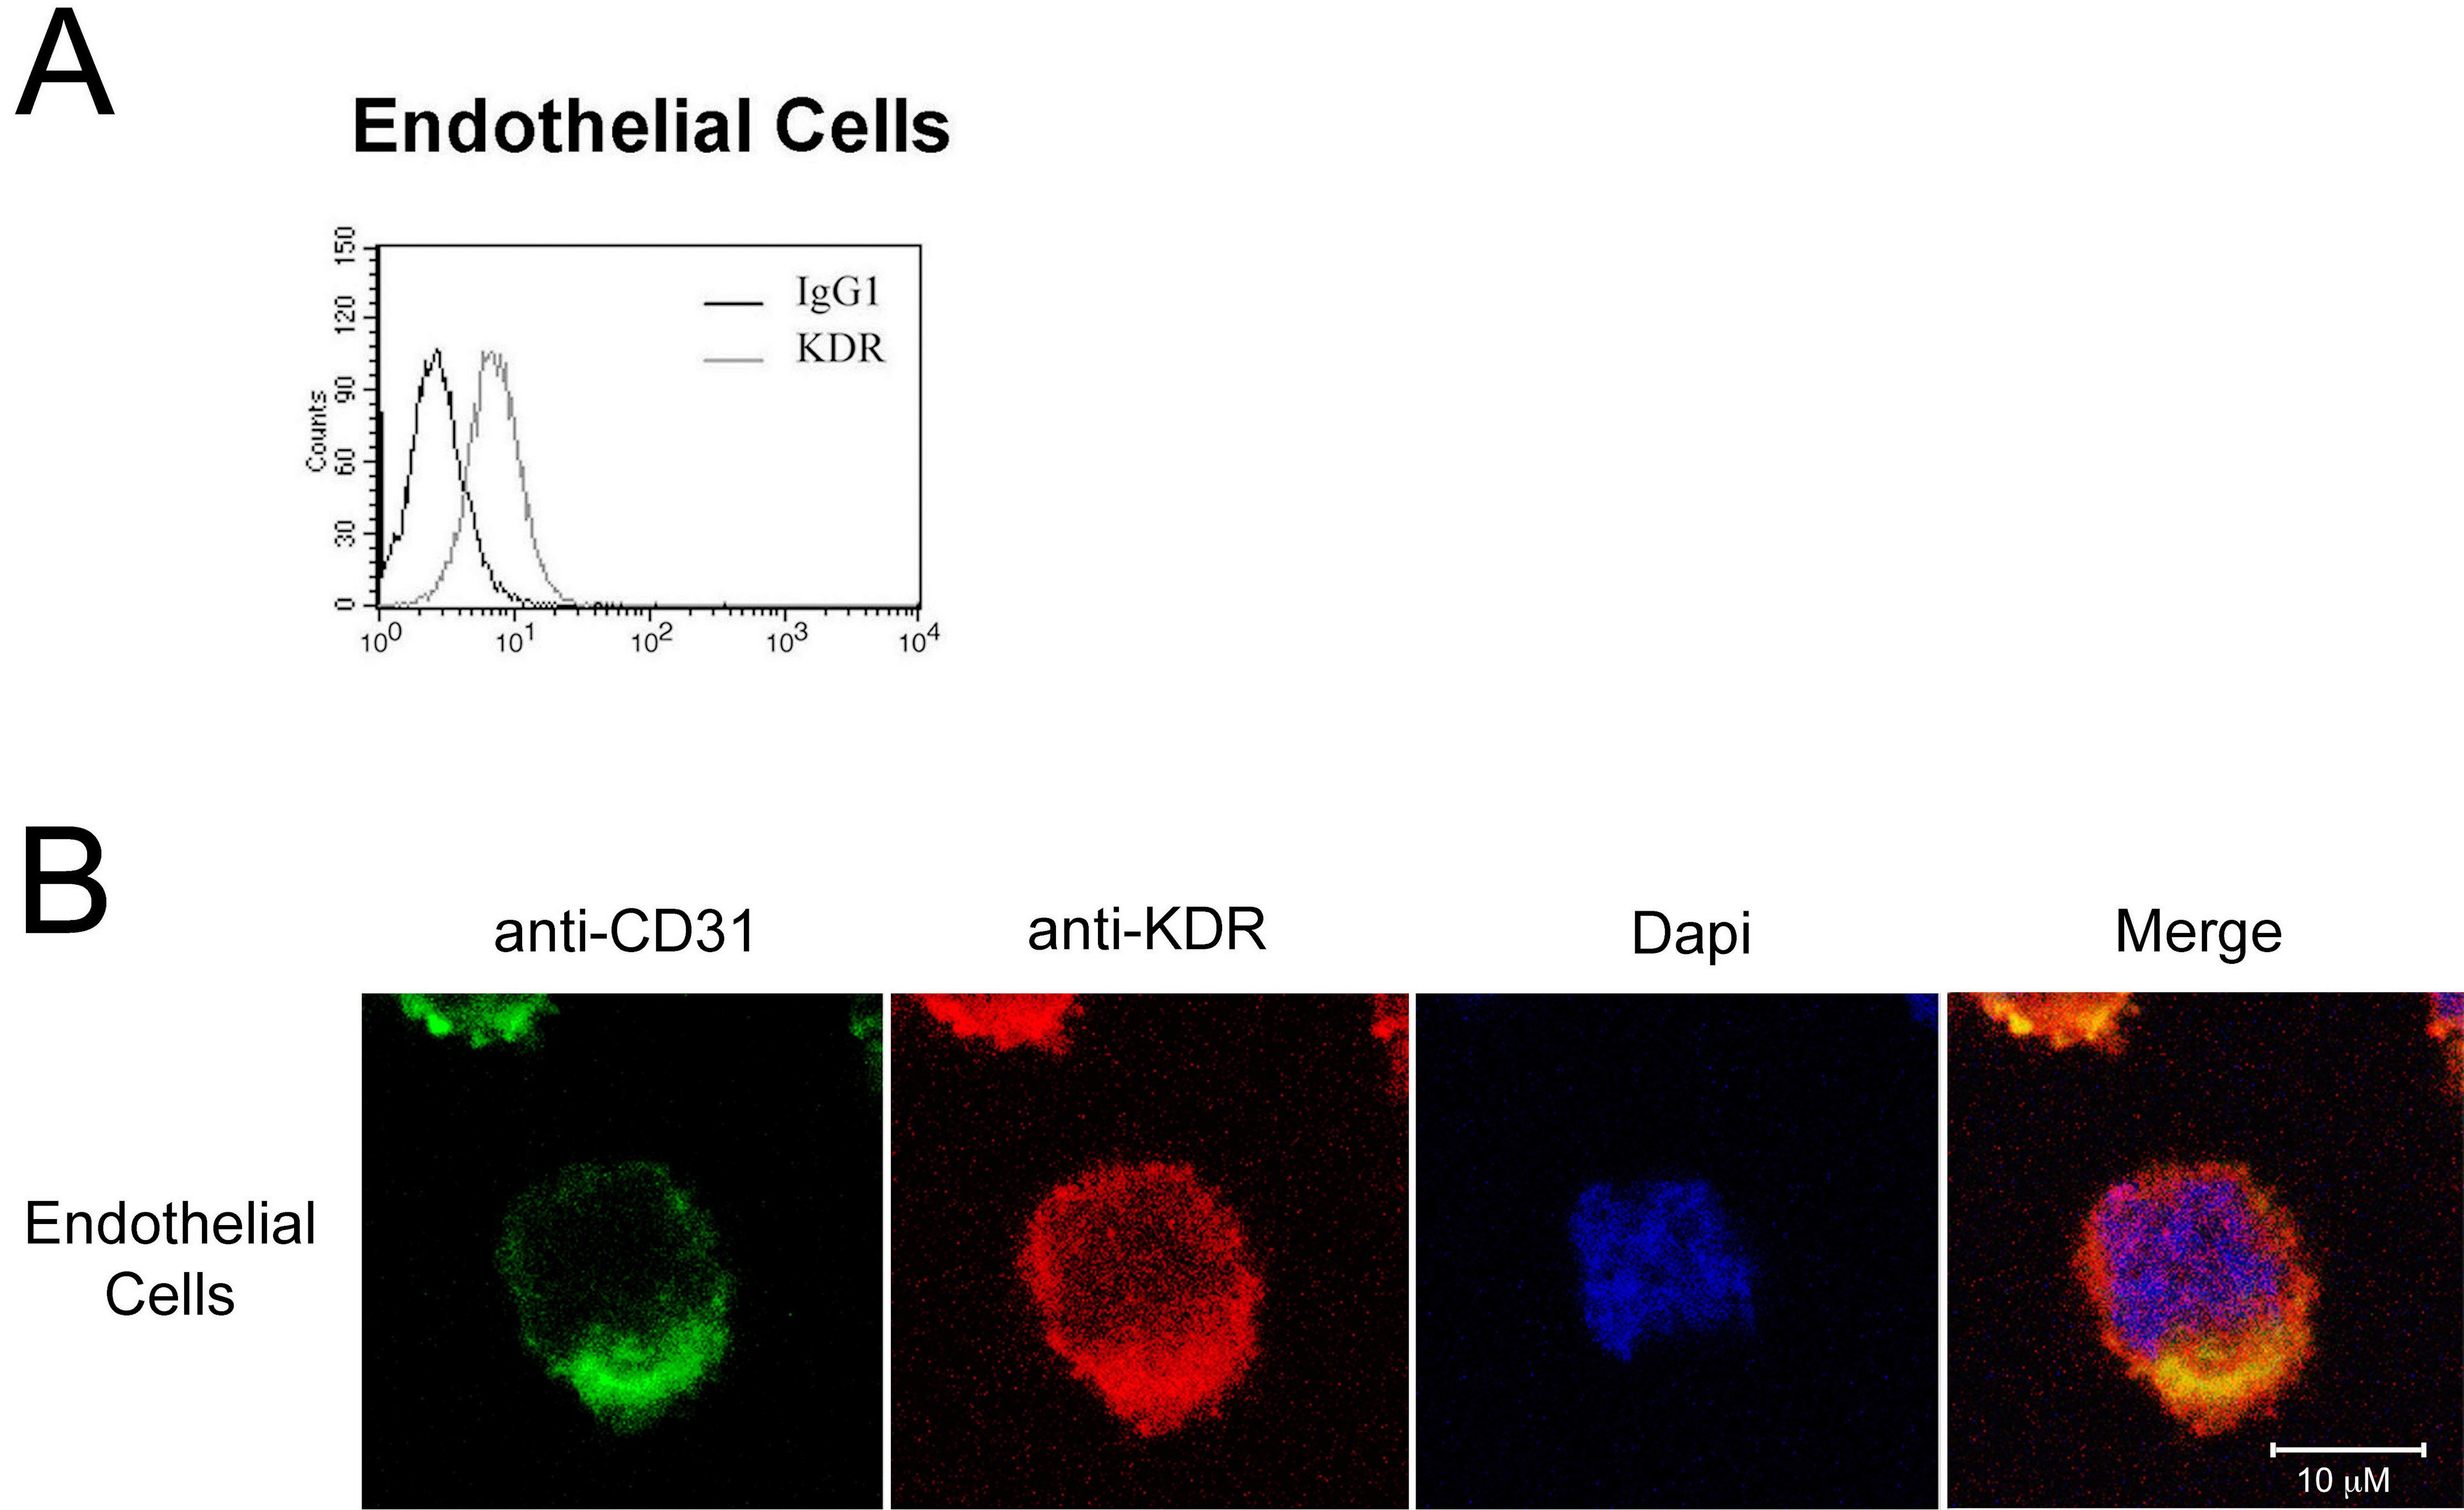
We initially isolated pooled populations of CD4+ and CD8+ T cells from PBMCs by positive selection, and we evaluated the expression of KDR at the protein level by FACS, Western blot analysis and confocal microscopy, and at the mRNA level by PCR. As illustrated in Figure 1A through C, we find that KDR is not detectable, or is minimal, on unactivated T cells. In contrast, after activation with anti-CD3/anti-CD28, expression on both CD4+ and CD8+ T cells was induced at the mRNA and protein levels. By quantitative real time PCR, we find an 8-20 fold increase in KDR mRNA expression in both CD4+ and CD8+ populations after mitogen-dependent activation (Figure 1B). And, by confocal microscopy (Figure 1D), we find that KDR colocalizes with CD3 on mitogen-activated T cells, and its expression appears to be concentrated within focal areas of the cell surface membrane. In contrast in ECs, KDR is diffusely expressed on the cell membrane, where the overall intensity of expression is high (supplemental Figure 1). These initial observations clearly indicate that KDR may be expressed on purified populations/subsets of activated CD4+ and CD8+ T cells.
Figure 1.

Expression of KDR on mitogen-activated CD4+ and CD8+ T cells. CD4+ and CD8+ T cells were purified from human blood by positive selection, and were stimulated with anti-CD3/anti-CD28 (as outlined in “Leukocyte isolation”) for 72 hours or as indicated. The expression of KDR was evaluated by FACS (A), by real-time PCR (B), by Western blot analysis (C), and by confocal microscopy (D). In panel A, the difference (delta, Δ) in mean fluorescence staining (experimental minus isotype control) is shown within each FACS plot. In panel B, the relative fold induction in KDR mRNA expression in 6- and 12-hour mitogen-activated CD4+ and CD8+ T cells versus untreated cells (NT) is shown. Panel C illustrates a representative Western blot of KDR in unactivated (lane 1) and 12-hour mitogen-activated T cells (lane 2). Panel D shows representative confocal microscopy images of 72-hour anti-CD3/anti-CD28-activated CD4+ T cells stained for CD3 and KDR. Approximaetly 20% of all activated T cells in our cultures express KDR (as illustrated) and the remainder of the T cells in the cultures have nondetectable or low levels of expression (not shown). All experiments are representative of n ≥ 5 per condition (A-B) and n = 3 (C).
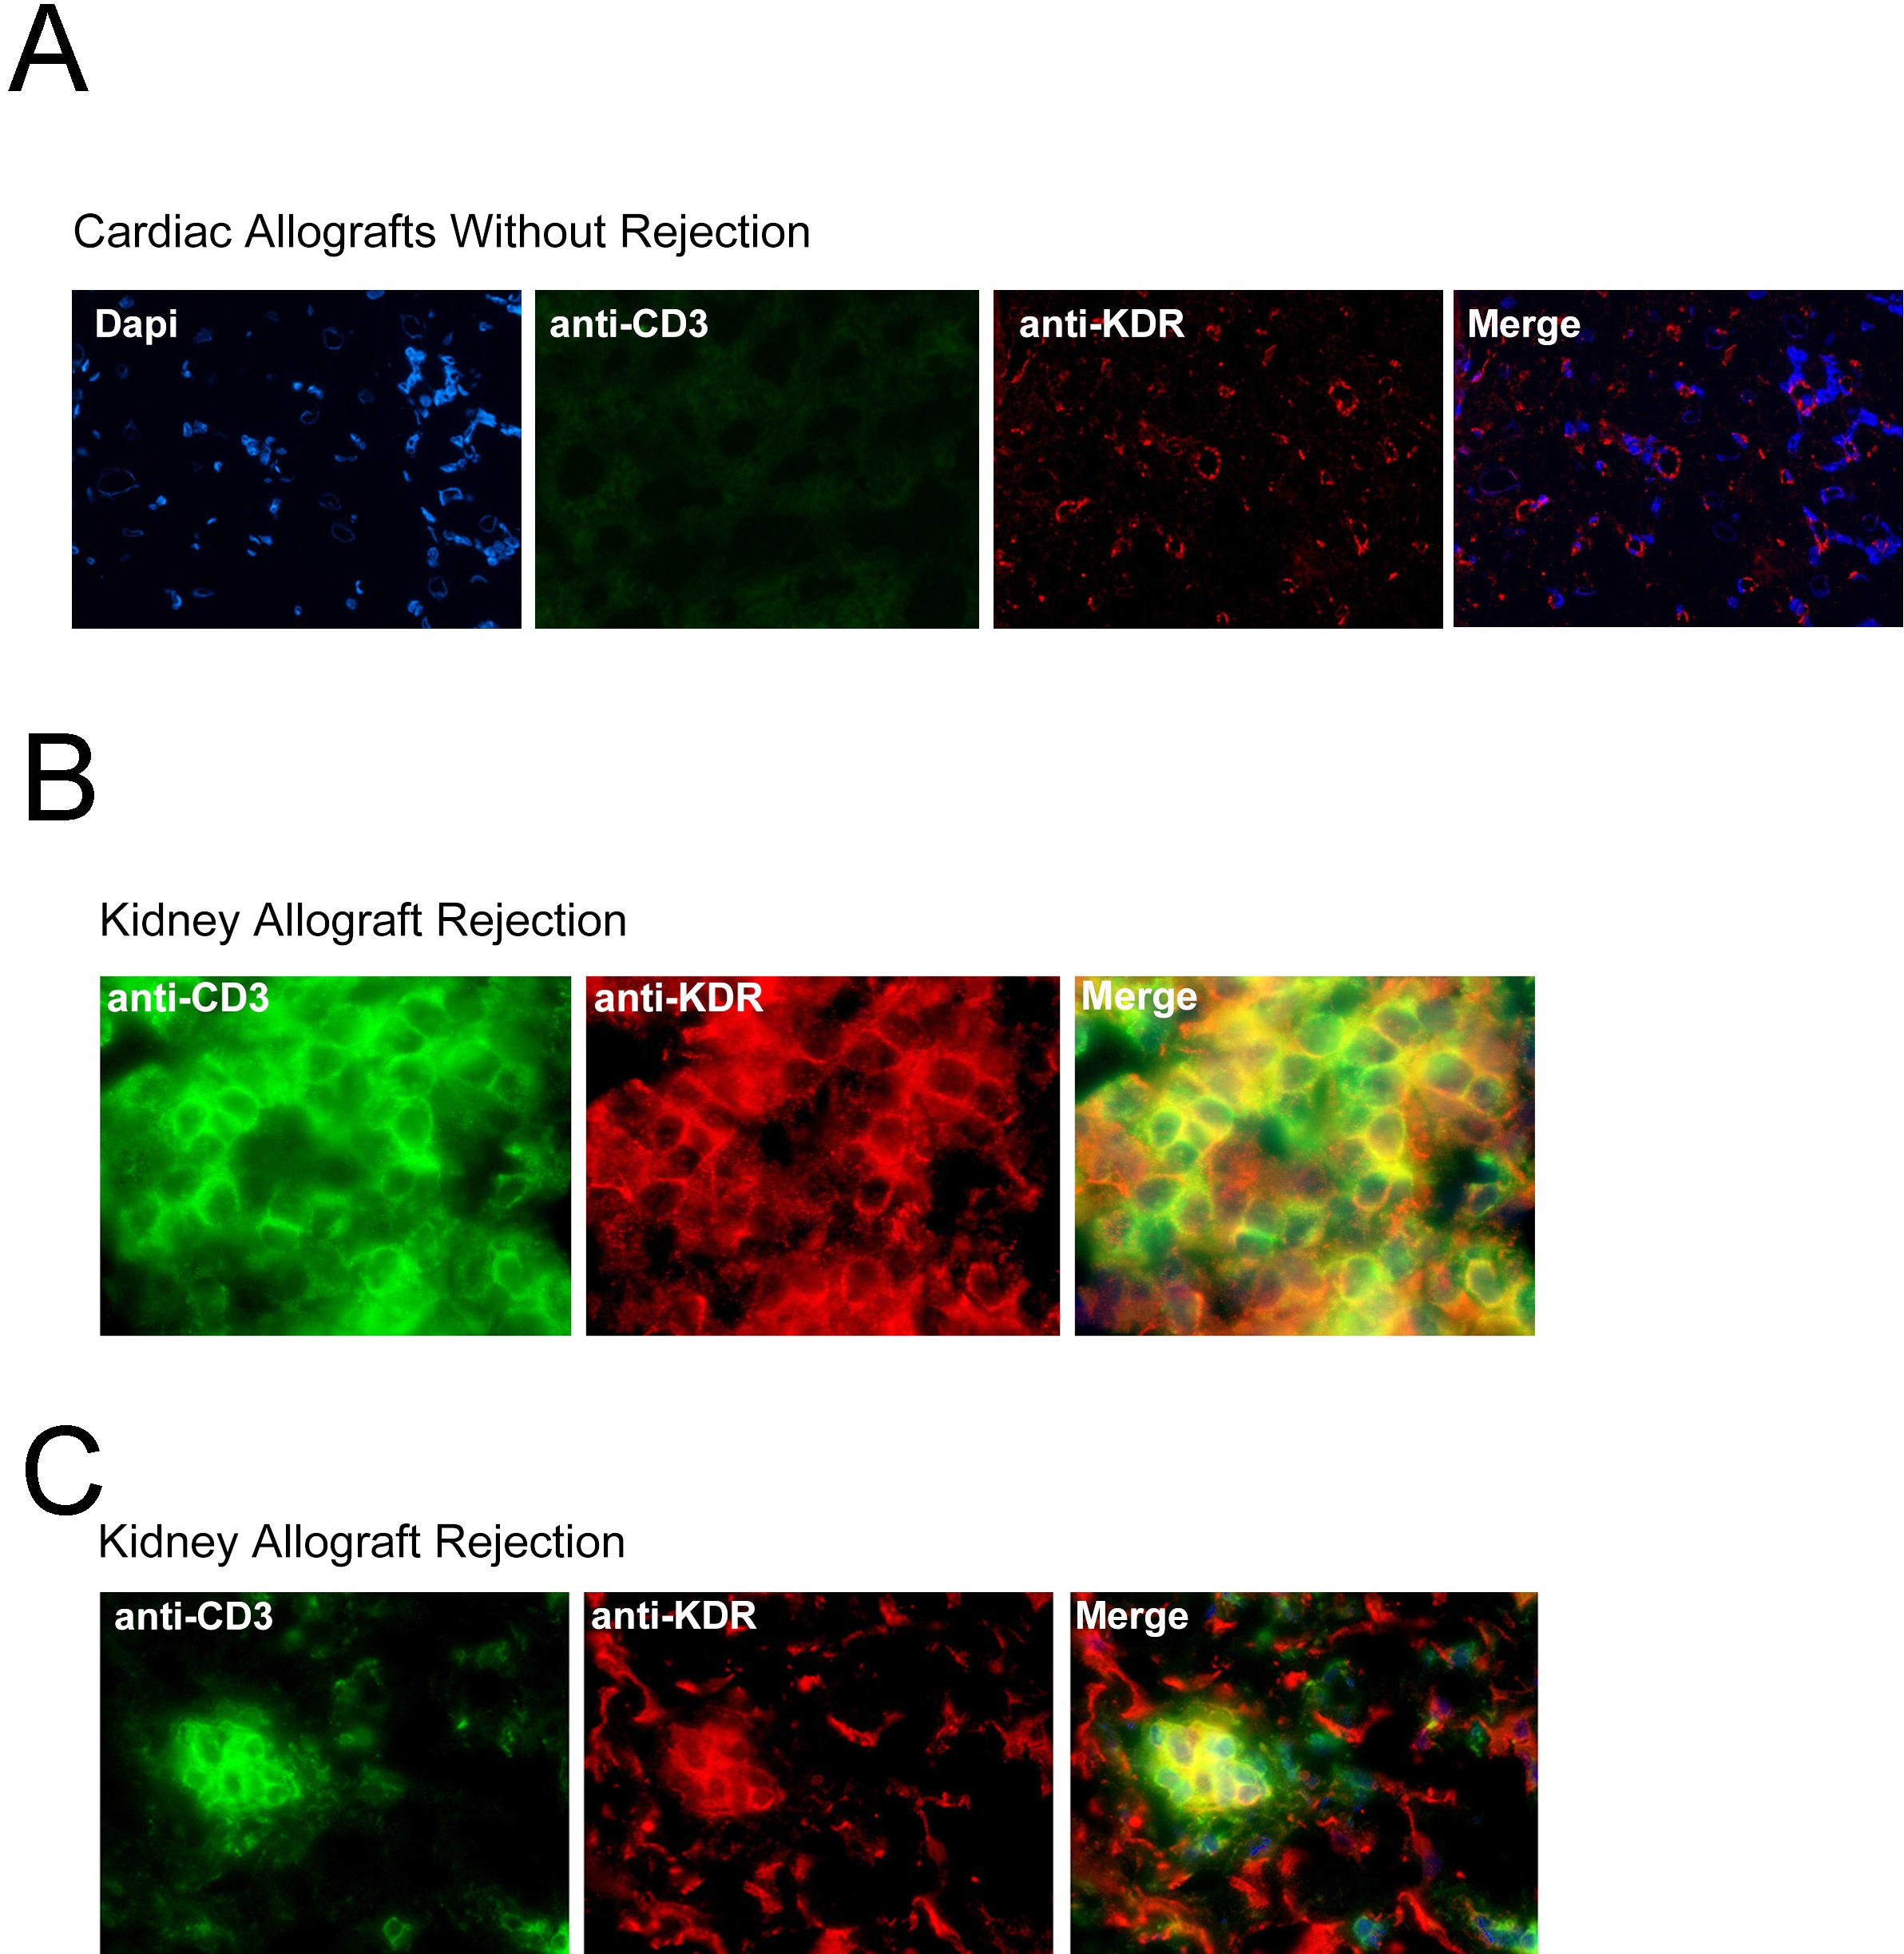
To next determine whether this observation is of pathophysiologic significance, we analyzed KDR expression within human allografts undergoing rejection and questioned whether it colocalizes with CD3 on infiltrating T cells. A total of 19 endomyocardial biopsies, previously collected from 10 cardiac transplant recipients, were used for this analysis. We found that the mean number of CD3+ T-cell infiltrates in these biopsy samples ranged from 4 to 79 cells per high power field (400× magnification). By immunofluorescence staining, as expected, KDR was expressed on ECs diffusely throughout all biopsy samples including those without CD3+ infiltrates or rejection (supplemental Figure 2A), as well as those with infiltrates and evidence of rejection (Figure 2A). Furthermore, KDR colocalized with CD3 on monocuclear cells within all infiltrated biopsy specimens (Figure 2A middle and bottom panels, B). We also examined 5 kidney allograft biopsies and similarly observed coexpression of KDR on CD3+ T-cell infiltrates (supplemental Figure 2B-C). By grid counting, we found KDR expression on a mean (± 1 SEM) of 29% (± 3.3%) of all CD3-stained cells/cardiac biopsy and 30% (± 2.6%) of CD3-stained cells/renal biopsy (Figure 2C). Of note, in both kidney and heart allografts, consistently, KDR was present at high levels on ECs throughout all grafts. In contrast, we observed that the expression of KDR on T cells was not identical within each biopsy. KDR was expressed at high levels on T-cell infiltrates in some biopsy samples, regardless of whether the infiltrates were focal or diffuse (supplemental Figure 2). However, occasional biopsies with diffuse infiltrates had low levels of coexpression. Nevertheless, in all biopsy sample specimens examined, we found that KDR was expressed on isolated subsets of T cells under pathophysiologic conditions. We interpret these observations to suggest that there may be circumstances or mechanisms that facilitate/augment expression at the local inflammatory site.
Figure 2.

Expression of KDR on T cells within human cardiac and renal allografts. (A) Representative photomicrographs illustrating the expression of KDR within human cardiac allografts. Top panels: immunohistochemical staining of KDR (rose brown color) in 3 human cardiac allografts with few (left top panel), moderate (middle top panel), and diffuse (right top panel) infiltrates. Middle and bottom panels: Immunofluorescence staining of CD3 and KDR in a representative cardiac allograft at ×400 magnification (middle) and 800× magnification (bottom). Merged images illustrate coexpression of CD3 and KDR (yellow color, arrows). (B) Confocal microscopy of a representative cardiac allograft with evidence of rejection illustrating coexpression of CD3 with KDR. (C) Scatter graphs showing the percentage of CD3+ stained T cells that coexpress KDR in cardiac and renal biopsies (black dots represent individual biopsies). The line shows the mean percent expression in all biopsies examined.
Function of VEGF in the transendothelial migration of T cells
Our observations suggest that local overexpression of VEGF, for instance, within allografts,39–41 may mediate biologic responses within VEGF receptor-expressing T cells. Indeed, VEGF-inducible responses in lymphocytes have been previously suggested to result in recruitment in vivo.8 To evaluate the effect of VEGF on chemotaxis responses in T cells, we developed a real-time migation model in which T cells transmigrate across ECs in transwells. Briefly, ECs were cultured to confluency on 3μM pore FluoroBlok transmembranes in the upper chamber of transwells. CFSE-labeled T cells were subsequently placed in the upper chamber in the absence or presence of a blocking anti-VEGF antibody, and migration was assessed every 15 minutes using an automated assay, as previously described.15 As illustrated in Figure 3, we consistently found 2 patterns of transmigration, an early phase, characterized by a rapid rate of transmigration, and a later phase, when the rate of transmigration slowed and stabilized. Furthermore, we found that the addition of our blocking anti-VEGF antibody (1-10μg/mL) into cocultures failed to have a significant effect on T-cell transmigration across unactivated ECs (Figure 3A-B).
Figure 3.

Effect of anti-VEGF on the transmigration of human CD4+ and CD8+ T cells across ECs. Endothelial cells (ECs) were cultured to confluency on FluoroBlok 3μM pore membranes in the upper chambers of transwells. Subsequently, CFSE-labeled T cells (5 × 10⁵ cells) were added into the upper chamber, and migration into the lower chamber was monitored real-time by the assessment of increasing fluorescence. The number of transmigrated cells in each lower chamber was determined using a standard curve, and the percentage of transmigrated cells at each time point was calculated. Transmigration assays were performed in the presence of control IgG (black dots) or anti–human VEGF (Genentech; 1μg/mL, open squares). (A-B) Representative experiment illustrating transmigration across unactivated ECs. No difference between anti-VEGF versus control IgG treatment is evident. (C-D) Representative experiment illustrating transmigration across 6-hour TNFα–activated ECs. (E-F) The mean percentage inhibition of transmigration by anti-VEGF across unactivated (□) or TNFα–activated ECs (■, n = 5 per experimental group). Anti-VEGF significantly inhibits transmigration across activated ECs at times > 2 hours. *P < .01 vs control IgG.
We next treated confluent cultures of ECs with TNFα for 6 hours prior to the transmigration assay. This treatment resulted in an increase in the early rate of transmigration, as well as the total number of T cells that transmigrated into the lower chamber, compared with untreated ECs (Figure 3C-D). Moreover, as illustrated in Figure 3C through F, we found that anti-VEGF (1 μg/mL) significantly inhibited both CD4+ and CD8+ T-cell transmigration across TNFα–activated ECs (P < .01) at times > 2 hours. At earlier times (0-2 hours) blockade with anti-VEGF failed to inhibit transmigration. Collectively, these in vitro observations suggest that interactions among T cells and activated ECs (over a period of 0-2 hours) results in the induction of molecule(s) that facilitate responsiveness to VEGF.
Blockade of KDR inhibits the transmigration of T cells across activated ECs in vitro
Next, we assessed the function of KDR in the transendothelial migration of T cells. Using FluoroBlok transwells, we found that saturating concentrations of a blocking anti-KDR antibody (R&D Systems) failed to inhibit CD4+ or CD8+ T-cell migration across untreated ECs (Figure 4A white bars). However, similar to our observations using anti-VEGF, we found that anti-KDR (2μg/mL) significantly inhibited T cell migration across cocultures of TNFα–activated ECs (P < .01, Figure 4A black bars, B).
Figure 4.

Effect of anti-KDR on the transendothelial migration of human CD4+ and CD8+ T cells. ECs were cultured to confluency on 3μM pore membranes in FluoroBlok transwells. CFSE-labeled CD4+ or CD8+ cells (5 × 10⁵ cells) were added into the upper chamber, and migration into the lower chamber was monitored in real time as described in “Lymphocyte migration assays.” Panel A illustrates the mean percent inhibition of transmigration of CD4+ or CD8+ cells (as indicated) by anti-KDR (R&D Systems) versus control IgG across unactivated (□) or TNFα–activated ECs (■, n = 5 experiments; *P < .01 vs contol IgG). Panel B illustrates a representative experiment showing patterns of inhibition of CD4+ or CD8+ T-cell transmigration by anti-KDR across TNFα-activated ECs (control IgG, solid dots; anti–human KDR, open squares). (C) Western blot analysis of control siRNA and KDR siRNA transfected ECs. Top and middle blots illustrate different exposure times of the same blot. (D) Representative experiments illustrating transmigration of CD4+ T cells across nontransfected, control siRNA-transfected ECs, and KDR siRNA-transfected endothelial cells. (E-F) Representative experiments illustrating the transmigration of CD4+ T cells across control siRNA-transfected ECs (E) or KDR siRNA-transfected ECs (F) in the absence (solid dots) or presence (open squares) of anti-KDR (2μg/mL). Panels G and H illustrate the mean percent inhibition (n = 3 experiments) of transmigration of CD4+ T cells (G) and CD8+ T cells (H) across control siRNA-transfected ECs compared with: nontransfected ECs (■) or KDR siRNA-transfected ECs (▩) in the absence or presence of anti-KDR as indicated. Also shown is the inhibitory effect of anti-KDR on T-cell transmigration across control siRNA-transfected ECs (□, as in panel E) or KDR siRNA-transfected ECs (⊞, as in panel F). *P < .01 vs contol IgG.
We next used a siRNA approach to determine the cell specific function of KDR in VEGF-dependent migration. Because knockdown with siRNA is inefficient in purified populations of human T cells, but is very efficient in ECs (Figure 4C), we evaluated transmigration across KDR siRNA-transfected ECs. Confluent control and KDR siRNA transfected ECs were treated with TNFα for 6 hours, and after washing, CD4+ or CD8+ T cells were placed into the upper chamber. We found no difference in the pattern of T-cell transmigration across control siRNA-transfected ECs versus nontransfected ECs (Figure 4D). However, the transmigration of both CD4+ and CD8+ T cells across TNFα–activated KDR siRNA transfected ECs was reduced compared with control siRNA-transfected ECs (Figure 4D). This observation indicates that KDR-induced response(s) in ECs alone function in transendothelial migration, as we previously reported.14 However, notably, anti-KDR (2μg/mL) further increased the inhibition of T-cell transmigration across KDR siRNA transfected ECs (Figure 4F-H). This observation suggests that KDR expression on T cells is also functional in the migratory response.
To characterize the functional effect of VEGF on KDR-induced chemotaxis of T cells, we next preincubated mitogen-activated CD4+ or CD8+ T cells with anti-KDR (or control IgG) prior to placement in the upper chamber of transwells. As illustrated in Figure 5A, we found that mitogen-activated T cells had an increased rate of transmigration, but preincubation with anti-KDR resulted in a weak but significant (P < .05) inhibition of transmigration across both untreated as well as TNFα activated ECs (inhibition ∼ 9% in n ≥ 5 experiments). Furthermore, and consistent with our findings in Figure 4, we observed that the addition of anti-KDR into cultures for the entire period of the assay resulted in a greater and more persistent inhibition of transendothelial migration (Figure 5B). These observations further support the possibility that T-cell expression of KDR is functional in the migratory response.
Figure 5.

Effect of anti-KDR on the transendothelial migration of mitogen-activated human CD4+ and CD8+ T cells. ECs were cultured to confluency on FluoroBlok 3μM pore transwells. Subsequently, 72-hour mitogen-activated (anti-CD3/CD28) CD4+ or CD8+ T cells were CFSE labeled and added into the upper chamber of transwells, and migration into the lower chamber was monitored in real time. (A) Mitogen-activated T cells were pretreated with control IgG or anti-KDR for 3 hours and were washed in culture medium prior to the migration assay. Representative experiments showing transmigration patterns across untreated or TNFα–activated ECs are illustrated. The bar graphs represent mean percent inhibition of transmigration by anti-KDR pretreatment across unactivated ECs (□) or TNFα-activated ECs (■) in 5 experiments at each time point. **P < .05 comparing anti-KDR pretreated cells versus cells pretreated with control IgG. (B) Transmigration of mitogen-activated CD4+ or CD8+ T cells across unactivated ECs or TNFα-activated ECs in the presence of control IgG (solid dots) or anti-KDR (open squares) for the entire period of the assay. The bar graphs illustrate mean percent inhibition of transmigration by anti-KDR across unactivated ECs (□) or TNFα–activated ECs (■) in n = 5 experiments. *P < .01 comparing the effect of anti-KDR versus control IgG. (C) Unactivated (▨) or 72-hour mitogen-activated CD4+ T cells (■) were placed in the upper chamber of a microchemotaxis Boyden chamber, and migration into the lower chamber was assessed after 4 hours, as described in “Lymphocyte migration assays.” The chemotaxis response to VEGF or IP-10 (as a positive control) is illustrated. As indicated, the T cells were pretreated with SU5416, a pharmacologic KDR signaling inhibitor, prior to and during the chemotaxis assay. The illustrated experiment is representative of at least 3 performed in triplicate wells. P values were calculated using the Student t test (*P < .01).
Finally, we also performed Boyden chamber assays (in the absence of ECs) to evaluate the effect of VEGF on KDR-dependent chemotaxis of T cells. We found that VEGF elicited a marked chemotaxis response in both untreated as well as in mitogen-activated T cells (Figure 5C). Further, we observed that this response was similar to IP-10, a well established T-cell chemoattractant which was used as a positive control. This observation alone is highly suggestive that VEGFRs expressed on T cells function in migration. Next, we treated unactivated or mitogen-activated CD4+ T cells with a pharmacologic KDR signaling inhibitor (SU5416, 1 and 5 μM) prior to and during the assay. As illustrated in Figure 5C, we found that SU5416 resulted in a significant inhibition of the VEGF-induced chemotaxis response. However, SU5416 failed to inhibit the VEGF-inducible chemotaxis response to baseline, suggesting that additional VEGFRs expressed on T cells may also mediate migration. Nevertheless, we found that the inhibitory effect of SU5416 was greater in mitogen-activated T cells (which express higher levels of KDR) compared with unactivated T cells. Collectively, these observations indicate that VEGF has direct effects on human T cells to elicit chemotaxis, and further, migratory responses in T cells involve interactions between VEGF and T-cell VEGFRs, including KDR.
Interaction(s) with ECs result in the induction of KDR on human T cells
We have previously reported that cell surface molecules expressed by activated T cells induce VEGF expression in ECs.42 Thus, T cell–mediated induction of VEGF by ECs may result in a VEGF-dependent amplification loop to facilitate transmigration events, as evidenced by our functional observations in Figures 3 and 4. However, it is possible that this interaction is bidirectional in as much as activated ECs may also induce the expression of KDR on T cells. To test this possibility, we cocultured CD4+ or CD8+ T cells with unactivated ECs or with TNFα-activated ECs, and we subsequently performed FACS analysis to examine the coexpression of KDR on either CD4+ or CD8+ T cells. As illustrated in Figure 6A, coculture with untreated ECs had minimal effects on KDR expression. However, coculture with TNFα-activated ECs resulted in a notable induction of expression of KDR on both CD4+ and CD8+ cells, whereas the expression of KDR on ECs was essentially unchanged in the absence or presence of T cells (Figure 6B). EC-induced expression of KDR on each T-cell subset was evident after 4 hours, and peaked in expression 6 hours after coculture (Figure 6C). In addition, after 6 hours of coculture with TNFα-activated ECs, we found noticable expression of KDR on each T-cell subset by confocal microscopy (Figure 6D). This temporal pattern of induction of KDR expression after coculture with activated ECs is consistent with our functional analyses illustrated in Figures 3 and 4, where we observed that blockade of VEGF or KDR had functional inhibitory effects only at times greater than 2 hours after interactions. Thus, EC-mediated induction of KDR on T cells may function to elicit a VEGF-dependent chemotaxis response.
Figure 6.

Effect of ECs on inducible KDR expression by human CD4+ and CD8+ T cells. Untreated or TNFα-activated ECs (100U/mL for 6 hours) were incubated with purified populations of either CD4+ or CD8+ T cells (1 × 10⁵ cells) in a ratio of 1:1 for increasing times up to 6 hours, as indicated. After coculture, FACS was performed for the evaluation of T-cell expression of KDR. (A) Representative dot plots after culture of either CD4+ (top panels) or CD8+ T cells (bottom panels) with ECs. (B) Representative FACS histograms illustrating expression of KDR on TNFα–activated ECs before and after coculture with CD4+ or CD8+ T cells. (C) Representative FACS histograms illustrating the temporal induction of KDR expression on CD4+ T cells (top panels) or CD8+ T cells (bottom panels) after coculture with TNFα–activated ECs. (D) Confocal microscopy illustrating colocalization of CD3 and KDR on CD4+ T cells (top panels) and CD8+ T cells (bottom panels) after coculture with TNFα-activated endothelial cells. Panels A, B, and C are representative of n ≥ 5 per experimental group. Panel D is representative of n = 2, with identical results.
Finally, we evaluated whether KDR-expressing T cells are primed to migrate across ECs. ECs were cultured to confluency in transwells and were treated with TNFα for 6 hours prior to each assay. After washing, CD4+ or CD8+ T cells were placed in the upper chamber of transwells, and subsequently, the cells were harvested either from the upper chamber (nontransmigrated T cells) or from the lower chamber (transmigrated cells) for FACS analysis. As illustrated in supplemental Figure 3, we found that the expression of KDR was significantly higher in cells that transmigrated across TNFα-activated ECs. Collectively, these data indicate that contact between T cells and TNFα-activated ECs results in the induction of KDR, which subsequently facilitates migration.
Blockade of VEGF inhibits the recruitment of human KDR-expressing lymphocytes in vivo
To test the in vivo relevance of our in vitro observations, we made use of a humanized SCID model of human skin inflammation, previously established in the laboratory.8,38 After intraperitoneal injection of human PBMCs into SCID mice, it has been shown that there is a transient emergence of human memory T cells within the mouse circulation.43 Also, it has been found that these circulating human T cells have the potential to infiltrate human tissues that engraft onto the SCID mice.37,38,44 To evaluate whether VEGF mediates the trafficking of KDR-expressing T cells in vivo, human neonatal foreskin grafts were transplanted onto SCID mice and were allowed to heal for 4 to 6 weeks. Subsequently, human PBMCs were transferred into the mouse by intraperitoneal injection. One group of mice received control human IgG, and a second group received a blocking anti–human VEGF (Avastin, Genentech; 5mg/kg every other day). After 14 days, the skin grafts were harvested and were analyzed by routine histology for leukocytic infiltrates, and by immunofluorescence for the colocalization of KDR and CD3. As illustrated in Figure 7, grafts harvested from untreated animals had marked infiltrates including significant numbers of CD3+ T cells. There was notable expression of KDR on T-cell infiltrates within these grafts. In contrast, we found reduced numbers of T cells in the grafts harvested from mice treated with the blocking anti–human VEGF antibody, and we found that KDR was essentially absent on these infiltrates. We interpret these findings to indicate that VEGF may functionally interact with KDR-expressing T cells in vivo to facilitate their migration and/or localization at sites of inflammation.
Figure 7.

The effect of anti-VEGF on the recruitment of KDR-expressing lymphocytes in vivo. SCID mice with human skin transplants were humanized by adoptive transfer of human PBMCs intraperitoneally. At the time of humanization, and every other day, the mice received human IgG or humanized anti–human VEGF (5mg/kg in 100μl saline). After 14 days, the skin grafts were harvested and were analyzed by H&E staining and by immunofluorescence. Illustrated in the lefthand panels are representative photomicrografts of skin grafts harvested from mice treated with control IgG. The photomicrografts illustrated in the right panels are representative of skins harvested from mice treated with anti-VEGF. Expression of CD3 is illustrated in green, KDR in red, and the merged images (bottom panels, yellow color) illustrate coexpression of KDR with CD3 on T-cell infiltrates. Magnification of all micrographs, ×400. Boxed insets, magnification × 800. Representative of n = 4 mice in each group.
Discussion
In this study, we demonstrate that the VEGF receptor KDR is expressed at the mRNA and protein level on subsets of mitogen-activated CD4+ and CD8+ T cells in vitro. Furthermore, we show that the interaction between T cells and activated ECs results in KDR expression, and that blockade of VEGF or KDR inhibits transendothelial migration in vitro. We also find that blockade of VEGF inhibits the localization of KDR-expressing T cells within inflamed tissues in vivo. These new observations indicate that induced expression of KDR on T cells and locally expressed VEGF serve as direct mediators of immune inflammation.
We focused our analyses on the expression and function of KDR, but other VEGF receptors including Flt-1 and neuropilin-1 may be expressed by select T-cell subsets.13,15,20,21,26 Ectopic expression of FoxP3 in T cells has been found to result in the induced expression of neuropilin-1,20,22 which is well established to function in motility responses.45 Also, while Flt-1 is expressed on T cells,13,15 our observations indicate that its level of cell surface expression is low, even after mitogen-activation. Thus, while VEGF likely mediates motility responses through several VEGF receptors expressed on T cells, our findings in this report indicate that signaling via KDR is sufficient to mediate chemotaxis.
Nevertheless, we find that anti-VEGF alone (in the absence of KDR blockade) is potent to inhibit T-cell migration in vitro and in vivo. This observation suggests that the local production of VEGF, and not the induction of T-cell KDR, may be critical for directed lymphocyte migration. In our in vitro studies, the effect of anti-VEGF was not evident for 2 to 4 hours after lymphocyte-endothelial contact, suggesting induction in expression (and thus function) after coculture. Consistent with this possibility, we have demonstrated that cell surface expression of CD40L, known to be expressed by activated T cells,46 may interact with CD40 on ECs to mediate VEGF overexpression.36,42 Thus, an interpretation of our observations is that the interaction between T cells and ECs increases the production of local VEGF (by ECs), which in turn facilitates the migratory response.
VEGF-KDR interactions in ECs result in the induced expression of adhesion molecules and chemokines (including MCP-1 and IP-10).8,9,11,12,14 Furthermore, in previous studies, we defined a major role for VEGF in the inducible expression of the T-cell chemoattractant chemokine IP-10, which subsequently mediates T-cell trafficking in vivo.8,14 Consistent with these observations, using siRNA, we find that knockdown of KDR expression in ECs alone inhibits T-cell transendothelial migration. However, we also find that the addition of anti-KDR into assays using knockdown cells has an additive effect on the inhibition of T-cell transmigration. In addition, using the Boyden chamber assay in the absence of ECs, we find that VEGF mediates chemotactic effects on T cells in part via KDR-induced signals. Collectively, these observations, as well as our previously published reports8,14,15 point to nonendothelial mechanisms whereby VEGF may interact directly with T cells to promote chemotaxis. The studies outlined in this report indicate that these additional mechanisms in part involve direct interactions between VEGF and KDR expressed on subsets of T cells. Therefore, local tissue expression of VEGF may interact with KDR on ECs and on T cells to mediate T-cell trafficking within inflamed tissues.
In our studies, we find that T cell–EC interactions result in the induction of KDR expression on interacting T cells; and further, we observed that induced T-cell expression of KDR, and KDR-induced signals function in transendothelial migration. Signaling via KDR is well established to mediate migratory responses in ECs, in part involving the PI-3 kinase and MAP kinase pathways.47 Consistent with this possibility, PI-3K-inducible signals48 and MAPK-inducible signals49 are potent for the chemotaxis of T cells, including the chemotaxis response to VEGF.15 Thus, there are several mechanisms and distinct signaling pathways by which VEGF and KDR may elicit a T-cell motility response.
Finally, we suggest that the findings defined in this report have significant clinical implications in transplantation medicine. For instance, in chronic allograft rejection, ongoing inflammation as well as local tissue ischemia results in persistent overexpression of VEGF.39,41 Our findings are consistent with the possibility that circulating allosensitized T cells (expressing KDR) will respond to local overproduction of VEGF within allografts leading to chemoattraction. It will be interesting in the future to determine whether KDR expression on circulating or intragraft T cells predicts and/or correlates with graft failure.
In addition, although beyond the scope of our studies, our data also provide insight into how the local overproduction of VEGF by tumors may result in T regulatory cell recruitment that may serve to inhibit a destructive immune response. We suggest that the absence of antigen-specific sensitization in patients with cancer skews the biologic effect of tumor derived VEGF to be selective for the recruitment of circulating VEGFR-expressing T regulatory cells.20,24–26 Indeed, it has been reported that VEGFR-expressing T regulatory cells are present within tumors.24,25 Perhaps, in the future, therapies that augment the generation of VEGFR-expressing tumor-specific cytotoxic T cells, with potential to migrate in response to VEGF, will enable T cell–dependent targeting of tumors.
Supplementary Material
Acknowledgments
The authors thank Drs Soumitro Pal, Olivier Dormond, Papia Banerjee, and Sarah Bruneau for helpful discussions. We also thank Lihong Bu, PhD, and the Children's Hospital Boston Intellectual and Developmental Disabilities Research Center Core (IDDRC, funded by 5P30 HD018655) for help with confocal imaging. Finally, we are grateful for the support of the maternity staff at South Shore Hospital for the supply of umbilical cords used for the generation of ECs.
This work was supported by National Institutes of Health grants HL74456 and AI46756 to D.M.B. M.E. was also supported by an Erwin-Schrödinger overseas fellowship award from the Austrian Science Fund.
Footnotes
The online version of this article contains a data supplement.
The publication costs of this article were defrayed in part by page charge payment. Therefore, and solely to indicate this fact, this article is hereby marked “advertisement” in accordance with 18 USC section 1734.
Authorship
Contribution: M.E. helped design and performed research, interpreted data, and contributed to technical and analytic tools and to writing of the manuscript; D.D. performed research and contributed to analytic tools, the collection and interpretation of data, and to writing of the manuscript; I.H.C.V. performed research and contributed to analytic tools, the collection and interpretation of data, and to writing of the manuscript; A.B. and M.P.S. performed research and interpreted data; M.E.J.R. and M.S. performed research; K.C. contributed to use of vital research reagents and use of analytical technical tools; P.G. contributed vital reagents and in the interpretation of data; and D.M.B. designed research, supervised and contributed to technical and analytic tools, supervised and counseled on data generation, interpreted data, and wrote the manuscript.
Conflict-of-interest disclosure: The authors declare no competing financial interests.
Correspondence: David M. Briscoe, MD, Division of Nephrology, Children's Hospital, 300 Longwood Ave, Boston, MA 02115; e-mail: david.briscoe@childrens.harvard.edu.
References
- 1.Leung DW, Cachianes G, Kuang WJ, Goeddel DV, Ferrara N. Vascular endothelial growth factor is a secreted angiogenic mitogen. Science. 1989;246(4935):1306–1309. doi: 10.1126/science.2479986. [DOI] [PubMed] [Google Scholar]
- 2.Senger DR, Galli SJ, Dvorak AM, Perruzzi CA, Harvey VS, Dvorak HF. Tumor cells secrete a vascular permeability factor that promotes accumulation of ascites fluid. Science. 1983;219(4587):983–985. doi: 10.1126/science.6823562. [DOI] [PubMed] [Google Scholar]
- 3.Reinders ME, Rabelink TJ, Briscoe DM. Angiogenesis and endothelial cell repair in renal disease and allograft rejection. J Am Soc Nephrol. 2006;17(4):932–942. doi: 10.1681/ASN.2005121250. [DOI] [PubMed] [Google Scholar]
- 4.Ferrara N, Alitalo K. Clinical applications of angiogenic growth factors and their inhibitors. Nat Med. 1999;5(12):1359–1364. doi: 10.1038/70928. [DOI] [PubMed] [Google Scholar]
- 5.Contreras AG, Briscoe DM. Every allograft needs a silver lining. J Clin Invest. 2007;117(12):3645–3648. doi: 10.1172/JCI34238. [DOI] [PMC free article] [PubMed] [Google Scholar]
- 6.Koch AE, Harlow LA, Haines GK, et al. Vascular endothelial growth factor. A cytokine modulating endothelial function in rheumatoid arthritis. J Immunol. 1994;152(8):4149–4156. [PubMed] [Google Scholar]
- 7.Zhao Q, Egashira K, Inoue S, et al. Vascular endothelial growth factor is necessary in the development of arteriosclerosis by recruiting/activating monocytes in a rat model of long-term inhibition of nitric oxide synthesis. Circulation. 2002;105(9):1110–1115. doi: 10.1161/hc0902.104718. [DOI] [PubMed] [Google Scholar]
- 8.Reinders ME, Sho M, Izawa A, et al. Proinflammatory functions of vascular endothelial growth factor in alloimmunity. J Clin Invest. 2003;112(11):1655–1665. doi: 10.1172/JCI17712. [DOI] [PMC free article] [PubMed] [Google Scholar]
- 9.Melder RJ, Koenig GC, Witwer BP, Safabakhsh N, Munn LL, Jain RK. During angiogenesis, vascular endothelial growth factor and basic fibroblast growth factor regulate natural killer cell adhesion to tumor endothelium. Nat Med. 1996;2(9):992–997. doi: 10.1038/nm0996-992. [DOI] [PubMed] [Google Scholar]
- 10.Barleon B, Sozzani S, Zhou D, Weich HA, Mantovani A, Marme D. Migration of human monocytes in response to vascular endothelial growth factor (VEGF) is mediated via the VEGF receptor flt-1. Blood. 1996;87(8):3336–3343. [PubMed] [Google Scholar]
- 11.Kim I, Moon SO, Kim SH, Kim HJ, Koh YS, Koh GY. Vascular endothelial growth factor expression of intercellular adhesion molecule 1 (ICAM-1), vascular cell adhesion molecule 1 (VCAM-1), and E-selectin through nuclear factor-kappa B activation in endothelial cells. J Biol Chem. 2001;276(10):7614–7620. doi: 10.1074/jbc.M009705200. [DOI] [PubMed] [Google Scholar]
- 12.Marumo T, Schini-Kerth VB, Busse R. Vascular endothelial growth factor activates nuclear factor-kappaB and induces monocyte chemoattractant protein-1 in bovine retinal endothelial cells. Diabetes. 1999;48(5):1131–1137. doi: 10.2337/diabetes.48.5.1131. [DOI] [PubMed] [Google Scholar]
- 13.Shin JY, Yoon IH, Kim JS, Kim B, Park CG. Vascular endothelial growth factor-induced chemotaxis and IL-10 from T cells. Cell Immunol. 2009;256(1-2):72–78. doi: 10.1016/j.cellimm.2009.01.006. [DOI] [PubMed] [Google Scholar]
- 14.Boulday G, Haskova Z, Reinders ME, Pal S, Briscoe DM. Vascular endothelial growth factor-induced signaling pathways in endothelial cells that mediate overexpression of the chemokine IFN-gamma-inducible protein of 10 kDa in vitro and in vivo. J Immunol. 2006;176(5):3098–3107. doi: 10.4049/jimmunol.176.5.3098. [DOI] [PubMed] [Google Scholar]
- 15.Basu A, Hoerning A, Datta D, et al. Cutting edge: Vascular endothelial growth factor-mediated signaling in human CD45RO+ CD4+ T cells promotes Akt and ERK activation and costimulates IFN-gamma production. J Immunol. 2010;184(2):545–549. doi: 10.4049/jimmunol.0900397. [DOI] [PMC free article] [PubMed] [Google Scholar]
- 16.Sho M, Akashi S, Kanehiro H, et al. Function of the vascular endothelial growth factor receptors Flt-1 and Flk-1/KDR in the alloimmune response in vivo. Transplantation. 2005;80(6):717–722. doi: 10.1097/01.tp.0000173650.83320.b1. [DOI] [PubMed] [Google Scholar]
- 17.Lemstrom KB, Krebs R, Nykanen AI, et al. Vascular endothelial growth factor enhances cardiac allograft arteriosclerosis. Circulation. 2002;105(21):2524–2530. doi: 10.1161/01.cir.0000016821.76177.d2. [DOI] [PubMed] [Google Scholar]
- 18.Blazquez C, Cook N, Micklem K, Harris AL, Gatter KC, Pezzella F. Phosphorylated KDR can be located in the nucleus of neoplastic cells. Cell Res. 2006;16(1):93–98. doi: 10.1038/sj.cr.7310012. [DOI] [PubMed] [Google Scholar]
- 19.Dias S, Hattori K, Zhu Z, et al. Autocrine stimulation of VEGFR-2 activates human leukemic cell growth and migration. J Clin Invest. 2000;106(4):511–521. doi: 10.1172/JCI8978. [DOI] [PMC free article] [PubMed] [Google Scholar]
- 20.Sarris M, Andersen KG, Randow F, Mayr L, Betz AG. Neuropilin-1 expression on regulatory T cells enhances their interactions with dendritic cells during antigen recognition. Immunity. 2008;28(3):402–413. doi: 10.1016/j.immuni.2008.01.012. [DOI] [PMC free article] [PubMed] [Google Scholar]
- 21.Milpied P, Renand A, Bruneau J, et al. Neuropilin-1 is not a marker of human Foxp3+ Treg. Eur J Immunol. 2009;39(6):1466–1471. doi: 10.1002/eji.200839040. [DOI] [PubMed] [Google Scholar]
- 22.Zheng Y, Josefowicz SZ, Kas A, Chu TT, Gavin MA, Rudensky AY. Genome-wide analysis of Foxp3 target genes in developing and mature regulatory T cells. Nature. 2007;445(7130):936–940. doi: 10.1038/nature05563. [DOI] [PubMed] [Google Scholar]
- 23.Bruder D, Probst-Kepper M, Westendorf AM, et al. Neuropilin-1: a surface marker of regulatory T cells. Eur J Immunol. 2004;34(3):623–630. doi: 10.1002/eji.200324799. [DOI] [PubMed] [Google Scholar]
- 24.Suzuki H, Onishi H, Wada J, et al. VEGFR2 is selectively expressed by FOXP3high CD4+ Treg. Eur J Immunol. 2010;40(1):197–203. doi: 10.1002/eji.200939887. [DOI] [PubMed] [Google Scholar]
- 25.Wada J, Suzuki H, Fuchino R, et al. The contribution of vascular endothelial growth factor to the induction of regulatory T-cells in malignant effusions. Anticancer Res. 2009;29(3):881–888. [PubMed] [Google Scholar]
- 26.Battaglia A, Buzzonetti A, Monego G, et al. Neuropilin-1 expression identifies a subset of regulatory T cells in human lymph nodes that is modulated by preoperative chemoradiation therapy in cervical cancer. Immunology. 2008;123(1):129–138. doi: 10.1111/j.1365-2567.2007.02737.x. [DOI] [PMC free article] [PubMed] [Google Scholar]
- 27.Tordjman R, Lepelletier Y, Lemarchandel V, et al. A neuronal receptor, neuropilin-1, is essential for the initiation of the primary immune response. Nat Immunol. 2002;3(5):477–482. doi: 10.1038/ni789. [DOI] [PubMed] [Google Scholar]
- 28.Soker S, Takashima S, Miao HQ, Neufeld G, Klagsbrun M. Neuropilin-1 is expressed by endothelial and tumor cells as an isoform-specific receptor for vascular endothelial growth factor. Cell. 1998;92(6):735–745. doi: 10.1016/s0092-8674(00)81402-6. [DOI] [PubMed] [Google Scholar]
- 29.Klagsbrun M, D'Amore PA. Vascular endothelial growth factor and its receptors. Cytokine Growth Factor Rev. 1996;7(3):259–270. doi: 10.1016/s1359-6101(96)00027-5. [DOI] [PubMed] [Google Scholar]
- 30.Mor F, Quintana FJ, Cohen IR. Angiogenesis-inflammation cross-talk: vascular endothelial growth factor is secreted by activated T cells and induces Th1 polarization. J Immunol. 2004;172(7):4618–4623. doi: 10.4049/jimmunol.172.7.4618. [DOI] [PubMed] [Google Scholar]
- 31.Chapoval SP, Lee CG, Tang C, et al. Lung vascular endothelial growth factor expression induces local myeloid dendritic cell activation. Clin Immunol. 2009;132(3):371–384. doi: 10.1016/j.clim.2009.05.016. [DOI] [PMC free article] [PubMed] [Google Scholar]
- 32.Lee CG, Link H, Baluk P, et al. Vascular endothelial growth factor (VEGF) induces remodeling and enhances TH2-mediated sensitization and inflammation in the lung. Nat Med. 2004;10(10):1095–1103. doi: 10.1038/nm1105. [DOI] [PMC free article] [PubMed] [Google Scholar]
- 33.Kim YS, Hong SW, Choi JP, et al. Vascular endothelial growth factor is a key mediator in the development of T cell priming and its polarization to type 1 and type 17 T helper cells in the airways. J Immunol. 2009;183(8):5113–5120. doi: 10.4049/jimmunol.0901566. [DOI] [PMC free article] [PubMed] [Google Scholar]
- 34.Gimbrone MA., Jr Culture of vascular endothelium. Prog Hemost Thromb. 1976;3:1–28. [PubMed] [Google Scholar]
- 35.Roth SJ, Carr MW, Rose SS, Springer TA. Characterization of transendothelial chemotaxis of T lymphocytes. J Immunol Methods. 1995;188(1):97–116. doi: 10.1016/0022-1759(95)00208-1. [DOI] [PubMed] [Google Scholar]
- 36.Dormond O, Contreras AG, Meijer E, et al. CD40-induced signaling in human endothelial cells results in mTORC2- and Akt-dependent expression of vascular endothelial growth factor in vitro and in vivo. J Immunol. 2008;181(11):8088–8095. doi: 10.4049/jimmunol.181.11.8088. [DOI] [PMC free article] [PubMed] [Google Scholar]
- 37.Murray AG, Schechner JS, Epperson DE, et al. Dermal microvascular injury in the human peripheral blood lymphocyte reconstituted-severe combined immunodeficient (HuPBL-SCID) mouse/skin allograft model is T cell mediated and inhibited by a combination of cyclosporine and rapamycin. Am J Pathol. 1998;153:627–638. doi: 10.1016/S0002-9440(10)65604-0. [DOI] [PMC free article] [PubMed] [Google Scholar]
- 38.Moulton KS, Melder RJ, Dharnidharka VR, Hardin-Young J, Jain RK, Briscoe DM. Angiogenesis in the huPBL-SCID model of human transplant rejection. Transplantation. 1999;67(12):1626–1631. doi: 10.1097/00007890-199906270-00020. [DOI] [PubMed] [Google Scholar]
- 39.Reinders ME, Fang JC, Wong W, Ganz P, Briscoe DM. Expression patterns of vascular endothelial growth factor in human cardiac allografts: association with rejection. Transplantation. 2003;76(1):224–230. doi: 10.1097/01.TP.0000071363.55007.D0. [DOI] [PubMed] [Google Scholar]
- 40.Pilmore HL, Eris JM, Painter DM, Bishop GA, McCaughan GW. Vascular endothelial growth factor expression in human chronic renal allograft rejection. Transplantation. 1999;67(6):929–933. doi: 10.1097/00007890-199903270-00024. [DOI] [PubMed] [Google Scholar]
- 41.Torry RJ, Labarrere CA, Torry DS, Holt VJ, Faulk WP. Vascular endothelial growth factor expression in transplanted human hearts. Transplantation. 1995;60(12):1451–1457. doi: 10.1097/00007890-199560120-00014. [DOI] [PubMed] [Google Scholar]
- 42.Melter M, Reinders ME, Sho M, et al. Ligation of CD40 induces the expression of vascular endothelial growth factor by endothelial cells and monocytes and promotes angiogenesis in vivo. Blood. 2000;96(12):3801–3808. [PubMed] [Google Scholar]
- 43.Tary-Lehmann M, Saxon A, Lehmann PV. The human immune system in hu-PBL-SCID mice. Immunol Today. 1995;16:529–533. doi: 10.1016/0167-5699(95)80046-8. [DOI] [PubMed] [Google Scholar]
- 44.Briscoe DM, Dharnidharka VR, Isaacs C, et al. The allogeneic response to cultured human skin equivalent in the hu-PBL-SCID mouse model of skin rejecton. Transplantation. 1999;67:1590–1599. doi: 10.1097/00007890-199906270-00014. [DOI] [PubMed] [Google Scholar]
- 45.Miao HQ, Klagsbrun M. Neuropilin is a mediator of angiogenesis. Cancer Metastasis Rev. 2000;19(1-2):29–37. doi: 10.1023/a:1026579711033. [DOI] [PubMed] [Google Scholar]
- 46.Ochs HD, Hollenbaugh D, Aruffo A. The role of CD40L (gp39)/CD40 in T/B cell interaction and primary immunodeficiency. Semin Immunol. 1994;6:337–341. doi: 10.1006/smim.1994.1042. [DOI] [PubMed] [Google Scholar]
- 47.Matsumoto T, Mugishima H. Signal transduction via vascular endothelial growth factor (VEGF) receptors and their roles in atherogenesis. J Atheroscler Thromb. 2006;13(3):130–135. doi: 10.5551/jat.13.130. [DOI] [PubMed] [Google Scholar]
- 48.Fruman DA. Phosphoinositide 3-kinase and its targets in B-cell and T-cell signaling. Curr Opin Immunol. 2004;16(3):314–320. doi: 10.1016/j.coi.2004.03.014. [DOI] [PubMed] [Google Scholar]
- 49.Scaldaferri F, Sans M, Vetrano S, et al. The role of MAPK in governing lymphocyte adhesion to and migration across the microvasculature in inflammatory bowel disease. Eur J Immunol. 2009;39(1):290–300. doi: 10.1002/eji.200838316. [DOI] [PubMed] [Google Scholar]
Associated Data
This section collects any data citations, data availability statements, or supplementary materials included in this article.