

Abstract
Voltage-gated potassium (Kv) currents generated by N-type α-subunit homotetramers inactivate rapidly because an N-terminal ball domain blocks the channel pore after activation. Hence, the inactivation rate of heterotetrameric channels comprising both N-type and non-N-type (delayed rectifier) α-subunits depends upon the number of N-type α-subunits in the complex. As Kv channel inactivation and inactivation recovery rates regulate cellular excitability, the composition and expression of these heterotetrameric complexes are expected to be tightly regulated. In a companion article, we showed that the single transmembrane segment ancillary (β) subunits KCNE1 and KCNE2 suppress currents generated by homomeric Kv1.4, Kv3.3, and Kv3.4 channels, by trapping them early in the secretory pathway. Here, we show that this trapping is prevented by coassembly of the N-type α-subunits with intra-subfamily delayed rectifier α-subunits. Extra-subfamily delayed rectifier α-subunits, regardless of their capacity to interact with KCNE1 and KCNE2, cannot rescue Kv1.4 or Kv3.4 surface expression unless engineered to interact with them using N-terminal A and B domain swapping. The KCNE1/2-enforced checkpoint ensures N-type α-subunits only reach the cell surface as part of intra-subfamily mixed-α complexes, thereby governing channel composition, inactivation rate, and—by extension—cellular excitability.
Introduction
Neuronal voltage-gated potassium (Kv) channels contribute to the regulation of resting membrane potential and action potential duration and frequency (1,2). Delayed rectifier Kv channels, such as Kv1.1 and Kv3.1, activate and conduct K+ ions with only relatively slow, C-type inactivation, permitting high-frequency trains of action potentials (3,4). Rapidly inactivating Kv channels regulate the repetitive firing frequencies of neurons, altering action potential refractory periods, spike duration, and interspike intervals, thus promoting frequency-dependent action potential broadening (4–7). Of the pore-forming (α) subunits that form these fast-inactivating channels, only three—Kv1.4, Kv3.3, and Kv3.4—are known to inactivate by virtue of an intracellular N-terminal inactivation domain that occludes the channel pore, preventing K+ conduction and causing rapid current decay after channel opening. Hence, their inactivation process is referred to as N-type, and we will also refer to these α-subunits, and the channels they form, as N-type (Fig. 1 A) (8,9).
Figure 1.
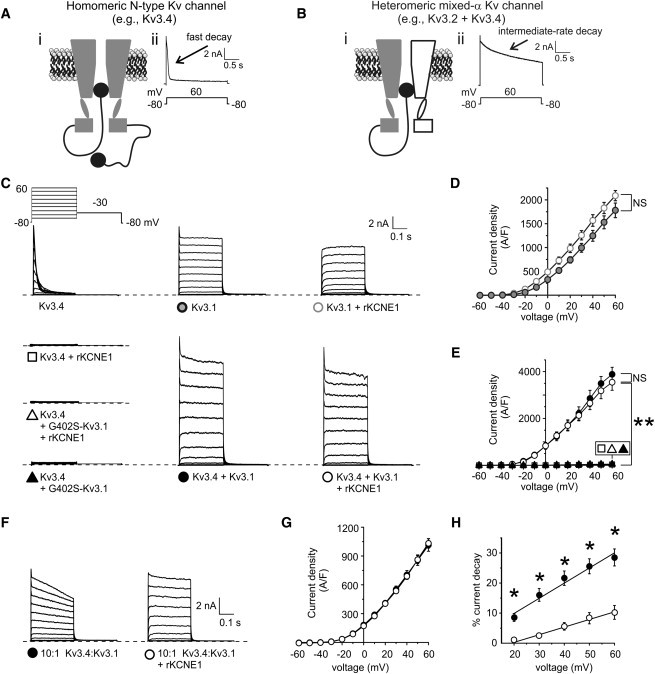
Kv3.1 prevents KCNE1-mediated inhibition of Kv3.4 current. (A) Schematic of a homomeric N-type Kv channel. (i) Cross section through a homomeric N-type Kv channel, with α-subunits highlighting the ion conduction pathway. (ii) Exemplar current trace at +60 mV of Kv3.4 using the inset voltage protocol. (B) Schematic of a heteromeric mixed-α Kv channel. (i) Cross section through an heteromeric mixed-α Kv channel, showing one N-type and one delayed rectifier α-subunit, highlighting the ion conduction pathway being blocked by the N-terminal ball domain. (ii) Exemplar current trace at +60 mV recorded from cells coexpressing Kv3.2 and Kv3.4 using the inset voltage protocol. (C) Exemplar traces showing currents recorded in CHO cells transfected with cDNA encoding channel subunits as indicated. (Inset) Voltage protocol. (D) Mean peak current density from CHO cells transfected with cDNA encoding Kv3.1 alone (n = 10), or with KCNE1 (n = 10), symbols as in panel C. NS, no significant difference. (E) Mean peak current density from CHO cells transfected with cDNA encoding Kv3.1 and Kv3.4 alone (n = 19) or with KCNE1 (n = 16); G402S-Kv3.1 and Kv3.4 alone (n = 17) or with KCNE1 (n = 13); symbols as in panel C. NS signifies no significant difference; ∗p < 0.001. (F) Exemplar traces showing currents recorded in CHO cells cotransfected with 100-ng Kv3.4 cDNA and 10-ng Kv3.1 cDNA, with or without 500-ng KCNE1 cDNA; Voltage protocol as in panel C. (G) Mean peak current density for CHO cells cotransfected with 100-ng Kv3.4 cDNA and 10-ng Kv3.1 cDNA, with (n = 13) or without (n = 13) 500-ng KCNE1 cDNA; symbols as in panel F. (H) Mean inactivation extent quantified as current decay over the 300-ms test pulse, versus voltage, for cells as in panels F and G; ∗p < 0.05.
Kv α-subunits in subfamilies 1–4 each contain an N-terminal A and B box (NAB) domain that allows subfamily-specific heteromerization (10,11), and heteromeric assemblies containing a mix of N-type and delayed rectifier α-subunits are known to occur in vivo. For example, Kv3.1-Kv3.4 (7) and Kv1.1-Kv1.4 (12–15) complexes generate neuronal N-type currents with intermediate rates of decay (Fig. 1 B). In rat fast-spiking neurons, Kv3.1-Kv3.4 complexes facilitate high repetitive spike rates (7). In vitro studies of Kv1.1 and Kv1.4 heterologously coexpressed in either Xenopus oocytes or HeLa cells show that the rate of inactivation is dependent on the number of inactivation domains or balls present in the heteromeric complex (16,17). Similarly, coexpression studies of heteromeric Shaker channels, and also Kv3.1-Kv3.4 heteromers, show that a single N-type α-subunit is sufficient to induce N-type inactivation of the complex (18–20).
Given the dominant effect of N-type α-subunits on channel inactivation, their incorporation into mixed-α complexes would be expected to be tightly controlled in vivo. Yet, the mechanisms regulating heteromeric versus homomeric α-subunit assembly are still not fully understood, although it has been suggested that an unknown subunit mediates functional α-subunit heteromeric assembly (21). We previously demonstrated that single transmembrane segment ancillary (β) subunits in the KCNE subfamily can modulate the expression of both N-type and delayed rectifier Kv3 subfamily channels (22–24). In a companion article, we showed that currents produced by the N-type α-subunits Kv1.4, Kv3.3, and Kv3.4 are inhibited by KCNE1 and KCNE2 by trapping early in the secretory pathway (see our companion article in this issue). Here, we demonstrate that integration of Kv1.4 and Kv3.4 into heteromeric (mixed-α) complexes with intra-subfamily delayed rectifier α-subunits prevents intracellular trapping of N-type α-subunits by KCNE1 and KCNE2. This results in surface expression of only mixed-α complexes, presenting what we believe to be a novel mechanism for controlling the α-subunit composition and inactivation rate of the surface-expressed Kv channel population.
Materials and Methods
Cell culture and transfection
Chinese hamster ovary (CHO) cells were cultured, passed, and transfected as described in our companion article. Briefly, CHO cells cultured in F12K medium (containing L-glutamine and sodium bicarbonate; American Type Culture Collection, Manassas, VA), supplemented with 10% fetal bovine serum (Invitrogen, Carlsbad, CA) and 1% penicillin and streptomycin, were transiently transfected using SuperFect transfection reagent (Qiagen, Hilden, Germany) as follows: 0.1 μg (unless otherwise noted) of each rat α-subunit cDNA alone or in combination with 0.5 μg of rat β-subunit cDNA, enhanced green fluorescent protein (pBOB-EGFP) to visualize transfected cells, and an empty vector (pBluescript) to enhance transfection efficiency. All experiments were carried out 24 h after transfection. For protein biochemistry and immunofluorescence experiments, hemagglutinin (HA)-tagged rat KCNE1 and KCNE2 constructs were used to facilitate detection using an anti-HA antibody.
Electrophysiology
Electrophysiology recordings were performed using transiently-transfected CHO cells by voltage-clamp using the whole-cell configuration of the patch-clamp technique as previously described in Lewis et al. (23), and as fully detailed in our companion article. Briefly, patch pipettes were made by pulling borosilicate glass capillaries with filament (Sutter Instruments, Novato, CA) using a P-97 horizontal puller (Sutter Instruments). The tip resistances of the pipettes were between 3 and 5 MΩ. Whole-cell patch-clamp recordings were performed at room temperature using a Multiclamp 700A amplifier (Axon Instruments, Foster City, CA) and a Digidata 1322A analog-to-digital converter (Axon Instruments). Currents were measured using the following voltage protocol: cells were held at −80 mV and then pulsed at voltages between −60 mV and +60 mV in 10 mV increments for 300 ms, followed by 300-ms tail pulse at −30 mV. Data acquisition and analysis were performed using the pCLAMP 9.0 software suite (Axon Instruments). Leak and liquid potentials were not compensated for. Data are expressed as means ± SE of observations from n cells. Statistical significance was assessed by one-way analysis of variance with p < 0.05 being indicative of significance.
Protein biochemistry
Coimmunoprecipitation and surface biotinylation experiments were performed using a protocol adapted from Lewis et al. (23), and as detailed in our companion article. Here, antibodies used for immunoprecipitation also included a rabbit polyclonal anti-Kv3.4 (Sigma, St. Louis, MO), a rabbit polyclonal anti-Kv3.1 (Sigma), or a mouse monoclonal anti-HA-7 (Sigma). After transfer onto PVDF membranes, blots were probed with either monoclonal mouse anti-HA antibodies or polyclonal rabbit anti-Kv3.1 or rabbit anti-Kv3.4 antibodies (Sigma) overnight at 4°C.
Immunofluorescence and colocalization analysis
Immunofluorescence experiments were performed as detailed in our companion article. Cells were transfected with α- and β-subunit cDNA as for electrophysiology, and with 1 μg cDNA encoding a fluorescent cell organelle marker (Clontech Laboratories, Mountain View, CA) labeling either the endoplasmic reticulum (pDsRed2-ER Vector) or the Golgi (pDsRed-Monomer-Golgi Vector). All experiments were performed 24 h posttransfection. Cells were fixed in ice-cold 4% paraformaldehyde followed by permeabilization using 0.25% Triton-X-100 in phosphate-buffered saline. Cells were then blocked in 1% bovine serum albumin/phosphate-buffered saline and incubated with primary antibodies as follows: rabbit polyclonal anti-Kv3.4 (1:300; Sigma), rabbit polyclonal anti-Kv1.4 (1:300; Chemicon, Temecula, CA), or mouse monoclonal anti-HA 7 (1:1000; Sigma).
For cells containing multiple Kv α-subunits, only N-type α-subunits were immunolabeled. The secondary antibodies utilized were Alexa Fluor 488 donkey anti-rabbit IgG (H+L) or Alexa Fluor 350 donkey anti-mouse IgG (H+L) (1:1000). Slides were visualized using a BX51 microscope with fluorescence capabilities (Olympus, Tokyo, Japan) and images acquired using cellSens Standard digital imaging software (Olympus). Colocalization of proteins and markers was quantified using Pearson's correlation coefficient, determined through intensity correlation analysis (25) with ImageJ software (National Institutes of Health, Bethesda, MD), using the MBF ImageJ for Microscopy collection of plug-ins (McMaster Biophotonics Facility, Hamilton, Ontario, Canada).
Detailed methods for the colocalization analysis are provided in our companion article. Lastly, positive and negative controls for the correlation coefficients were performed in our companion article.
Results
Kv3.1 prevents KCNE1-mediated Kv3.4 current suppression
In our companion article, we demonstrate that coexpressed KCNE1 suppresses Kv3.4 current >95% (p < 0.001) (exemplar traces shown here in Fig. 1 C) by trapping Kv3.4 protein early in the secretory pathway, in CHO cells. We also previously found that KCNE1 interacts with Kv3.1, slowing both its activation and deactivation, but without significant current inhibition or intracellular retention (23) (results recapitulated here; Fig. 1, C and D). Given that Kv3.1 and Kv3.4 also form channels with one another, we next sought to determine which KCNE1 effect (intracellular trapping versus slowed gating), if any, would prevail in Kv3.1-Kv3.4 complexes. Strikingly, coexpression of Kv3.1 with both Kv3.4 and KCNE1 eliminated the suppression of current observed with Kv3.4 and KCNE1 in the absence of Kv3.1 (p < 0.001), generating a current profile very similar, in terms of both density and macroscopic gating attributes, to that of Kv3.1-Kv3.4 channels in the absence of KCNE1 (Fig. 1, C and E).
Because the currents produced by Kv3.1 and Kv3.4 cotransfection (with or without KCNE1) inactivated comparatively slowly, we determined whether the observed currents resulted from either summed homomeric Kv3.1 and homomeric Kv3.4 currents or heteromeric Kv3.1-Kv3.4 complexes. To do so, we mutated the canonical GYG pore motif of Kv3.1 to SYG, generating G402S-Kv3.1, a dominant-negative pore mutant that does not pass current and renders any complex with at least one SYG subunit nonfunctional (26). As expected G402S-Kv3.1 on its own produced no current (data not shown). When we coexpressed G402S-Kv3.1 with Kv3.4, regardless of KCNE1 coexpression, current density was reduced by 99% compared to currents generated by coexpression of wild-type Kv3.1 and Kv3.4 (p < 0.001; Fig. 1, C and E).
The robust Kv3.4 current inhibition achieved by coexpression of G402S-Kv3.1 (with or without KCNE1) strongly supports the hypothesis that the observed prevention by wild-type Kv3.1 of KCNE1-mediated inhibition of Kv3.4 (Fig. 1 C) arises from Kv3.1-Kv3.4 complex formation. However, what could be the physiological role of this phenomenon?
It presents an attractive mechanism for ensuring that Kv3.4 does not reach the cell surface alone, guaranteeing surface expression of Kv3.4 only in heteromeric Kv3.1-Kv3.4 complexes. Yet, when equal amounts of Kv3.1 and Kv3.4 cDNA are cotransfected into the cell, this also appears to result in remarkably efficient heteromeric Kv3.1-Kv3.4 complex assembly—as adjudged by the efficient suppression of Kv3.4 current by G402S-Kv3.1 regardless of KCNE1 coexpression (Fig. 1, C and E). We surmised that this capability could be functionally significant in cells in which a mismatch exists between Kv3.1 and Kv3.4 expression levels, and therefore examined the effect of KCNE1 in cells cotransfected with a 10:1 Kv3.4/Kv3.1 cDNA ratio. The effect was remarkable: cotransfected KCNE1 did not alter the current density, but significantly reduced the extent of inactivation over the 300-ms test pulse (e.g., threefold at +60 mV) (Fig. 1, F–H). This is as predicted if KCNE1 ensures a surface channel population comprising predominantly Kv3.1-Kv3.4 heteromers, even when there is 10-fold more Kv3.4 than Kv3.1, because non-Kv3.1-coupled Kv3.4 is trapped intracellularly by KCNE1.
Kv3.1-Kv3.4 heteromerization prevents KCNE1 coassembly
These data (Fig. 1, and the companion article) suggest that KCNE1 (and KCNE2) form an intracellular checkpoint that ensures homomeric N-type channels are not expressed at the cell surface. This raises mechanistic questions, the first being whether Kv3.1-rescued Kv3.4 complexes also contain KCNE1. Western blots of lysates from CHO cells expressing Kv3.1 and Kv3.4 showed two bands indicating the mature and immature molecular mass species of Kv3.1 (110 kDa and 84 kDa, respectively) and Kv3.4 (100 kDa and 75 kDa, respectively) (Fig. 2 A, and see companion article). Coexpression of KCNE1 did not prevent the presence of the mature form of either Kv3.1 or Kv3.4 in the surface fraction, as determined by surface biotinylation, although it introduced the presence of the lower molecular mass, immature form of either α-subunit in the apparent surface fraction (Fig. 2 A). As discussed in the companion article, we suggest this apparent emergence of the immature glycosylated species from the cell surface arises either from an artifact due to endocytosis of biotin during the assay, or from a small amount of the immature form of the α-subunit reaching the cell surface when the majority is trapped intracellularly by KCNE1. We speculate that it represents leakage arising from exceeding the storage capacity of the ER and Golgi because so much α-subunit accumulates in the ER and Golgi during this trapping.
Figure 2.
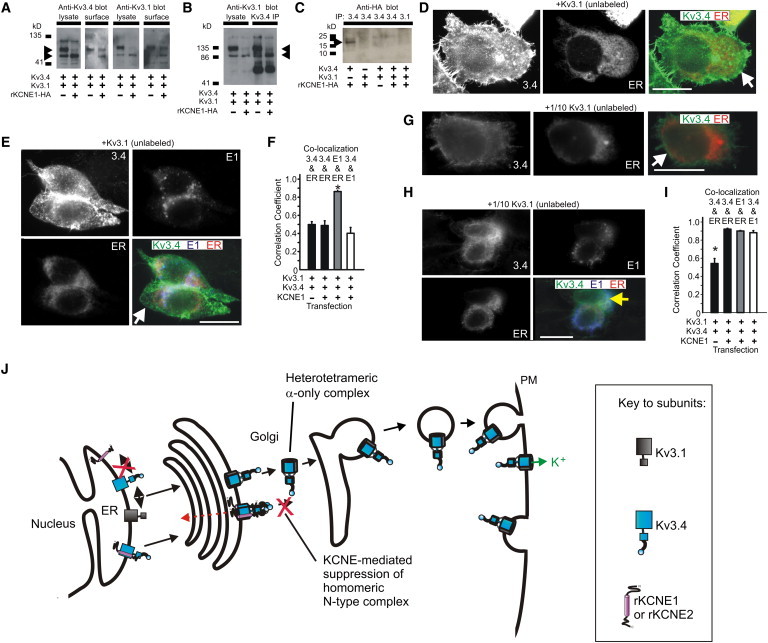
Kv3.1 and Kv3.4 form a bipartite surface-expressed complex lacking KCNE1. (A) Western blot, using anti-Kv3.4 antibody (left) or anti-Kv3.1 antibody (right), of cell lysates and avidin-biotin-purified surface fractions from CHO cells transfected with cDNA encoding Kv3.1 and Kv3.4 (equal amounts) and/or rKCNE1-HA (indicated by + or – symbols). (Arrows) Two observed molecular mass species of Kv3.4. (B) Western blot of CHO cell lysates after immunoprecipitation with anti-Kv3.4 antibody, showing Kv3.4 forms complexes with Kv3.1 (immunoblotted with anti-Kv3.1 antibody). Cells were transfected as indicated by the + or – symbols. (Arrows) Two observed molecular mass species of Kv3.1. (C) Western blot of CHO cell lysates after immunoprecipitation with anti-HA antibody, showing Kv3.4 forms complexes with rat KCNE1 only when Kv3.1 is not present. Cells were transfected with cDNA as indicated by the + or – symbols. (Arrow) HA-tagged KCNE1. (D) Immunofluorescence analysis of CHO cells transfected with cDNA encoding Kv3.1 (unlabeled) and Kv3.4 (green) (equal amounts), and fluorescent ER marker (red). Scale bars: 5 μm. Representative images, taken from at least five images per group, are shown. Single-wavelength images are shown in monochrome for clarity; the double-wavelength, merged image is shown in color. (White arrow) Kv3.4 at the cell surface. (E) Immunofluorescence analysis of CHO cells transfected with cDNA encoding Kv3.1 (unlabeled) and Kv3.4 (green) (equal amounts), rat KCNE1-HA (blue), and a fluorescent ER marker (red). Scale bars: 5 μm. Representative images, taken from at least five images per group, are shown. Single-wavelength images are shown in monochrome for clarity; the triple-wavelength, merged image is shown in color. (White arrow) Kv3.4 at the cell surface. (F) Quantification of colocalization from images as in panels D and E using Pearson's correlation coefficient, n = 5 cells per group, ∗ p < 0.05. (G and H) Immunofluorescence analysis of cotransfected with 100-ng Kv3.4 (green) cDNA and 10-ng Kv3.1 (unlabeled) cDNA, without (G) or with (H) 500-ng KCNE1 (blue) cDNA, and fluorescent ER marker (red) cDNA. (Insets) Individual color channels, main panels show merged view for assessment of colocalization. Scale bars: 5 μm. Representative images, taken from at least five images per group, are shown. Single-wavelength images are shown in monochrome for clarity; the double- and triple-wavelength, merged images are shown in color. (G, white arrow) Kv3.4 at the cell surface; (H, yellow arrow) colocalized Kv3.4 and KCNE1 in the ER (pale blue/white signal). (I) Quantification of colocalization from images as in panels G and H using Pearson's correlation coefficient, n = 5–11 cells per group, ∗ p < 0.05. (J) Model illustrating the KCNE checkpoint to ensure Kv3.4 α-subunits only reach the cell surface in mixed-α heteromers. As we show in our companion article, Kv3.4 (blue) is retained intracellularly by KCNE1 and KCNE2 (purple). Here, we show that Kv3.1 (gray) can rescue surface expression of Kv3.4, by forming heteromeric complexes, with KCNE1 and KCNE2 being excluded from these complexes.
Kv3.4 formed complexes with Kv3.1 regardless of KCNE1 coexpression (Fig. 2 B), whereas KCNE1 coassembled with Kv3.4 in the absence of Kv3.1, but not in the presence of Kv3.1 (Fig. 2 C). Immunofluorescence studies corroborated these findings: in cells cotransfected with equal amounts of Kv3.1 and Kv3.4 cDNA, Kv3.4 localized strongly at the plasma membrane, with little accumulation in the ER or Golgi, as indicated by Pearson's correlation coefficients for Kv3.4 with markers for either of these intracellular organelles of <0.5 (n = 5; Fig. 2 D; and see Fig. S1 in the Supporting Material). In cells coexpressing KCNE1 and equal amounts of Kv3.1 and Kv3.4 cDNA, Kv3.4 was still expressed at the plasma membrane, but KCNE1 localized almost exclusively intracellularly with the ER (Pearson's correlation coefficient: 0.86 ± 0.01; n = 5; Fig. 2, E and F).
Similarly, Kv3.4 and KCNE1 exhibited only weak colocalization in these complexes (Pearson's correlation coefficient: 0.40 ± 0.06, n = 5, Fig. 2, E and F; or less, see also Fig. S1 C). Thus, Kv3.1 prevents KCNE1-mediated intracellular retention (and resultant functional suppression) of Kv3.4 by formation of a Kv3.1-Kv3.4 complex that, unlike Kv3.1 or Kv3.4 homomers, appears not to coassemble with KCNE1. As suggested by electrophysiological data (Fig. 1, F–H), when Kv3.4 cDNA is cotransfected with Kv3.1 cDNA at a 10:1 ratio, Kv3.4 expression at the cell surface is reduced by KCNE1 cotransfection (Fig. 2, G and H), with a significant increase in the Pearson's correlation coefficient for Kv3.4 and the ER, when KCNE1 is coexpressed (p < 0.05; n = 5–11; Fig. 2 I). The proposed model is shown in Fig. 2 J.
Kv3.2 prevents KCNE1-mediated inhibition of Kv3.4, but Kv2.1 does not
We next tested whether interaction with Kv3.4 is required for a coexpressed α-subunit to prevent intracellular retention by KCNE1. Kv3.1 and Kv3.2 are markedly similar both in amino-acid identity and in the delayed rectifier currents they express in heterologous expression systems, with similar rapid activation and deactivation rates (19,23,27). Further, we previously found that KCNE1 modulates the expression of Kv3.2, similar to Kv3.1, slowing both its activation and deactivation (23). Therefore, we examined whether coexpression of Kv3.2 could also rescue Kv3.4 from KCNE1-mediated suppression. Currents produced by Kv3.2 alone were similar to those produced by Kv3.1 (Fig. 3, A and B), though lacking the initial fast transient component observed in Kv3.1 currents which is thought to arise from local extracellular potassium accumulation due to ultrarapid activation and high conductance (27–29). Coexpression of Kv3.2 and Kv3.4 resulted in right-shifting of the voltage-dependence of activation, and a reduction in current density, compared to Kv3.4 alone (Fig. 3, A and B). Importantly, as seen with Kv3.1 (Figs. 1 and 2), Kv3.2 also prevented KCNE1 inhibition of Kv3.4 current (Fig. 3, A and B) and surface expression, although there continued to be a relative increase in apparent surface expression of the less-glycosylated form of Kv3.4 with KCNE1 coexpression (Fig. 3 C), as observed with Kv3.1 coexpression experiments (Fig. 2, A and B).
Figure 3.
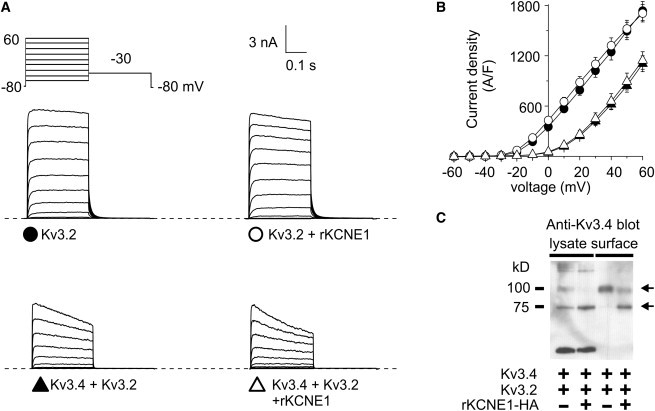
Kv3.2 prevents KCNE1-mediated suppression of Kv3.4. (A) Exemplar traces showing currents recorded in CHO cells cotransfected with cDNA encoding Kv3.2 alone or with rat KCNE1, or Kv3.4 and Kv3.2 alone or cotransfected with rat KCNE1, as indicated. (Inset) Voltage protocol. (B) Mean peak current density from CHO cells transfected with cDNA encoding Kv3.2 alone (n = 13) or with KCNE1 (n = 11), or Kv3.4 and Kv3.2 alone (n = 11) or with KCNE1 (n = 12); symbols as in panel A. (C) Western blot, using anti-Kv3.4 antibody, of cell lysates and avidin-biotin-purified surface fractions from CHO cells transfected with cDNA encoding Kv3.2 and Kv3.4 and/or rKCNE1-HA (indicated by + or – symbols). (Arrows) Two observed molecular mass species of Kv3.4.
Like Kv3.1 and Kv3.2, Kv2.1 can interact with KCNE1 (and KCNE2), with the altered gating characteristics instilled by KCNE1 (and KCNE2) indicating that Kv2.1-KCNE complexes form a functional channel at the cell surface (30). However, unlike Kv3.1 and Kv3.2, Kv2.1 is thought not to form complexes with Kv3.4, as the two α-subunits have different N-terminal A and B box (NAB) domains—specific sequence motifs that ensure only subfamily-specific heteromerization (10,11). Here, KCNE1 reduced Kv2.1 current density by 60% (p < 0.05; Fig. 4, A and B), recapitulating our previous finding (30). Immunofluorescence experiments revealed that KCNE1 altered Kv2.1 currents by partially inhibiting surface expression, as both Kv2.1 and KCNE1 colocalized significantly with the ER, although plasma membrane colocalization of Kv2.1 and KCNE1 was also observed (see Fig. S2).
Figure 4.
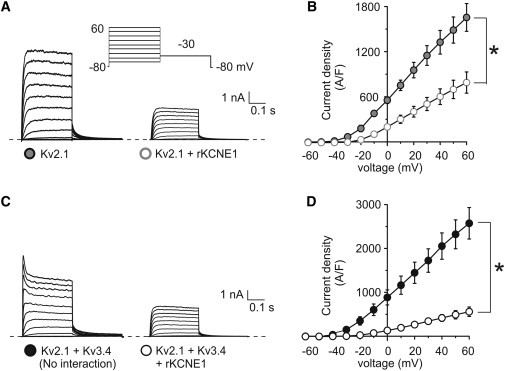
Kv2.1 does not prevent KCNE1-mediated suppression of Kv3.4. (A) Exemplar traces showing currents recorded in CHO cells cotransfected with cDNA encoding Kv2.1 alone or with rat KCNE1, as indicated. (Inset) Voltage protocol. (B) Mean peak current density from CHO cells transfected with cDNA encoding Kv2.1 alone (n = 12) or with KCNE1 (n = 18); symbols as in panel A. (C) Exemplar traces showing currents recorded from CHO cells cotransfected with cDNA encoding Kv2.1 and Kv3.4 alone or with rat KCNE1, as indicated. (Inset) Voltage protocol. (D) Mean peak current density from CHO cells cotransfected with cDNA encoding Kv2.1 and Kv3.4 alone (n = 14) or with KCNE1 (n = 18); symbols as in panel D. ∗ p < 0.05.
Given that KCNE1 appears not able to reach the cell surface alone, this provides additional evidence that Kv2.1 and KCNE1 form a cell-surface complex. Currents produced by coexpression of Kv2.1 and Kv3.4 were twice as large as those produced by either Kv2.1 or Kv3.4 alone, with gating characteristics and current density to be expected from simple addition of current traces from noninteracting homomers of Kv2.1 and Kv3.4 (Fig. 4, A–D). When KCNE1 was coexpressed with Kv2.1 and Kv3.4, the current density was reduced 2.5-fold (Fig. 4, C and D, leaving a current that did not contain an N-type inactivating component, but was instead identical to that produced by coexpression of Kv2.1 and KCNE1 (compare to Fig. 4 A). Therefore, Kv2.1 did not prevent KCNE1-mediated suppression of Kv3.4.
Prevention of KCNE1-mediated Kv3.4 suppression by a Kv1.1 chimera engineered to interact with Kv3.4
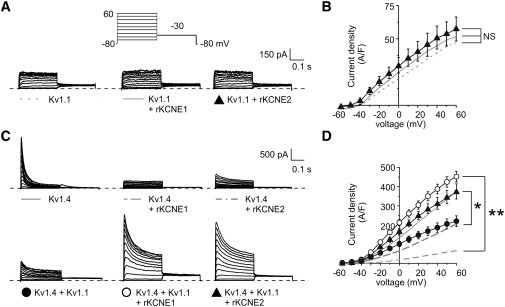
Unlike Kv2.1, Kv3.1, and Kv3.2, coexpression of the delayed rectifier α-subunit Kv1.1 with KCNE1 did not alter Kv1.1 current, suggesting against functional Kv1.1-KCNE1 interaction (Fig. 5, A and B). Kv1.1 is also reported not to interact with Kv3.4 due to incompatible NAB domains (10). Here, the current produced by coexpression of Kv1.1 and Kv3.4 exhibited gating characteristics and density to be expected from simple addition of current traces from Kv1.1 and Kv3.4 homomers, consistent with them not forming heteromers (Fig. 5, C and D). Coexpression of KCNE1 with Kv1.1 and Kv3.4 reduced these currents by 70% (Fig. 5, C and D), leaving a current that did not contain an N-type inactivating component, but rather was indistinguishable from that produced by coexpression of Kv1.1 and KCNE1, similar to the effects found with Kv2.1. Thus, as expected, Kv1.1 did not prevent Kv3.4 inhibition by KCNE1.
Figure 5.
Kv1.1 does not prevent KCNE1-mediated Kv3.4 suppression. (A) Exemplar traces showing currents recorded in CHO cells cotransfected with cDNA encoding Kv1.1 alone or with rat KCNE1, as indicated. (Inset) Voltage protocol. (B) Mean peak current density from CHO cells transfected with cDNA encoding Kv1.1 alone (n = 22) or with KCNE1 (n = 15); symbols as in panel A. (C) Exemplar traces showing currents recorded from CHO cells cotransfected with cDNA encoding Kv1.1 and Kv3.4 alone or with rat KCNE1, as indicated. (Inset) Voltage protocol. (D) Mean peak current density from CHO cells cotransfected with cDNA encoding Kv1.1 and Kv3.4 alone (n = 11) or with KCNE1 (n = 10); symbols as in panel D. ∗ p < 0.05.
Capitalizing on its lack of functional interaction with either KCNE1 or Kv3.4, we used Kv1.1 to test the hypothesis that interaction with Kv3.4 is required to prevent its inhibition by KCNE1. We replaced the Kv1.1 NAB domain with that of Kv3.1, generating a chimera we will refer to as Kv1.1-Kv3NAB (Fig. 6 A)—thus engineering a Kv1.1 α-subunit capable of interaction with Kv3.4. Kv1.1-Kv3NAB passed current comparable in amplitude to that of Kv3.1, with coexpression of KCNE1 producing no difference in currents (Fig. 6 B), similar to what we observed for wild-type Kv1.1 (Fig. 5, A and B), but unlike what we observed for wild-type Kv3.1 (Fig. 1, C and D). The increase in Kv1.1 current density upon endowing it with the Kv3.1 NAB domain may be explained by the previous report that the N-terminus of Kv1.1, removed here, decreases Kv1.1 protein stability (21).
Figure 6.
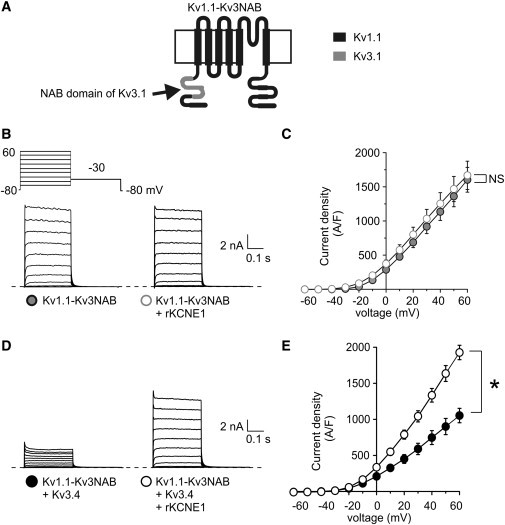
A Kv1.1 chimera engineered to interact with Kv3.4 prevents KCNE1-mediated Kv3.4 suppression. (A) Schematic showing membrane topology of Kv1.1-Kv3.1NAB, formed by swapping the NAB domain of Kv3.1 (gray) into Kv1.1 (black). (B) Exemplar traces showing currents recorded in CHO cells cotransfected with cDNA encoding Kv1.1-Kv3.1NAB alone or with rat KCNE1, as indicated. (Inset) Voltage protocol. (C) Mean peak current density from CHO cells transfected with cDNA encoding Kv1.1-Kv3.1NAB alone (n = 12) or with KCNE1 (n = 14); symbols as in panel B. (D) Exemplar traces showing currents recorded from CHO cells cotransfected with cDNA encoding Kv1.1-Kv3.1NAB and Kv3.4 alone or with rat KCNE1, as indicated. (Inset) Voltage protocol. (E) Mean peak current density from CHO cells cotransfected with cDNA encoding Kv1.1-Kv3.1NAB and Kv3.4 alone (n = 12) or with KCNE1 (n = 12); symbols as in panel D. ∗ p < 0.05.
Coexpression of the Kv1.1-Kv3NAB chimera with Kv3.4 significantly reduced Kv3.4 currents (Fig. 6, B–E), reminiscent of the effect of Kv1.1 on Kv1.4, whereby Kv1.1 acts in a dominant negative fashion to suppress Kv1.4 current (21). Strikingly, Kv1.1-Kv3NAB not only rescued Kv3.4 from KCNE1-mediated suppression, but the current resulting from coexpression of all three subunits was nearly twofold larger that that generated by coexpression of the α-subunits without KCNE1 (p < 0.05; Fig. 6, D and E). Thus, unlike wild-type Kv1.1, Kv1.1-Kv3NAB was able to prevent intracellular retention of Kv3.4 by KCNE1. Together with the findings for Kv3.1, Kv3.2, and Kv2.1, these findings strongly suggest that interaction with Kv3.4 is required for this rescue.
Wild-type Kv1.1 rescues Kv1.4 from KCNE1- and KCNE2-mediated suppression
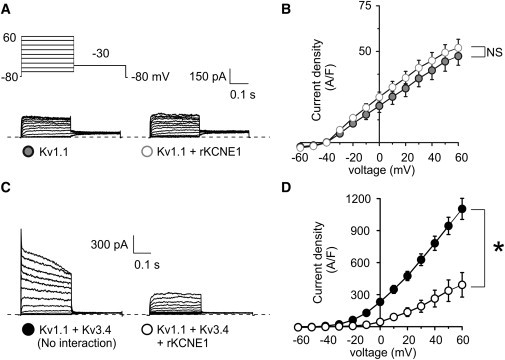
Given that Kv1.1-Kv3NAB rescued Kv3.4 from KCNE1-mediated intracellular sequestration, we next examined whether wild-type Kv1.1 could rescue Kv1.4 from KCNE1- and KCNE2-mediated suppression. KCNE1 and KCNE2 each had negligible effects on Kv1.1 current (Fig. 7, A and B), in contrast to their inhibitory effects on Kv1.4 current (Fig. 7, C and D). Coexpression of Kv1.1 and Kv1.4 produced currents that were of ∼40% lower density than homomeric Kv1.4 current, similar to those produced by coexpression of Kv1.4 and KCNE2 (Fig. 7, C and D); this can be credited to the known inhibitory effect of Kv1.1 on Kv1.4 surface expression (21,31).
Figure 7.
Kv1.1 rescues Kv1.4 currents from KCNE1- and KCNE2-mediated suppression, and vice versa. (A) Exemplar traces showing currents recorded in CHO cells transfected with cDNA encoding Kv1.1 alone or with rat KCNE1 or KCNE2 as indicated. Voltage protocol inset (shaded lines indicate data shown previously in Fig. 5). (B) Mean peak current density from CHO cells transfected with cDNA encoding Kv1.1 alone (n = 22) or with KCNE1 (n = 15) or KCNE2 (n = 10); symbols as in panel A. (C) Exemplar traces showing currents recorded in CHO cells transfected with cDNA encoding Kv1.4 alone or with rat KCNE1 or KCNE2; or Kv1.4 and Kv1.1 alone or with rat KCNE1 or KCNE2, as indicated. (Inset) Voltage protocol. (Shaded lines) Data shown previously in our companion article. (D) Mean peak current density from CHO cells transfected with cDNA encoding Kv1.4 alone (n = 20) or with KCNE1 (n = 18) or KCNE2 (n = 12); or Kv1.4 and Kv1.1 alone (n = 18) or with KCNE1 (n = 11) or KCNE2 (n = 14); symbols as in panel C. ∗ p < 0.05; ∗∗ p < 0.001.
Strikingly, KCNE1 and KCNE2 each significantly increased Kv1.1-Kv1.4 current to a level equivalent to that observed for Kv1.4 when expressed alone (KCNE1, p < 0.001; KCNE2 p < 0.05; Fig. 7, C and D). Yet the current displayed the slower inactivation characteristic of Kv1.1-Kv1.4 heteromers (Fig. 7 C). These data suggested that Kv1.1 prevents suppression of Kv1.4 by KCNE subunits, and also that KCNE1 and KCNE2 prevent suppression of Kv1.4 by Kv1.1. This reciprocal effect may indicate some cellular quality control mechanism ensuring tripartite, Kv1.1-Kv1.4-KCNE complexes prevail at the cell surface, but this would be in contrast to our findings for Kv3.1-Kv3.4 complexes, which exclude KCNE1 and KCNE2 (Fig. 2).
Immunofluorescence microscopy showed that in cells coexpressing Kv1.1 and Kv1.4, Kv1.4 localized significantly with the ER, with relatively inefficient surface expression (Pearson's correlation coefficient for Kv1.4 and the ER marker: 0.91 ± 0.03, n = 5; Fig. 8, A and C), as previously reported (21). Coexpression of either KCNE1 or KCNE2 with Kv1.4 and Kv1.1 resulted in KCNE-Kv1.4 colocalization in a punctate pattern both within the cell and at the cell periphery (Fig. 8, B and D). This is in contrast both to the effects on Kv1.4 of KCNE1 or KCNE2 coexpression (intracellular retention of Kv1.4; see companion article and Fig. 4, this article), and to the effects of Kv3.1, Kv3.4, and KCNE1 coexpression (forward-trafficked Kv3.1-Kv3.4 complexes leaving KCNE1 behind; see Fig. 2 E). In cells expressing Kv1.1 and Kv1.4, coexpression of either KCNE1 or KCNE2 produced a subtle but statistically significant reduction in the Pearson's correlation coefficient between Kv1.4 and the ER marker (p < 0.05), suggesting somewhat more efficient forward trafficking of Kv1.1-Kv1.4 when coexpressed with KCNE1 or KCNE2 (Fig. 8, C and E).
Figure 8.
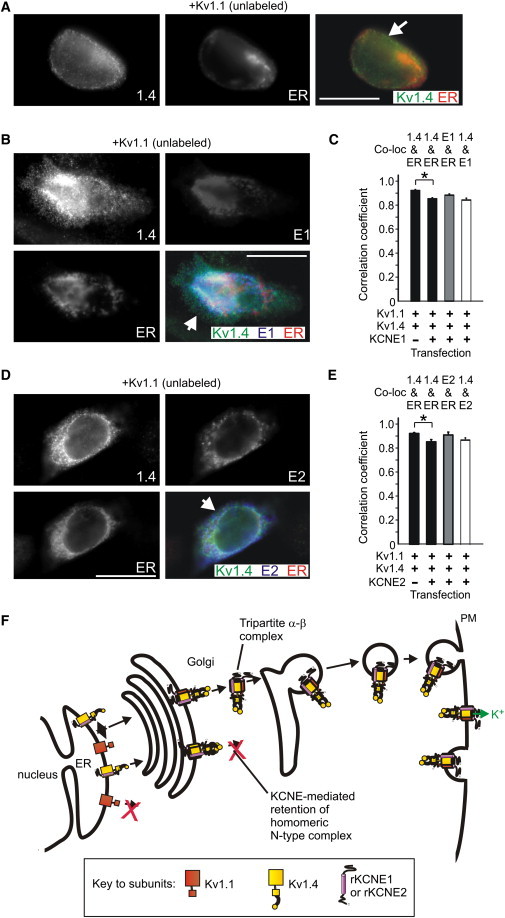
Kv1.1 reduces KCNE1- and KCNE2-mediated intracellular sequestration of Kv1.4, and vice versa. (A) Exemplar IF colabeling of cells transfected with cDNA encoding Kv1.1 (unlabeled), Kv1.4 (green) and a fluorescent ER marker (red). Representative images, taken from at least five images per group, are shown. Single-wavelength images are shown in monochrome for clarity; the double-wavelength, merged image is shown in color. (White arrow) Kv1.4 at the cell surface (green). (B) Exemplar IF colabeling of cells transfected with cDNA encoding Kv1.1 (unlabeled), Kv1.4 (green), rat KCNE1-HA (blue), and a fluorescent ER marker (red). Representative images, taken from at least five images per group, are shown. Single-wavelength images are shown in monochrome for clarity; the triple-wavelength, merged image is shown in color. (White arrow) Kv1.4 colocalizing with KCNE1 at the cell surface (aquamarine signal). (C) Quantification of colocalization from images as in panels A and B using Pearson's correlation coefficient, n = 5 cells per group, ∗ p < 0.05. (D) Exemplar IF colabeling of cells transfected with cDNA encoding Kv1.1 (unlabeled), Kv1.4 (green), rat KCNE2-HA (blue), and a fluorescent ER marker (red). Scale bar: 5 μm. Representative images, taken from at least five images per group, are shown. Single-wavelength images are shown in monochrome for clarity; the triple-wavelength, merged image is shown in color. (White arrow) Kv1.4 colocalizing with KCNE2 at the cell surface (aquamarine signal). (E) Quantification of colocalization from images as in panels A and D using Pearson's correlation coefficient, n = 5 cells per group, ∗ p < 0.05. (F) Proposed mechanism of tripartite complex formation favoring surface expression of Kv1.1-Kv1.4 α-subunit heteromers also containing KCNE1 or KCNE2. As we show in our companion article, Kv1.4 (yellow) is retained intracellularly by KCNE1 and KCNE2 (purple). Further, Kv1.4 is also retained intracellularly by Kv1.1 (orange) (31,32). Here, we show that Kv1.1 can rescue surface expression of Kv1.4, by forming tripartite complexes with KCNE1/2 and Kv1.4. This differs from the rescue of Kv3.4 from KCNE-mediated suppression by Kv3.1 by bipartite complexes, where KCNE1/2 are excluded from the complexes (Fig. 2J).
In addition, both KCNE1 and KCNE2 significantly colocalized with Kv1.4 in the presence of Kv1.1, with Pearson's correlation coefficients >0.85 (n = 5; Fig. 8, C and E). As with the functional data (Fig. 7), the immunofluorescence data suggest that Kv1.1 can rescue Kv1.4 from KCNE1- and KCNE2-mediated intracellular trapping. Furthermore, the findings indicate that a tripartite complex containing Kv1.1, Kv1.4, and either KCNE1 or KCNE2, is more efficiently forward-trafficked than a bipartite complex containing Kv1.1 and Kv1.4. This differs from what we observed with Kv3.1-Kv3.4 heteromers, which left KCNE1 or KCNE2 behind as they trafficked to the cell surface (Fig. 2). These data are represented in the model in Fig. 8 F, in the context of previous findings from other groups. In the model, Kv1.1 is shown to progress poorly from the ER, whereas in the absence of Kv1.1 or KCNEs, homomeric Kv1.4 can progress relatively efficiently. KCNE subunits prevent forward trafficking of homomeric Kv1.4 channels, whereas Kv1.1-Kv1.4 heteromers form tripartite complexes with KCNE subunits and traffic to the cell surface.
Discussion
The original findings, two decades ago, that different Kv α-subunits could form intra-subfamily heteromeric complexes, pertained to Drosophila Shaker A and B, and mammalian Kv1.1 (RCK1, KCNA1) and Kv1.4 (RCK4, KCNA4) (16,17). Heteromeric Kv1.1-Kv1.4 complexes have previously been found in mammalian brain, in hippocampal neurons (32). We found that heteromeric Kv1.1-Kv1.4 current was significantly lower than homomeric Kv1.4 current, but that KCNE1 and KCNE2 increased Kv1.1-Kv1.4 current to a level similar to that of homomeric Kv1.4, while significantly suppressing homomeric Kv1.4 current in the absence of Kv1.1. Multiple laboratories have examined the relatively inefficient expression of heteromeric Kv1.1-Kv1.4 complexes in vitro, finding that Kv1.1 promotes ER retention of the complex (21,31). In contrast, the cytoplasmic β-subunit Kvβ2 has been shown to increase the surface expression of Kv1.4 in vitro (21,31).
Though the mechanisms behind the effects of Kvβ2 on Kv1.4 are incompletely understood, it is known that Kvβ2 promotes the stability and surface expression of Kv1.2 by masking retention signals (33). Recently, KCNRG, an ER-associated potassium channel regulatory protein, was found to interact with both Kv1.1 and Kv1.4, regulating surface expression by retaining both subunits intracellularly (34). Our findings differ in that KCNE1 and KCNE2 regulate Kv1 surface expression by promoting mixed-α complexes.
Similar to Kv1.1-Kv1.4, heteromeric Kv3.1-Kv3.4 complexes have been observed in the hippocampus (7), a region in which KCNE1 and KCNE2 are also expressed (35,36). Interestingly, reported N-type inactivation rates of currents generated by Kv3.1 and Kv3.4 coexpression vary depending upon both expression system and cDNA (or cRNA) ratio (7,18,19). We find relatively slow N-type inactivation expressed in CHO cells transfected with equal amounts of Kv3.1 and Kv3.4 cDNA. We attribute this to constitutive protein kinase C activity in these cells, based on our previous studies of Kv3.4 expressed in CHO cells (37), and the finding that PKC phosphorylation of serine residues within the Kv3.4 inactivation ball domain impairs and slows inactivation (38).
Our findings here and previous reports together suggest that a host of potential α−α and α−β interactions differentially dictate the posttranslational diaspora of Kv channel subunits, governed by rules we are yet to fully comprehend. KCNE1 and KCNE2 each trap Kv3.4 early in the secretory pathway and form functionally distinct surface-expressed complexes with Kv3.1, yet appear unable to interact with Kv3.1-Kv3.4 heteromers, affording the latter seemingly unhindered progress to the cell surface. However, this may be an oversimplification—although not reducing Kv3.1-Kv3.4 current density, KCNE1 coexpression alters the glycosylation of both Kv3.1 and Kv3.4 detected in cell surface Kv3.1-Kv3.4 heteromers (Fig. 2), and the same is observed for Kv3.2-Kv3.4 heteromers (Fig. 3).
This hints at an alternative maturation process for Kv3.1-Kv3.4 and Kv3.2-Kv3.4 complexes when coexpressed with KCNE1, despite the latter being excluded from these complexes. This exclusion is in itself enigmatic—the ability of Kv3.1-Kv3.4 to shrug off KCNE1, whereas Kv3.1 and Kv3.4 homomers cannot, suggests that asymmetries are generated upon α-subunit heteromerization that disrupt α-KCNE binding sites, adding another dimension to the tangled web that is the Kv channel subunit interactome.
In summary, formation of a heteromeric complex with intra-subfamily delayed-rectifier α-subunits prevents the N-type α-subunits Kv3.4 and Kv1.4 from being intracellularly sequestered by KCNE1 and KCNE2. This introduces what we believe to be a novel mechanism governing plasma membrane channel composition, in which KCNE1 and KCNE2 form an intracellular checkpoint preventing homomeric N-type Kv channels forming at the cell surface. This finding, together with reports that KCNE1, KCNE2, Kv1, and Kv3 subunits are expressed in multiple, overlapping regions of the brain (35,36), provides further potential mechanisms by which the remarkable versatility of KCNE subunits could augment K+ channel diversity in vivo.
Acknowledgments
We are grateful to C. Polizoto for critical reading of the article, and Drs. G. Kreitzer and R. Levi for helpful suggestions.
This work was supported by HL079275 and HL101190 from the National Institutes of Health/National, Heart, Lung, and Blood Institute to G.W.A., who is the recipient of an Irma T. Hirschl Career Scientist Award.
Footnotes
Anthony Lewis' present address is School of Pharmacy and Biomedical Sciences, University of Portsmouth, Portsmouth, UK.
Supporting Material
References
- 1.Coetzee W.A., Amarillo Y., Rudy B. Molecular diversity of K+ channels. Ann. N. Y. Acad. Sci. 1999;868:233–285. doi: 10.1111/j.1749-6632.1999.tb11293.x. [DOI] [PubMed] [Google Scholar]
- 2.Deutsch C. Potassium channel ontogeny. Annu. Rev. Physiol. 2002;64:19–46. doi: 10.1146/annurev.physiol.64.081501.155934. [DOI] [PubMed] [Google Scholar]
- 3.Mathie A., Wooltorton J.R., Watkins C.S. Voltage-activated potassium channels in mammalian neurons and their block by novel pharmacological agents. Gen. Pharmacol. 1998;30:13–24. doi: 10.1016/s0306-3623(97)00034-7. [DOI] [PubMed] [Google Scholar]
- 4.Lien C.C., Jonas P. Kv3 potassium conductance is necessary and kinetically optimized for high-frequency action potential generation in hippocampal interneurons. J. Neurosci. 2003;23:2058–2068. doi: 10.1523/JNEUROSCI.23-06-02058.2003. [DOI] [PMC free article] [PubMed] [Google Scholar]
- 5.Connor J.A., Stevens C.F. Voltage clamp studies of a transient outward membrane current in gastropod neural somata. J. Physiol. 1971;213:21–30. doi: 10.1113/jphysiol.1971.sp009365. [DOI] [PMC free article] [PubMed] [Google Scholar]
- 6.Connor J.A., Stevens C.F. Prediction of repetitive firing behavior from voltage clamp data on an isolated neurone soma. J. Physiol. 1971;213:31–53. doi: 10.1113/jphysiol.1971.sp009366. [DOI] [PMC free article] [PubMed] [Google Scholar]
- 7.Baranauskas G., Tkatch T., Surmeier D.J. Kv3.4 subunits enhance the repolarizing efficiency of Kv3.1 channels in fast-spiking neurons. Nat. Neurosci. 2003;6:258–266. doi: 10.1038/nn1019. [DOI] [PubMed] [Google Scholar]
- 8.Hoshi T., Zagotta W.N., Aldrich R.W. Biophysical and molecular mechanisms of Shaker potassium channel inactivation. Science. 1990;250:533–538. doi: 10.1126/science.2122519. [DOI] [PubMed] [Google Scholar]
- 9.Aldrich R.W., Hoshi T., Zagotta W.N. Differences in gating among amino-terminal variants of Shaker potassium channels. Cold Spring Harb. Symp. Quant. Biol. 1990;55:19–27. doi: 10.1101/sqb.1990.055.01.005. [DOI] [PubMed] [Google Scholar]
- 10.Xu J., Yu W., Li M. Assembly of voltage-gated potassium channels. Conserved hydrophilic motifs determine subfamily-specific interactions between the α-subunits. J. Biol. Chem. 1995;270:24761–24768. doi: 10.1074/jbc.270.42.24761. [DOI] [PubMed] [Google Scholar]
- 11.Papazian D.M. Potassium channels: some assembly required. Neuron. 1999;23:7–10. doi: 10.1016/s0896-6273(00)80746-1. [DOI] [PubMed] [Google Scholar]
- 12.Scott V.E., Muniz Z.M., Dolly J.O. Antibodies specific for distinct Kv subunits unveil a heterooligomeric basis for subtypes of α-dendrotoxin-sensitive K+ channels in bovine brain. Biochemistry. 1994;33:1617–1623. doi: 10.1021/bi00173a001. [DOI] [PubMed] [Google Scholar]
- 13.Wang H., Kunkel D.D., Tempel B.L. Localization of Kv1.1 and Kv1.2, two K channel proteins, to synaptic terminals, somata, and dendrites in the mouse brain. J. Neurosci. 1994;14:4588–4599. doi: 10.1523/JNEUROSCI.14-08-04588.1994. [DOI] [PMC free article] [PubMed] [Google Scholar]
- 14.Rhodes K.J., Strassle B.W., Trimmer J.S. Association and colocalization of the Kvβ1 and Kvβ2 β-subunits with Kv1 α-subunits in mammalian brain K+ channel complexes. J. Neurosci. 1997;17:8246–8258. doi: 10.1523/JNEUROSCI.17-21-08246.1997. [DOI] [PMC free article] [PubMed] [Google Scholar]
- 15.Coleman S.K., Newcombe J., Dolly J.O. Subunit composition of Kv1 channels in human CNS. J. Neurochem. 1999;73:849–858. doi: 10.1046/j.1471-4159.1999.0730849.x. [DOI] [PubMed] [Google Scholar]
- 16.Ruppersberg J.P., Schröter K.H., Pongs O. Heteromultimeric channels formed by rat brain potassium-channel proteins. Nature. 1990;345:535–537. doi: 10.1038/345535a0. [DOI] [PubMed] [Google Scholar]
- 17.Isacoff E.Y., Jan Y.N., Jan L.Y. Evidence for the formation of heteromultimeric potassium channels in Xenopus oocytes. Nature. 1990;345:530–534. doi: 10.1038/345530a0. [DOI] [PubMed] [Google Scholar]
- 18.Weiser M., Vega-Saenz de Miera E., Rudy B. Differential expression of Shaw-related K+ channels in the rat central nervous system. J. Neurosci. 1994;14:949–972. doi: 10.1523/JNEUROSCI.14-03-00949.1994. [DOI] [PMC free article] [PubMed] [Google Scholar]
- 19.Rudy B., McBain C.J. Kv3 channels: voltage-gated K+ channels designed for high-frequency repetitive firing. Trends Neurosci. 2001;24:517–526. doi: 10.1016/s0166-2236(00)01892-0. [DOI] [PubMed] [Google Scholar]
- 20.MacKinnon R., Aldrich R.W., Lee A.W. Functional stoichiometry of Shaker potassium channel inactivation. Science. 1993;262:757–759. doi: 10.1126/science.7694359. [DOI] [PubMed] [Google Scholar]
- 21.Zhu J., Watanabe I., Thornhill W.B. Heteromeric Kv1 potassium channel expression: amino acid determinants involved in processing and trafficking to the cell surface. J. Biol. Chem. 2003;278:25558–25567. doi: 10.1074/jbc.M207984200. [DOI] [PubMed] [Google Scholar]
- 22.Abbott G.W., Butler M.H., Goldstein S.A. MiRP2 forms potassium channels in skeletal muscle with Kv3.4 and is associated with periodic paralysis. Cell. 2001;104:217–231. doi: 10.1016/s0092-8674(01)00207-0. [DOI] [PubMed] [Google Scholar]
- 23.Lewis A., McCrossan Z.A., Abbott G.W. MinK, MiRP1, and MiRP2 diversify Kv3.1 and Kv3.2 potassium channel gating. J. Biol. Chem. 2004;279:7884–7892. doi: 10.1074/jbc.M310501200. [DOI] [PubMed] [Google Scholar]
- 24.McCrossan Z.A., Lewis A., Abbott G.W. MinK-related peptide 2 modulates Kv2.1 and Kv3.1 potassium channels in mammalian brain. J. Neurosci. 2003;23:8077–8091. doi: 10.1523/JNEUROSCI.23-22-08077.2003. [DOI] [PMC free article] [PubMed] [Google Scholar]
- 25.Li Q., Lau A., Stanley E.F. A syntaxin 1, Gα(o), and N-type calcium channel complex at a presynaptic nerve terminal: analysis by quantitative immunocolocalization. J. Neurosci. 2004;24:4070–4081. doi: 10.1523/JNEUROSCI.0346-04.2004. [DOI] [PMC free article] [PubMed] [Google Scholar]
- 26.Nakamura R.L., Anderson J.A., Gaber R.F. Determination of key structural requirements of a K+ channel pore. J. Biol. Chem. 1997;272:1011–1018. doi: 10.1074/jbc.272.2.1011. [DOI] [PubMed] [Google Scholar]
- 27.Rudy B., Chow A., Vega-Saenz de Miera E. Contributions of Kv3 channels to neuronal excitability. Ann. N. Y. Acad. Sci. 1999;868:304–343. doi: 10.1111/j.1749-6632.1999.tb11295.x. [DOI] [PubMed] [Google Scholar]
- 28.Macica C.M., von Hehn C.A., Kaczmarek L.K. Modulation of the Kv3.1b potassium channel isoform adjusts the fidelity of the firing pattern of auditory neurons. J. Neurosci. 2003;23:1133–1141. doi: 10.1523/JNEUROSCI.23-04-01133.2003. [DOI] [PMC free article] [PubMed] [Google Scholar]
- 29.Kanemasa T., Gan L., Kaczmarek L.K. Electrophysiological and pharmacological characterization of a mammalian Shaw channel expressed in NIH 3T3 fibroblasts. J. Neurophysiol. 1995;74:207–217. doi: 10.1152/jn.1995.74.1.207. [DOI] [PubMed] [Google Scholar]
- 30.McCrossan Z.A., Roepke T.K., Abbott G.W. Regulation of the Kv2.1 potassium channel by MinK and MiRP1. J. Membr. Biol. 2009;228:1–14. doi: 10.1007/s00232-009-9154-8. [DOI] [PMC free article] [PubMed] [Google Scholar]
- 31.Manganas L.N., Trimmer J.S. Subunit composition determines Kv1 potassium channel surface expression. J. Biol. Chem. 2000;275:29685–29693. doi: 10.1074/jbc.M005010200. [DOI] [PubMed] [Google Scholar]
- 32.Zhu J., Watanabe I., Thornhill W.B. Trafficking of Kv1.4 potassium channels: interdependence of a pore region determinant and a cytoplasmic C-terminal VXXSL determinant in regulating cell-surface trafficking. Biochem. J. 2003;375:761–768. doi: 10.1042/BJ20030885. [DOI] [PMC free article] [PubMed] [Google Scholar]
- 33.Shi G., Nakahira K., Trimmer J.S. Beta subunits promote K+ channel surface expression through effects early in biosynthesis. Neuron. 1996;16:843–852. doi: 10.1016/s0896-6273(00)80104-x. [DOI] [PubMed] [Google Scholar]
- 34.Usman H., Mathew M.K. Potassium channel regulator KCNRG regulates surface expression of Shaker-type potassium channels. Biochem. Biophys. Res. Commun. 2010;391:1301–1305. doi: 10.1016/j.bbrc.2009.11.143. [DOI] [PubMed] [Google Scholar]
- 35.Goldman A.M., Glasscock E., Noebels J.L. Arrhythmia in heart and brain: KCNQ1 mutations link epilepsy and sudden unexplained death. Sci. Transl. Med. 2009;1 doi: 10.1126/scitranslmed.3000289. 2ra6. [DOI] [PMC free article] [PubMed] [Google Scholar]
- 36.Tinel N., Diochot S., Borsotto M. M-type KCNQ2-KCNQ3 potassium channels are modulated by the KCNE2 subunit. FEBS Lett. 2000;480:137–141. doi: 10.1016/s0014-5793(00)01918-9. [DOI] [PubMed] [Google Scholar]
- 37.Abbott G.W., Butler M.H., Goldstein S.A. Phosphorylation and protonation of neighboring MiRP2 sites: function and pathophysiology of MiRP2-Kv3.4 potassium channels in periodic paralysis. FASEB J. 2006;20:293–301. doi: 10.1096/fj.05-5070com. [DOI] [PubMed] [Google Scholar]
- 38.Beck E.J., Sorensen R.G., Covarrubias M. Interactions between multiple phosphorylation sites in the inactivation particle of a K+ channel. Insights into the molecular mechanism of protein kinase C action. J. Gen. Physiol. 1998;112:71–84. doi: 10.1085/jgp.112.1.71. [DOI] [PMC free article] [PubMed] [Google Scholar]
Associated Data
This section collects any data citations, data availability statements, or supplementary materials included in this article.