Abstract
OBJECTIVE
Sarco-endoplasmic reticulum Ca2+-ATPase 2b (SERCA2b) and SERCA3 pump Ca2+ in the endoplasmic reticulum (ER) of pancreatic β-cells. We studied their role in the control of the free ER Ca2+ concentration ([Ca2+]ER) and the role of SERCA3 in the control of insulin secretion and ER stress.
RESEARCH DESIGN AND METHODS
β-Cell [Ca2+]ER of SERCA3+/+ and SERCA3−/− mice was monitored with an adenovirus encoding the low Ca2+-affinity sensor D4 addressed to the ER (D4ER) under the control of the insulin promoter. Free cytosolic Ca2+ concentration ([Ca2+]c) and [Ca2+]ER were simultaneously recorded. Insulin secretion and mRNA levels of ER stress genes were studied.
RESULTS
Glucose elicited synchronized [Ca2+]ER and [Ca2+]c oscillations. [Ca2+]ER oscillations were smaller in SERCA3−/− than in SERCA3+/+ β-cells. Stimulating cell metabolism with various [glucose] in the presence of diazoxide induced a similar dose-dependent [Ca2+]ER rise in SERCA3+/+ and SERCA3−/− β-cells. In a Ca2+-free medium, glucose moderately raised [Ca2+]ER from a highly buffered cytosolic Ca2+ pool. Increasing [Ca2+]c with high [K] elicited a [Ca2+]ER rise that was larger but more transient in SERCA3+/+ than SERCA3−/− β-cells because of the activation of a Ca2+ release from the ER in SERCA3+/+ β-cells. Glucose-induced insulin release was larger in SERCA3−/− than SERCA3+/+ islets. SERCA3 ablation did not induce ER stress.
CONCLUSIONS
[Ca2+]c and [Ca2+]ER oscillate in phase in response to glucose. Upon [Ca2+]c increase, Ca2+ is taken up by SERCA2b and SERCA3. Strong Ca2+ influx triggers a Ca2+ release from the ER that depends on SERCA3. SERCA3 deficiency neither impairs Ca2+ uptake by the ER upon cell metabolism acceleration and insulin release nor induces ER stress.
Pancreatic β-cells stimulated by glucose display oscillations of the free cytosolic Ca2+ concentration ([Ca2+]c) resulting from intermittent Ca2+ influx (1,2). Their endoplasmic reticulum (ER) takes up cytosolic Ca2+ by two sarco-endoplasmic reticulum Ca2+-ATPases (SERCAs): SERCA2b, ubiquitously expressed, and SERCA3, expressed only in islet β-cells (3,4). The role played by the ER in the [Ca2+]c response to glucose is unclear. In particular, it has been suggested that Ca2+ influx through voltage-dependent Ca2+ channels facilitates the uptake of Ca2+ by the ER (5–10) or, on the contrary, triggers a release of Ca2+ from the ER (11–14), which might contribute to glucose-induced [Ca2+]c oscillations (11,14) or to a sustained and pronounced [Ca2+]c rise (12,13).
The method of choice to monitor the free ER Ca2+ concentration ([Ca2+]ER) in living cells uses genetically encoded, Ca2+-sensitive probes targeted to the organelle (15,16). One of them, D1ER, a ratiometric Ca2+ indicator, has been used in several cell types (17,18). However, the D1 Ca2+ sensor has a relatively high affinity for Ca2+ (60 µmol/L) (19). To yield a more suitable probe to monitor higher [Ca2+]ER, we replaced D1 by D4 that has a lower affinity for Ca2+ (195 µmol/L) (20), and expressed it under the control of the insulin promoter in clusters of β-cells. In most experiments, [Ca2+]ER (D4ER) and [Ca2+]c (FuraPE3) were simultaneously recorded to evaluate the interplay between both parameters. Because SERCA2b and SERCA3 have been suggested to play distinct roles (4,5), we evaluated their respective roles on [Ca2+]c and [Ca2+]ER by using β-cells from wild-type (SERCA3+/+, expressing SERCA2b and SERCA3) and SERCA3 knockout mice (SERCA3−/−, expressing SERCA2b only) (21). We also assessed the role of SERCA3 in glucose tolerance, insulin secretion, and ER stress, as it was found that missense mutations of the human SERCA3 gene are associated with type 2 diabetes (22), SERCA3 expression is reduced in diabetic rat models (23), and SERCA3 is involved in ER stress (24).
RESEARCH DESIGN AND METHODS
D4ER engineering and adenovirus generation.
To measure [Ca2+]ER in β-cells, we constructed an adenovirus encoding D4ER under the control of the rat insulin promoter. Therefore, pCDNA3D1ER (a gift from A.E. Palmer, University of Colorado, Boulder, CO) (16,19) was digested with HindIII and EcoRI to release D1ER which was subcloned into HindIII and EcoRI sites of pCS2+ plasmid (pCS2+D1ER). To replace the Ca2+ binding domain D1 by D4, the pBadD4 plasmid (a gift from A.E. Palmer) (20) was first digested with BamHI and EcoRI. This digestion released a fragment containing a single cut with SphI, which was then subsequently digested with SphI and SacI. In parallel, the D1 domain was removed from the pCS2+D1ER plasmid by digestion with SphI and SacI and was replaced by the D4 fragment (pCS2+D4ER plasmid). The cDNA sequence of D4ER was then placed after the sequences of the rat insulin promoter and the rabbit β-globin1 intron (RIP-BGL) into a pShuttle (pShuttleRIP-BGL-D4ER). Recombination with pAdEasy-1 and viral amplification were then performed as previously reported (25).
Solutions and preparations.
The study was approved by our local Commission d’Ethique. Islets were obtained by collagenase digestion of the pancreas of SERCA3 knockout (SERCA3−/−) mice (21) or their control homozygous C57BL/6J wild-type littermates (SERCA3+/+). Isolated cells and clusters of cells were cultured in RPMI 1640 medium containing 10 mmol/L glucose. After overnight culture, cells were infected with the D4ER adenovirus, and experiments were performed 2 days after.
The medium used for [Ca2+]c, [Ca2+]ER, and insulin secretion experiments contained (in mmol/L) 120 NaCl, 4.8 KCl, 2.5 CaCl2, 1.2 MgCl2, 24 NaHCO3, 1 mg/mL BSA, and various glucose concentrations and test agents (all from Sigma, St. Louis, MO) as indicated. Ca2+-free solutions were supplemented with 0.5 mmol/L EGTA.
Immunocytochemistry.
Cells were immunostained for insulin and glucagon as previously described (26).
[Ca2+]ER and [Ca2+]c measurements.
[Ca2+]ER and [Ca2+]c measurements were performed at 37°C with a 40× objective and a Quantem camera (Roper Scientific Inc., Trenton, NJ). [Ca2+]ER was measured every 3–4 s by exciting D4ER at 435 nm and recording the emitted light at 540 and 475 nm. We tried to calibrate the signal by treating the cells with the Ca2+ ionophore ionomycin or by permeabilization with α-toxin or digitonin in an attempt to determine maximal and minimal fluorescence ratios, but the probe washed out slightly, and the maximal achievable ratio at saturating [Ca2+] was always lower than that found at high glucose in intact cells. Therefore, all [Ca2+]ER changes are expressed as ratios (540/475).
When [Ca2+]ER and [Ca2+]c were simultaneously recorded, cells were loaded for 13–15 min with 100 nmol/L FuraPE3/AM (Sigma) at 37°C and excited at 340 and 380 nm while the emitted light was recorded at 510 nm.
Glucose tolerance test and insulin secretion experiments.
After a 6-h fast, an intraperitoneal glucose tolerance test was performed by injecting 2.4 mg of glucose (20% [w/v] solution) per gram of body weight. Insulin secretion was measured using batches of 25–30 perifused islets and assayed using a radioimmunoassay (4).
Measurement of islet gene mRNA levels.
After islet total RNA extraction and reverse transcription, Xbp1 mRNA splicing and relative changes in islet gene mRNA levels were measured as previously described (27).
Statistical analysis.
Experiments have been repeated with cells of at least three different cultures. The statistical significance between means was assessed by unpaired Student t test, or by ANOVA followed by Newman-Keuls or Bonferroni test.
RESULTS
D4ER is expressed in the ER of β-cells and reports [Ca2+]ER changes.
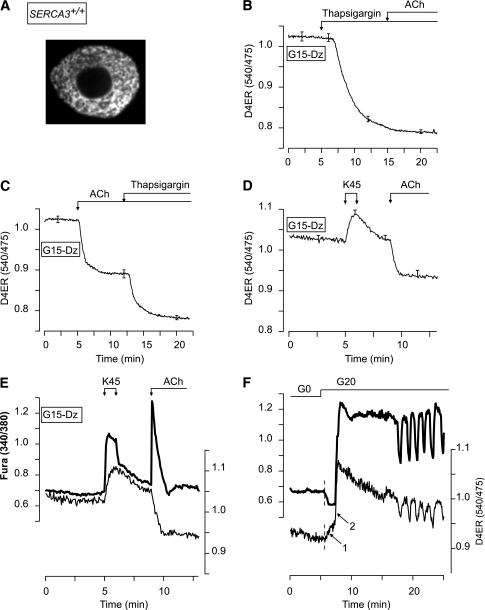
All D4ER-positive dispersed islet cells (119/119) were immunoreactive for insulin (not shown). The efficiency of β-cell infection was 70% (128/182), and none of the D4ER-positive cells was immunostained for glucagon (n = 101 cells). Confocal microscopy showed that D4ER was excluded from the nucleus but localized in a tubular network in the cytoplasm and around the nucleus (Fig. 1A). This distribution is specific for the ER (19).
FIG. 1.
Validation of D4ER as a reporter of [Ca2+]ER changes and of combined measurements of [Ca2+]c and [Ca2+]ER. A: Confocal image of a single β-cell expressing D4ER. B–D: β-Cell [Ca2+]ER measurements. Cells were perifused with 15 mmol/L glucose (G15) in the presence of 250 µmol/L of the KATP channel opener Dz. As indicated, 1 µmol/L thapsigargin, 100 µmol/L ACh, or 45 mmol/L KCl (K45) was added. E and F: Simultaneous measurement of [Ca2+]c (FuraPE3) and [Ca2+]ER (D4ER) in β-cells. E: The perifusion medium contained 15 mmol/L glucose (G15) and 250 µmol/L Dz throughout. β-Cells were stimulated with 45 mmol/L KCl (K45) and 100 µmol/L ACh as indicated. F: β-Cells were perifused in glucose-free medium (G0) and then stimulated with 20 mmol/L glucose (G20). B–D: Means ± SE for 23–44 cells from three to four experiments with three islet preparations. E and F: Representative traces from 9 to 42 cells from three experiments with three islet preparations.
Therefore, D4ER was used to measure β-cell [Ca2+]ER. Blocking SERCAs with thapsigargin strongly decreased [Ca2+]ER, whereas subsequent addition of acetylcholine (ACh) was ineffective (Fig. 1B). Application of ACh before thapsigargin only partially emptied the ER (Fig. 1C). Raising [Ca2+]c by depolarization with 45 mmol/L KCl (K45) increased [Ca2+]ER (Fig. 1D), indicating that D4ER was not saturated.
D4ER is almost insensitive to intracellular pH (pHi) changes in the physiological range. Induction of supraphysiological pHi changes barely affected the D4ER ratio that decreased transiently by only 0.015 ± 0.008 units (n = 48) in response to strong alkalinization induced by 5 mmol/L NH4Cl but did not change in response to strong acidification occurring upon removal of NH4Cl (not shown). Moreover, all experiments were performed with a bicarbonate buffer where secretagogue-induced pHi changes are minimal (10,28).
Glucose induces [Ca2+]ER oscillations that partly involve SERCA3.
To study the correlation between [Ca2+]c and [Ca2+]ER, islet cells expressing D4ER were loaded with FuraPE3. The loading conditions were selected to have a weak FuraPE3 signal, the changes of which did not affect the D4ER ratio and hence apparent [Ca2+]ER (Supplementary Figs. 1–3). This was attested by the observation that K45 increased both [Ca2+]c and [Ca2+]ER, whereas ACh elicited the expected antiparallel changes in [Ca2+]c and [Ca2+]ER (Fig. 1E).
Addition of 20 mmol/L glucose to a glucose-free medium (G0) elicited a first transient [Ca2+]c drop that was accompanied by an increase in [Ca2+]ER (Fig. 1F, arrow 1). Thereafter, both [Ca2+]c and [Ca2+]ER increased abruptly (arrow 2) and started to oscillate in synchrony. The rapid increase in [Ca2+]ER occurring when [Ca2+]c rises (arrow 2) indicates that SERCAs are strongly stimulated by Ca2+.
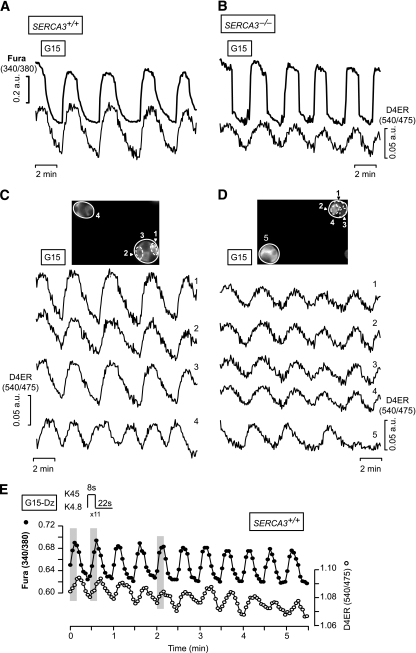
The parallel changes in [Ca2+]c and [Ca2+]ER were more easily seen during continuous stimulation with 15 mmol/L glucose (Fig. 2A). As expected from the electrical coupling between β-cells within a cluster (1), [Ca2+]ER oscillated synchronously between cells within the same cluster but asynchronously between cells from different clusters (Fig. 2C).
FIG. 2.
[Ca2+]ER oscillations are synchronized to glucose- or high KCl–induced [Ca2+]c oscillations in β-cells. A and B: Simultaneous measurements of [Ca2+]c (FuraPE3) and [Ca2+]ER (D4ER) in β-cells from SERCA3+/+ (A) or SERCA3−/− (B) mice perifused with 15 mmol/L glucose (G15). C and D: Changes in [Ca2+]ER analyzed in the whole-cluster or -cell regions indicated in the pictures at the top of each panel for SERCA3+/+ (C) or SERCA3−/− β-cells (D). E: SERCA3+/+ β-cells were submitted to pulses of 4.8 (K4.8) and 45 mmol/L KCl (K45) applied at a frequency (two per minute) and at the duration indicated at the top of the panel and mimicking the spontaneous oscillations of the electrical activity observed in islets stimulated by 10 mmol/L. The perifusion medium contained 15 mmol/L glucose (G15) and 250 µmol/L Dz throughout. The shaded areas highlight the synchronicity between [Ca2+]c and [Ca2+]ER. Values are means ± SE for 29–35 cells (A–D) or representative trace for 15 cells (E) from three experiments with three islet preparations.
We next compared β-cells from wild-type (SERCA3+/+) and SERCA3 knockout (SERCA3−/−) mice. In SERCA3−/− β-cells, glucose-induced [Ca2+]c oscillations were larger and steeper whereas [Ca2+]ER oscillations were smaller than in SERCA3+/+ β-cells (ΔRatio D4ER, 0.035 ± 0.01 [n = 57] vs. 0.052 ± 0.02 [n = 31]; P < 0.01) (Fig. 2B). [Ca2+]ER oscillations were synchronized between β-cells within the same cluster (Fig. 2D).
To test the impact of higher frequency [Ca2+]c oscillations on [Ca2+]ER, pulses of K45 were applied at a frequency and specific durations mimicking the spontaneous oscillations of the electrical activity observed in islets stimulated by 10 mmol/L (22 s K4.8/8 s K45) (Fig. 2E) or 15 mmol/L glucose (15 s K4.8/15 s K45) (not shown). They induced low-amplitude [Ca2+]ER oscillations. The maximal detectable frequency was three oscillations per minute.
Distinct roles of SERCA2b and SERCA3 upon acceleration of cell metabolism or rise in [Ca2+]c.
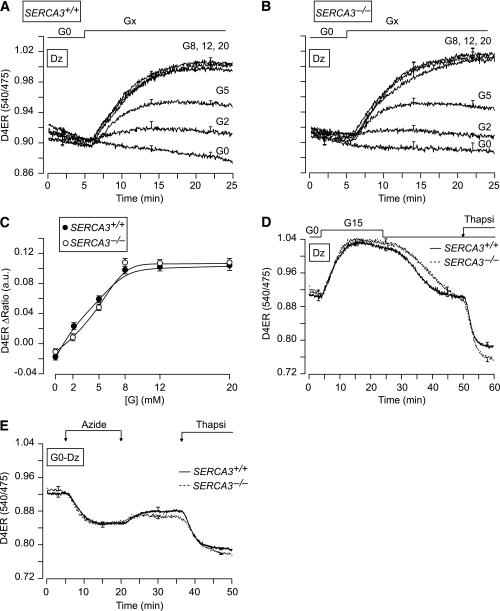
To investigate the effect of the sole acceleration of cell metabolism on Ca2+ uptake by SERCA2b or SERCA3, β-cells were preincubated for 30 min in G0 to deplete the ER in Ca2+, and subsequently stimulated with various [glucose] (from 2 to 20 mmol/L) in the presence of diazoxide (Dz) (Fig. 3A–C). Glucose similarly increased [Ca2+]ER in both SERCA3+/+ and SERCA3−/− β-cells. The filling of the ER in Ca2+ was prominent already at 2 mmol/L glucose, half-maximal at ∼5 mmol/L glucose, and maximal at 8 mmol/L of the sugar (Fig. 3A–C). Upon glucose removal, [Ca2+]ER decreased and stabilized rapidly in both SERCA3+/+ and SERCA3−/− β-cells (Fig. 3D). However, it was not emptied as subsequent application of thapsigargin decreased [Ca2+]ER further. Application of azide in G0 also decreased [Ca2+]ER, but to a lesser extent than thapsigargin (Fig. 3E).
FIG. 3.
Metabolic dependency of Ca2+ uptake by the ER. A and B: [Ca2+]ER (D4ER) measurements in β-cells from SERCA3+/+ (A) or SERCA3−/− (B) mice. After a 30-min preincubation in a glucose-free medium (G0), β-cells were perifused with various [glucose] (Gx) ranging from 2 to 20 mmol/L, as indicated. The Dz concentration was 250 µmol/L throughout. C: Dose-response curves of the experiments illustrated in A and B. D and E: The perifusion medium containing 250 µmol/L Dz was a glucose-free medium (G0) throughout (E) or was supplemented with 15 mmol/L glucose (G15) as indicated (D). Azide (5 mmol/L) and 1 µmol/L thapsigargin (Thapsi) were added as indicated. Values are means ± SE for 16–46 cells from three to four experiments with three to four islet preparations.
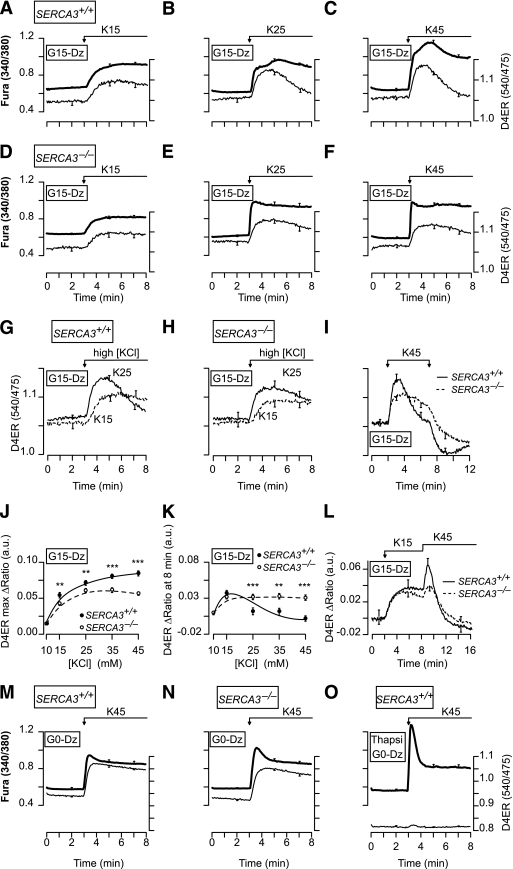
To assess the role of SERCA2b and SERCA3 in the replenishment of the ER with Ca2+ when [Ca2+]c increases, β-cells were perifused with 15 mmol/L glucose to provide enough ATP for the SERCAs and Dz to prevent Ca2+ influx (Fig. 4). They were then submitted to 5-min depolarizations with various [KCl] (10–45 mmol/L) to dose dependently increase [Ca2+]c. In SERCA3+/+ β-cells, the shape of the [Ca2+]ER rise strongly depended on the [KCl]: sustained at low [KCl] (≤15 mmol/L) and transient at higher [KCl] (Fig. 4A–C, thin line; G; I, solid line; J and K). The paradoxical drop in [Ca2+]ER achieved at high [KCl] (>15 mmol/L) is further documented in Fig. 4L, which shows that K15 increased [Ca2+]ER to a plateau, whereas subsequent addition of K45 elicited a transient [Ca2+]ER increase followed by a drop to lower values than those reached at K15. Upon repolarization, the pattern of the [Ca2+]ER decrease mirrored that of the increase. Thus, after stimulation with low [KCl] (K10–15), [Ca2+]ER decreased monotonically (not shown), whereas after stimulation with high [KCl] (≥K25), it displayed a pronounced drop followed by a subsequent slow recovery toward prestimulatory values (Fig. 4I, thick line, end of the trace). This suggests that strong ER replenishment in Ca2+ triggers the release of Ca2+ from the ER.
FIG. 4.
Characteristics of the [Ca2+]ER changes elicited by rises in [Ca2+]c of various amplitudes in β-cells from SERCA3+/+ and SERCA3−/− mice. A–F: Simultaneous measurement of [Ca2+]c (FuraPE3) and [Ca2+]ER (D4ER) in β-cells from SERCA3+/+ (A–C) or SERCA3−/− (D–F) mice perifused with 15 mmol/L glucose (G15) and 250 µmol/L Dz. Cells were stimulated with 15 mmol/L (K15) (A and D), 25 mmol/L (K25) (B and E), or 45 mmol/L (K45) K (C and F) as indicated. G–I and L: Comparison of [Ca2+]ER (D4ER) changes in β-cells from SERCA3+/+ (G, I, and L) or SERCA3−/− (H, I, and L) mice under various KCl stimulations, as indicated. J and K: Quantifications of the effects of the various [KCl] on the maximal [Ca2+]ER achieved after the change in [KCl] (J), and on [Ca2+]ER 5 min after the change in [KCl] (K). They show that [KCl] dose dependently increased [Ca2+]ER soon after the depolarization, but not 5 min after the depolarization as the [Ca2+]ER rise became smaller for [KCl] >15 mmol/L. **P < 0.01 and ***P < 0.001, for the comparison between SERCA3+/+ and SERCA3−/− islets at each [KCl], respectively. M–O: Simultaneous measurement of [Ca2+]c (FuraPE3) and [Ca2+]ER (D4ER) in β-cells from SERCA3+/+ (M and O) or SERCA3−/− (N) mice perifused with a glucose-free medium (G0) and 250 µmol/L Dz, and stimulated with 45 mmol/L KCl as indicated. O: β-cells were pretreated for 30 min with 1 μmol/L thapsigargin (Thapsi) prior to the experiments. Values are means ± SE for 29–81 cells from three to six experiments with three to four islet preparations.
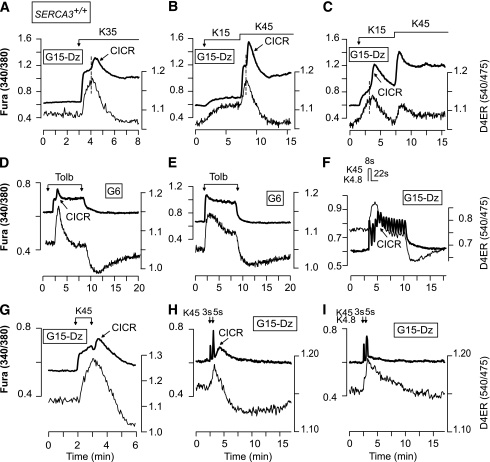
This proposal is strengthened by correlating the changes in [Ca2+]ER and [Ca2+]c. In SERCA3+/+ β-cells, low [KCl] (K10, K15) induced a dose-dependent and sustained [Ca2+]c increase (Fig. 4A, thick line), whereas higher [KCl] elicited in some cells a biphasic [Ca2+]c rise characterized by a sustained elevation superimposed by a transient hump (40–120 s after the onset of depolarization) (Fig. 4B and C, thick line). Increasing [KCl] augmented the percentage of cells displaying a hump (0/42 cells in K10, 3/29 [10%] cells in K15, 25/41 [61%] cells in K25, 38/47 [81%] cells in K35, and 33/35 [94%] cells in K45), the hump amplitude, and reduced the time at which it occurred. The presence of a hump is better illustrated on individual traces (Fig. 5). It always correlated with a drop in [Ca2+]ER, suggesting that it reflects a release of Ca2+ from the ER (Fig. 5A), which is reminiscent of the atypical Ca2+-induced Ca2+ release (CICR) that we previously documented (13). This suggestion is corroborated by three observations. 1) The antiparallel changes in [Ca2+]c and [Ca2+]ER occurred at different times in different cells within the same cluster, which is expected for a Ca2+ mobilization phenomenon (not shown). 2) Cells showing a parallel increase in [Ca2+]c and [Ca2+]ER in response to a first application of K15 displayed a hump always associated with a [Ca2+]ER drop during a subsequent application of K45 (Fig. 5B). 3) By contrast, the few cells that already displayed a [Ca2+]c hump associated with a [Ca2+]ER drop in response to K15 always showed parallel [Ca2+]c and [Ca2+]ER changes upon application of K45 (Fig. 5C). The CICR was also observed in the majority of the cells (28/38) during simulation with tolbutamide (Fig. 5D and E), and signs of it were observed during rapid imposed [Ca2+]c oscillations because a summation of [Ca2+]c oscillations was concomitant with a [Ca2+]ER decrease (Fig. 5F). The CICR could even be observed after the application of K45, i.e., when Ca2+ influx has stopped (Fig. 5G, H).
FIG. 5.
Simultaneous measurement of [Ca2+]c (FuraPE3) and [Ca2+]ER (D4ER) reveals that in some (A–D and F–H), but not all (E and I), β-cells from SERCA3+/+ mice, stimulation with high [KCl] or tolbutamide induces a CICR that is detectable by the antiparallel changes in [Ca2+]c and [Ca2+]ER. The perifusion medium contained 15 mmol/L glucose (G15) and 250 µmol/L Dz (A–C, F, and G–I), or 6 mmol/L glucose (G6) (D and E). A–C and G: β-Cells were stimulated with the indicated [KCl]. D and E: β-Cells were stimulated with 250 µmol/L tolbutamide (Tolb). F: β-Cells were submitted to pulses of 4.8 (K4.8) and 45 mmol/L KCl (K45) applied at a frequency (two per minute) and with a duration indicated on the top of the panel and mimicking the spontaneous oscillations of the electrical activity observed in islets stimulated by 10 mmol/L. H and I: β-Cells were submitted to two pulses of 45 mmol/L KCl (K45) of 3 and 5 s when indicated by the arrows. This illustrates the extremely fast uptake capacity of the ER as a [Ca2+]ER rise was already observed during a 3-s depolarization with K45. Values are representative traces for 33/35 (A), 31/51 (B), 6/51 (C), 28/38 (D), 10/38 (E), 34/41 (F), 10/17 (G), 2/35 (H), and 33/35 (I) cells from three experiments with three islet preparations.
In SERCA3−/− β-cells, the maximal [Ca2+]ER rises elicited by various [KCl] were smaller than in SERCA3+/+ β-cells, demonstrating that SERCA3 contributes to the Ca2+ refilling of the ER when [Ca2+]c increases (Fig. 4D–F, thin line; J). At [KCl] ≥25 mmol/L, the rise in [Ca2+]ER was less transient than in SERCA3+/+ β-cells (Fig. 4E, F, H, I, and K). Application of K45 after K15 induced a smaller [Ca2+]ER rise followed by a much slower [Ca2+]ER decrease than in SERCA3+/+ β-cells (Fig. 4L). However, no CICR was observed in the vast majority of SERCA3−/− β-cells (1/28 cells at K35 and 2/39 cells at K45) (Fig. 4E and F and Supplementary Fig. 4).
In G0, K45 induced a similar large [Ca2+]ER rise in SERCA3+/+ and SERCA3−/− β-cells (Fig. 4M and N) with no CICR. When SERCAs were blocked by thapsigargin, K45 induced a larger initial [Ca2+]c rise (Fig. 4, O vs. M, thick line), whereas it barely affected [Ca2+]ER (Fig. 4O, thin line). This demonstrates that most of the high [KCl]–induced [Ca2+]ER rise results from Ca2+ pumping by SERCAs that buffer the rise in [Ca2+]c.
The contribution of ER Ca2+ pumps other than SERCAs to the refilling of the ER in Ca2+, as investigated in thapsigargin-treated β-cells, was minimal (Supplementary Fig. 5 vs. Figs. 1, 4, and 5). Nevertheless, an increase of both metabolism and [Ca2+]c (Supplementary Fig. 5A, G20) induced a slightly larger [Ca2+]ER rise than a sole increase in either [Ca2+]c (Supplementary Fig. 5B, K45) or metabolism (Supplementary Fig. 5C, G20 + Dz). Application of azide (5 mmol/L) in G0 did not affect [Ca2+]ER (not shown).
Adaptation of [Ca2+]ER to long changes in [Ca2+]c.
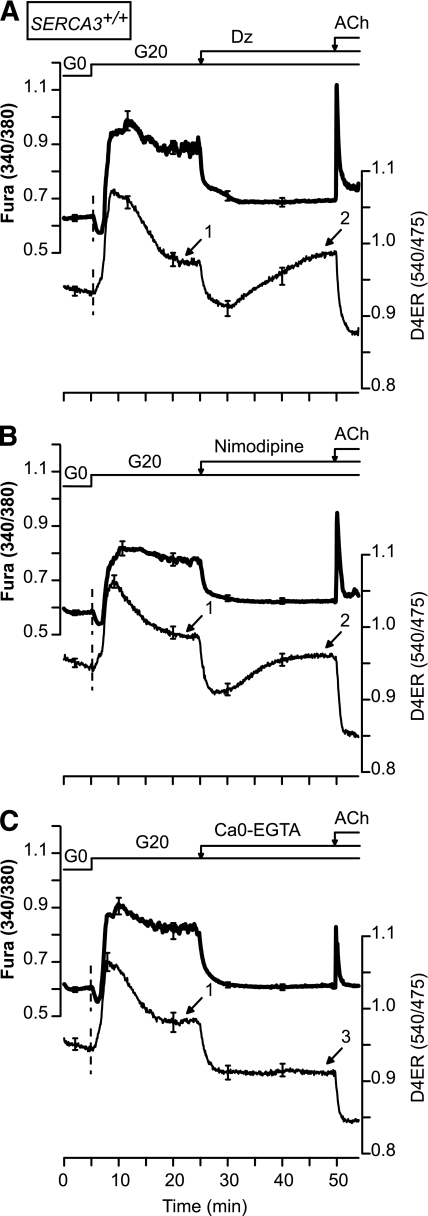
We next analyzed the influence of a [Ca2+]c decrease on [Ca2+]ER. Therefore, β-cells were first stimulated with 20 mmol/L glucose (Fig. 6). This induced a biphasic increase in [Ca2+]ER characterized by a first phase followed by a slow decrease to a plateau (Fig. 6, arrow 1) that was higher than in the absence of glucose. Abrogation of Ca2+ influx with the KATP channel opener Dz (Fig. 6A), or with the l-type Ca2+ channel blocker nimodipine (Fig. 6B), induced a rapid drop in [Ca2+]ER followed by a slow rise toward values (arrow 2) that were similar to those observed in the presence of 20 mmol/L glucose alone (arrows 1 vs. 2). By contrast, when Ca2+ influx was suppressed by removal of extracellular Ca2+, [Ca2+]ER decreased rapidly but did not increase thereafter (Fig. 6C, arrow 3). This suggests that the slow secondary [Ca2+]ER increase observed upon blockade of Ca2+ influx (Fig. 6A and B, arrow 2) results from an influx of external Ca2+ that either does not affect [Ca2+]c or could not be detected by measuring [Ca2+]c. To demonstrate the existence of such an influx, we performed quenching experiments of FuraPE3 trapped within the cell by Mn2+ applied extracellularly (Supplementary Fig. 6). This unequivocally demonstrates a prominent Mn2+ (representing Ca2+) influx (see 360-nm trace) that is not accompanied by a detectable [Ca2+]c rise in hyperpolarized β-cells.
FIG. 6.
The ER decreases or increases its [Ca2+] to compensate for, respectively, a sustained increase or decrease in [Ca2+]c. [Ca2+]ER (D4ER) was measured in β-cells from SERCA3+/+ mice. The glucose concentration (G) was increased from 0 to 20 mmol/L before the addition of 250 µmol/L Dz (A) or 1 µmol/L nimodipine (B) or the removal of extracellular Ca2+ (Ca0-EGTA) (C). ACh (100 µmol/L) was added at the end of the experiments. Values are means ± SE for 22–42 cells from three experiments with three islet preparations.
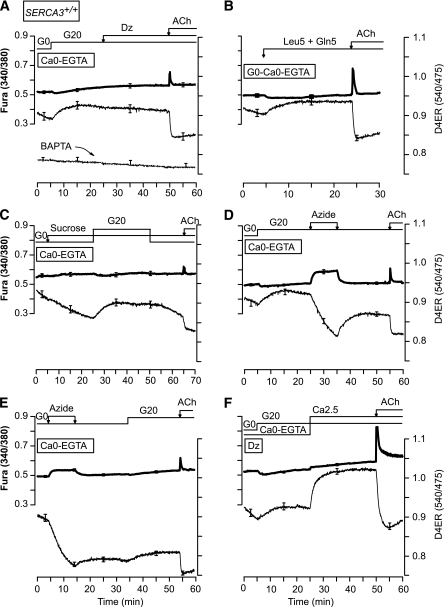
Finally, the impact of an increase of metabolism was evaluated in a Ca2+-free medium (Fig. 7). Surprisingly, application of glucose or metabolized amino acids increased [Ca2+]ER to a plateau that was independent of Ca2+ influx from the extracellular space and insensitive to Dz (Fig. 7A and B and Supplementary Fig. 7A). This increase was completely abrogated by preincubating the cells with the high-affinity intracellular Ca2+ chelator BAPTA (Fig. 7A). The glucose-induced [Ca2+]ER rise was unaffected by the nonmetabolized sugar sucrose (Fig. 7C), and reversed by the metabolic poison azide (Fig. 7D), indicating that it was due to an energy-requiring process. Application of azide in G0 decreased [Ca2+]ER in a poorly reversible manner (Fig. 7E). Note that the glucose-induced [Ca2+]ER increase observed in a Ca2+-free medium was small compared with the large response observed when extracellular Ca2+ was supplied (Fig. 7F; see same type of response in SERCA3−/− islets in Supplementary Fig. 7B).
FIG. 7.
Characteristics of Ca2+ uptake by the ER in response to activation of cell metabolism and during blockade of Ca2+ influx through voltage-dependent Ca2+ channels. [Ca2+]ER (D4ER) was measured in β-cells from SERCA3+/+ mice perifused with a Ca2+-free medium (Ca0-EGTA) throughout (A–E) or only at the beginning of the experiment (F). A and C–F: The glucose concentration was increased from 0 (G0) to 20 mmol/L (G20) before the addition of 250 µmol/L Dz (A) or 5 mmol/L azide (D), or the readmission of 2.5 mmol/L CaCl2 (Ca2.5) (F), or after the application of 20 mmol/L sucrose (C) or 5 mmol/L azide (E). B: The medium was supplemented with 5 mmol/L leucine and 5 mmol/L glutamine (Leu5 + Gln5) when indicated. A–F: ACh (100 µmol/L ) was added at the end of the experiments. Values are means ± SE for 23–44 cells from three experiments with three islet preparations.
SERCA3 ablation neither impairs glucose tolerance and insulin secretion nor increases ER stress.
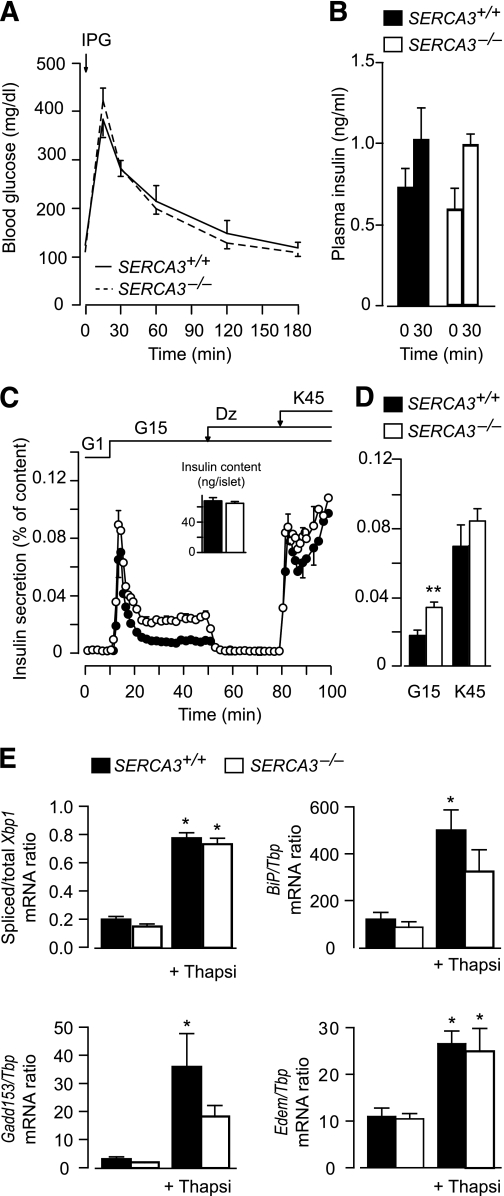
SERCA3−/− mice (24.4 ± 0.7 g) were indistinguishable from their wild-type littermates (24.4 ± 0.3 g) in their gross phenotype and their blood glucose and plasma insulin levels during an intraperitoneal glucose tolerance test (Fig. 8A and B). However, the stimulation of insulin secretion by glucose was larger in islets isolated from SERCA3−/− versus SERCA3+/+ mice, but the response to subsequent depolarization with K45 was similar (Fig. 8C and D).
FIG. 8.
SERCA3 ablation does not affect glucose tolerance, increases glucose-induced insulin release, and does not induce ER stress. A and B: Changes in blood glucose (A) and plasma insulin levels (B) in SERCA3+/+ and SERCA3−/− mice in response to an intraperitoneal glucose tolerance test (2.4 g/kg body weight). C: Batches of 25–30 SERCA3+/+ and SERCA3−/− islets were perifused with a medium containing 1 or 15 mmol/L glucose (G) or 250 µmol/L Dz, as indicated. The [KCl] of the medium was increased from 4.8 to 45 mmol/L when indicated. Insulin secretion is expressed as percentage of islet insulin content. Values are means ± SE of four to five experiments. D: Integrated insulin secretion calculated in the experiments shown in C from minute 10 to 50 for glucose stimulation and from minute 80 to 100 for K45 stimulation. E: After isolation, islets from SERCA3−/− mice and SERCA3+/+ mice were precultured for 1 week in serum-free RPMI 1640 medium containing 10 mmol/L glucose and 5 g/L BSA. They were then cultured 18 h in the same medium with or without 1 µmol/L thapsigargin (TG). After culture, islet total RNA was extracted and reverse-transcribed into cDNA as previously described (50). Xbp1 mRNA splicing and Gene:Tbp mRNA ratio were measured by PCR as described earlier (50), with the exception of the use of mouse-specific primers (Xbp1 sense 5′-CAAGGGGAGTGGAGTAAGGC-3′ and antisense 5′-GGCAACAGTGTCAGAGTCCAT-3′; other primers see Marhfour et al. [27]). Data are means ± SEM for three islet preparations. *P < 0.05 for the effect of TG in the same type of islets; there were no significant differences between SERCA3+/+ and SERCA3−/− islets.
We tested whether Serca3 ablation increases islet ER stress. As expected, thapsigargin significantly increased Xbp1 mRNA splicing and the mRNA levels of the ER stress-response genes BiP, Gadd153 (=Chop), and Edem in SERCA3+/+ islets (Fig. 8E). The effects of thapsigargin were of similar relative amplitude in SERCA3−/− islets, but the mRNA levels of BiP and Gadd153 tended to be lower in SERCA3−/− versus SERCA3+/+ islets.
DISCUSSION
We investigated [Ca2+]ER changes during spontaneous or imposed variations of [Ca2+]c and/or cell metabolism and the role of SERCA2b and SERCA3 in the control of [Ca2+]c, [Ca2+]ER, insulin secretion and ER stress. This is the first report of simultaneous measurements of [Ca2+]c and [Ca2+]ER in living, primary β-cells.
Nature of ER Ca2+ pumps.
In β-cells, SERCAs are the main pumps taking up Ca2+ into the ER as the uptake was almost completely abrogated by thapsigargin. The small residual thapsigargin-resistant uptake occurring in response to a rise in [Ca2+]c or acceleration of cell metabolism might involve other pumps like the plasma membrane–related Ca2+-ATPase-1 (PMR1) (29). SERCAs are responsible for refilling the IP3-sensitive Ca2+ store of the ER as thapsigargin fully prevented the ACh-induced [Ca2+]ER drop. However, a high concentration of ACh (100 µmol/L) only partly emptied the ER in Ca2+. This was not likely a result of insufficient production of IP3, as a maximal effective IP3concentration partly emptied the ER of permeabilized β-cells (30). This suggests that either the ACh-sensitive pool is a subset of the thapsigargin-sensitive pool, or that Ca2+ uptake by the ER in the presence of ACh compensates for Ca2+ leak through IP3 receptors and keeps the ER partially filled.
Regulation of Ca2+ uptake by the ER.
The observation that the initial drop in [Ca2+]c elicited by glucose is associated with an increase in [Ca2+]ER strengthens the previous proposal that this drop is the consequence of Ca2+ sequestration by the ER (4,31,32). In the presence of Dz, the filling of the ER in Ca2+ is half-maximal at ∼5 mmol/L and maximal at 8 mmol/L glucose. These values are close to those reported earlier (9). The similar glucose dependency of the [Ca2+]ER increase in SERCA3+/+ and SERCA3−/− β-cells in the presence of Dz suggests that SERCA2b is sufficient for the glucose-induced Ca2+ replenishment of the ER at basal [Ca2+]c, as previously suggested (5). This is not surprising because SERCA2b is more sensitive to Ca2+ than SERCA3 (33). Experiments of glucose withdrawal showed that the ER quickly adapts its [Ca2+] to fuel deprivation. Surprisingly, we found that glucose or amino acids promoted ER Ca2+ uptake in the absence of external Ca2+ (Fig. 7A and B). This indicates that cytosolic Ca2+-binding proteins constitute an important source of Ca2+, but the size of this pool is limited as [Ca2+]ER rose to a much larger extent when extracellular Ca2+ was readmitted while Ca2+ influx through voltage-dependent channels was prevented by Dz (Fig. 7F).
Experiments testing the impact of [Ca2+]c on [Ca2+]ER in SERCA3−/− β-cells showed that SERCA2b is strongly stimulated by a rise in [Ca2+]c. In the presence of 15 mmol/L glucose, SERCA3 contributes to ER Ca2+ accumulation because the maximal [Ca2+]ER achieved at high [Ca2+]c and the spontaneous glucose-induced [Ca2+]ER oscillations were higher in SERCA3+/+ than in SERCA3−/− β-cells. This correlates with the observation that spontaneous glucose-induced [Ca2+]c oscillations are of larger amplitude in SERCA3−/− than in SERCA3+/+ β-cells because of decreased buffering capacity of the ER (4).
The crucial role played by ATP in Ca2+ uptake by the ER is supported by the rapid drop in [Ca2+]ER that occurred upon addition of the mitochondrial poison azide. However, the observations that [Ca2+]ER was much higher in a glucose-free medium than with thapsigargin, that azide decreased [Ca2+]ER in G0, and that high KCl strongly increased [Ca2+]ER in G0 indicate that enough ATP is produced by endogenous fuel in a glucose-free medium. This is compatible with the very high affinity of SERCAs for ATP (9,33). It was surprising to see that azide did not decrease [Ca2+]ER to the same extent as thapsigargin (Fig. 3E). This suggests that some ATP can still be produced independently of fuel provision and mitochondrial metabolism and/or that there is enough ATP stored in the cell to maintain basal SERCA activity.
CICR from the ER.
Our study reveals that raising [Ca2+]c induces an initial [Ca2+]ER rise followed by a [Ca2+]ER decrease that is particularly prominent in cells expressing SERCA3. This decrease is concomitant to a [Ca2+]c rise and, hence, reflects Ca2+ release from the ER. It depends on the filling state of the ER as it is observed at [KCl] ≥25 mmol/L. It can be triggered by imposed [Ca2+]c oscillations (Fig. 5F) and is also observed in response to tolbutamide. The observations that mouse β-cells lack ryanodine receptors (Supplementary Fig. 8) (13), that this Ca2+ release was resistant to IP3- and ryanodine-receptor blockade, and that this Ca2+ release did not have the same fast kinetic as that of the rapid transients observed in INS-1 cells and β-cells from ob/ob mice (13,14,34) prompted us to name this process atypical CICR (13). It cannot result from activation of nicotinic acid adenine dinucleotide phosphate (NAADP)–sensitive channels located in the membrane of acidic organelles but not of the ER (35). The observation that the CICR can occur in the absence of Ca2+ influx, immediately after the depolarization (Fig. 5H), suggests that a high [Ca2+]ER rather than a high [Ca2+]c is the determinant of this CICR. It is clear that the ER is a very leaky organelle because blocking Ca2+ uptake by thapsigargin quickly decreases [Ca2+]ER and increases [Ca2+]c. The rate of this thapsigargin-induced [Ca2+]c rise augments with [Ca2+]ER (7). Hence, in theory, the atypical CICR could result from a rapid decrease of SERCA activity induced by a drop in cytosolic [ATP] (because, for instance, of increased ATP consumption occurring when [Ca2+]c rises) (36), by an accumulation of Ca2+ within the ER that negatively modulates SERCAs (37), or by another mechanism. As it is only observed in SERCA3-expressing cells, it might also reflect Ca2+ release through SERCA3 working in the reverse mode (38).
ER adaptation to sustained changes in [Ca2+]c.
Our study also shows that the Ca2+-induced [Ca2+]ER changes are transient. [Ca2+]ER tends to stabilize at similar levels after a long rise or drop in [Ca2+]c (Fig. 6A and B, arrows 1 and 2). This may contribute to the relative long-term stability of the [Ca2+]ER. The slow refilling of the ER in Ca2+ occurred when [Ca2+]c decreased to basal levels (Fig. 6). Quenching experiments with Mn2+ demonstrated a prominent Ca2+ influx in hyperpolarized cells that might involve STIM/Orai (39) or other unknown pathways.
Physiological implications.
Glucose-induced insulin secretion entirely depends on Ca2+ influx (1,2,40). Upon Ca2+ influx, the ER has two effects on [Ca2+]c. By taking up Ca2+, it buffers the rise in [Ca2+]c, which limits the amplitude of [Ca2+]c oscillations driven by intermittent Ca2+ influx. Once the ER is replenished with Ca2+, it can release Ca2+. Hence, at the end of each oscillation, the ER slowly releases Ca2+, which lengthens the duration of [Ca2+]c oscillations and is responsible for the summation of the [Ca2+]c signal upon application of repetitive depolarizations. This phenomenon induces mixed [Ca2+]c oscillations (6,41). If Ca2+ influx is prolonged and sustained, the ER can release Ca2+ by an atypical CICR, which might reflect a protection against [Ca2+]ER overload or constitute a mechanism producing ATP if it represents SERCA3 working in reverse mode (38).
The filling state of the ER modulates a store-operated current (SOC) in β-cells (42,43), the function of which is to replenish the ER with Ca2+. Changes in SOC amplitude control β-cell electrical activity (44). The amplitude of the rapid [Ca2+]ER oscillations (frequency 2–3/min) is probably too small to significantly affect SOC. However, that of the slow [Ca2+]ER oscillations evoked by glucose (0.25–0.5 per minute) might be of sufficient amplitude to modulate SOC and, hence, electrical activity (44). This is compatible with the observation that the smaller amplitude of the slow [Ca2+]ER oscillations in SERCA3−/− compared with SERCA3+/+ β-cells is accompanied by the disappearance of the periodic electrical activity (41).
Because the ER controls [Ca2+]c and the electrical activity, it also influences insulin secretion. Thus, SERCA3 ablation increases glucose-induced insulin release (Fig. 8) (4). This is probably due to the larger [Ca2+]c oscillations resulting from the decreased buffering capacity of the ER under these conditions (Fig. 2) (4). Importantly, we found that SERCA3 ablation did not impair glucose tolerance in vivo in mice, which suggests that SERCA3 might not be a culprit in the etiology of type 2 diabetes in humans, as previously suggested (22).
Apoptosis (17,45,46), synthesis, modifications and folding of proteins (47,48), and ER stress response (Fig. 8E) (49) are affected by large [Ca2+]ER changes. The influence of small [Ca2+]ER variations is unknown. In particular, we did not find ER stress induction in SERCA3−/− mice, although depleting the ER in Ca2+ with thapsigargin induced a strong ER stress response (Fig. 8E) (50). Average [Ca2+]ER rather than absolute changes in [Ca2+]ER might be more important to control these parameters. In that context, it is worth reemphasizing that our study demonstrated a relative long-term stability of the [Ca2+]ER, since for a given glucose concentration, sustained and strong Ca2+ influx elicited only a transient [Ca2+]ER increase.
ACKNOWLEDGMENTS
This work was supported by the Fonds de la Recherche Scientifique in Brussels (grants FNRS 3.4530.08 and 3.4569.06), grant ARC (05/10-328) from the General Direction of Scientific Research of the French Community of Belgium, and by the Interuniversity Poles of Attraction Programme (PAI 6/40) from the Belgian Science Policy. P.G. and J.-C.J. are Research Directors of the Fonds National de la Recherche Scientifique, Brussels. M.A.R. is Chargé de Recherches from INSERM, Paris. D.D. has held a research fellowship from the Fonds pour la formation à la Recherche dans l'Industrie et dans l'Agriculture (FRIA), Brussels.
No potential conflicts of interest relevant to this article were reported.
M.A.R. and P.G. researched data and wrote the manuscript. D.D., L.P.R., and R.C.-X. researched data. J.-C.J. and F.C.S. researched data and edited the manuscript.
The authors thank A. Sherman (National Institutes of Health, Bethesda, Maryland) for helpful discussion and V. Massé and N. Antoine (Université Catholique de Louvain) for skillful assistance.
Footnotes
This article contains Supplementary Data online at http://diabetes.diabetesjournals.org/lookup/suppl/doi:10.2337/db10-1543/-/DC1.
M.A.R. and D.D. contributed equally to this work.
REFERENCES
- 1.Gilon P, Henquin JC. Influence of membrane potential changes on cytoplasmic Ca2+ concentration in an electrically excitable cell, the insulin-secreting pancreatic B-cell. J Biol Chem 1992;267:20713–20720 [PubMed] [Google Scholar]
- 2.Rorsman P. The pancreatic beta-cell as a fuel sensor: an electrophysiologist’s viewpoint. Diabetologia 1997;40:487–495 [DOI] [PubMed] [Google Scholar]
- 3.Váradi A, Molnár E, Ostenson CG, Ashcroft SJ. Isoforms of endoplasmic reticulum Ca(2+)-ATPase are differentially expressed in normal and diabetic islets of Langerhans. Biochem J 1996;319:521–527 [DOI] [PMC free article] [PubMed] [Google Scholar]
- 4.Arredouani A, Guiot Y, Jonas JC, et al. SERCA3 ablation does not impair insulin secretion but suggests distinct roles of different sarcoendoplasmic reticulum Ca(2+) pumps for Ca(2+) homeostasis in pancreatic beta-cells. Diabetes 2002;51:3245–3253 [DOI] [PubMed] [Google Scholar]
- 5.Varadi A, Rutter GA. Dynamic imaging of endoplasmic reticulum Ca2+ concentration in insulin-secreting MIN6 Cells using recombinant targeted cameleons: roles of sarco(endo)plasmic reticulum Ca2+-ATPase (SERCA)-2 and ryanodine receptors. Diabetes 2002;51(Suppl. 1):S190–S201 [DOI] [PubMed] [Google Scholar]
- 6.Arredouani A, Henquin JC, Gilon P. Contribution of the endoplasmic reticulum to the glucose-induced [Ca(2+)](c) response in mouse pancreatic islets. Am J Physiol Endocrinol Metab 2002;282:E982–E991 [DOI] [PubMed] [Google Scholar]
- 7.Gilon P, Arredouani A, Gailly P, Gromada J, Henquin JC. Uptake and release of Ca2+ by the endoplasmic reticulum contribute to the oscillations of the cytosolic Ca2+ concentration triggered by Ca2+ influx in the electrically excitable pancreatic B-cell. J Biol Chem 1999;274:20197–20205 [DOI] [PubMed] [Google Scholar]
- 8.Maechler P, Kennedy ED, Sebö E, Valeva A, Pozzan T, Wollheim CB. Secretagogues modulate the calcium concentration in the endoplasmic reticulum of insulin-secreting cells. Studies in aequorin-expressing intact and permeabilized ins-1 cells. J Biol Chem 1999;274:12583–12592 [DOI] [PubMed] [Google Scholar]
- 9.Tengholm A, Hellman B, Gylfe E. Glucose regulation of free Ca(2+) in the endoplasmic reticulum of mouse pancreatic beta cells. J Biol Chem 1999;274:36883–36890 [DOI] [PubMed] [Google Scholar]
- 10.Varadi A, Rutter GA. Ca2+-induced Ca2+ release in pancreatic islet beta-cells: critical evaluation of the use of endoplasmic reticulum-targeted “cameleons”. Endocrinology 2004;145:4540–4549 [DOI] [PubMed] [Google Scholar]
- 11.Tamarina NA, Kuznetsov A, Rhodes CJ, Bindokas VP, Philipson LH. Inositol (1,4,5)-trisphosphate dynamics and intracellular calcium oscillations in pancreatic beta-cells. Diabetes 2005;54:3073–3081 [DOI] [PubMed] [Google Scholar]
- 12.Lemmens R, Larsson O, Berggren PO, Islam MS. Ca2+-induced Ca2+ release from the endoplasmic reticulum amplifies the Ca2+ signal mediated by activation of voltage-gated L-type Ca2+ channels in pancreatic beta-cells. J Biol Chem 2001;276:9971–9977 [DOI] [PubMed] [Google Scholar]
- 13.Beauvois MC, Arredouani A, Jonas JC, et al. Atypical Ca2+-induced Ca2+ release from a sarco-endoplasmic reticulum Ca2+-ATPase 3-dependent Ca2+ pool in mouse pancreatic beta-cells. J Physiol 2004;559:141–156 [DOI] [PMC free article] [PubMed] [Google Scholar]
- 14.Liu YJ, Tengholm A, Grapengiesser E, Hellman B, Gylfe E. Origin of slow and fast oscillations of Ca2+ in mouse pancreatic islets. J Physiol 1998;508:471–481 [DOI] [PMC free article] [PubMed] [Google Scholar]
- 15.Demaurex N, Frieden M. Measurements of the free luminal ER Ca(2+) concentration with targeted “cameleon” fluorescent proteins. Cell Calcium 2003;34:109–119 [DOI] [PubMed] [Google Scholar]
- 16.McCombs JE, Palmer AE. Measuring calcium dynamics in living cells with genetically encodable calcium indicators. Methods 2008;46:152–159 [DOI] [PMC free article] [PubMed] [Google Scholar]
- 17.Luciani DS, Gwiazda KS, Yang TL, et al. Roles of IP3R and RyR Ca2+ channels in endoplasmic reticulum stress and beta-cell death. Diabetes 2009;58:422–432 [DOI] [PMC free article] [PubMed] [Google Scholar]
- 18.Jiménez-Moreno R, Wang ZM, Messi ML, Delbono O. Sarcoplasmic reticulum Ca2+ depletion in adult skeletal muscle fibres measured with the biosensor D1ER. Pflugers Arch 2010;459:725–735 [DOI] [PMC free article] [PubMed] [Google Scholar]
- 19.Palmer AE, Jin C, Reed JC, Tsien RY. Bcl-2-mediated alterations in endoplasmic reticulum Ca2+ analyzed with an improved genetically encoded fluorescent sensor. Proc Natl Acad Sci USA 2004;101:17404–17409 [DOI] [PMC free article] [PubMed] [Google Scholar]
- 20.Palmer AE, Giacomello M, Kortemme T, et al. Ca2+ indicators based on computationally redesigned calmodulin-peptide pairs. Chem Biol 2006;13:521–530 [DOI] [PubMed] [Google Scholar]
- 21.Liu LH, Paul RJ, Sutliff RL, et al. Defective endothelium-dependent relaxation of vascular smooth muscle and endothelial cell Ca2+ signaling in mice lacking sarco(endo)plasmic reticulum Ca2+-ATPase isoform 3. J Biol Chem 1997;272:30538–30545 [DOI] [PubMed] [Google Scholar]
- 22.Varadi A, Lebel L, Hashim Y, Mehta Z, Ashcroft SJ, Turner R. Sequence variants of the sarco(endo)plasmic reticulum Ca(2+)-transport ATPase 3 gene (SERCA3) in Caucasian type II diabetic patients (UK Prospective Diabetes Study 48). Diabetologia 1999;42:1240–1243 [DOI] [PubMed] [Google Scholar]
- 23.Jonas JC, Sharma A, Hasenkamp W, et al. Chronic hyperglycemia triggers loss of pancreatic beta cell differentiation in an animal model of diabetes. J Biol Chem 1999;274:14112–14121 [DOI] [PubMed] [Google Scholar]
- 24.Chaâbane C, Corvazier E, Bredoux R, et al. Sarco/endoplasmic reticulum Ca2+ATPase type 3 isoforms (SERCA3b and SERCA3f): distinct roles in cell adhesion and ER stress. Biochem Biophys Res Commun 2006;345:1377–1385 [DOI] [PubMed] [Google Scholar]
- 25.Quoix N, Cheng-Xue R, Mattart L, et al. Glucose and pharmacological modulators of ATP-sensitive K+ channels control [Ca2+]c by different mechanisms in isolated mouse alpha-cells. Diabetes 2009;58:412–421 [DOI] [PMC free article] [PubMed] [Google Scholar]
- 26.Quoix N, Cheng-Xue R, Guiot Y, Herrera PL, Henquin JC, Gilon P. The GluCre-ROSA26EYFP mouse: a new model for easy identification of living pancreatic alpha-cells. FEBS Lett 2007;581:4235–4240 [DOI] [PubMed] [Google Scholar]
- 27.Marhfour I, Jonas JC, Marchandise J, et al. Endoplasmic reticulum accumulation of Kir6.2 without activation of ER stress response in islet cells from adult Sur1 knockout mice. Cell Tissue Res 2010;340:335–346 [DOI] [PubMed] [Google Scholar]
- 28.Shepherd RM, Henquin JC. The role of metabolism, cytoplasmic Ca2+, and pH-regulating exchangers in glucose-induced rise of cytoplasmic pH in normal mouse pancreatic islets. J Biol Chem 1995;270:7915–7921 [DOI] [PubMed] [Google Scholar]
- 29.Mitchell KJ, Tsuboi T, Rutter GA. Role for plasma membrane-related Ca2+-ATPase-1 (ATP2C1) in pancreatic beta-cell Ca2+ homeostasis revealed by RNA silencing. Diabetes 2004;53:393–400 [DOI] [PubMed] [Google Scholar]
- 30.Tengholm A, Hellman B, Gylfe E. The endoplasmic reticulum is a glucose-modulated high-affinity sink for Ca2+ in mouse pancreatic beta-cells. J Physiol 2001;530:533–540 [DOI] [PMC free article] [PubMed] [Google Scholar]
- 31.Hamakawa N, Yada T. Interplay of glucose-stimulated Ca2+ sequestration and acetylcholine-induced Ca2+ release at the endoplasmic reticulum in rat pancreatic beta-cells. Cell Calcium 1995;17:21–31 [DOI] [PubMed] [Google Scholar]
- 32.Roe MW, Philipson LH, Frangakis CJ, et al. Defective glucose-dependent endoplasmic reticulum Ca2+ sequestration in diabetic mouse islets of Langerhans. J Biol Chem 1994;269:18279–18282 [PubMed] [Google Scholar]
- 33.Lytton J, Westlin M, Burk SE, Shull GE, MacLennan DH. Functional comparisons between isoforms of the sarcoplasmic or endoplasmic reticulum family of calcium pumps. J Biol Chem 1992;267:14483–14489 [PubMed] [Google Scholar]
- 34.Dyachok O, Gylfe E. Ca(2+)-induced Ca(2+) release via inositol 1,4,5-trisphosphate receptors is amplified by protein kinase A and triggers exocytosis in pancreatic beta-cells. J Biol Chem 2004;279:45455–45461 [DOI] [PubMed] [Google Scholar]
- 35.Calcraft PJ, Ruas M, Pan Z, et al. NAADP mobilizes calcium from acidic organelles through two-pore channels. Nature 2009;459:596–600 [DOI] [PMC free article] [PubMed] [Google Scholar]
- 36.Detimary P, Gilon P, Henquin JC. Interplay between cytoplasmic Ca2+ and the ATP/ADP ratio: a feedback control mechanism in mouse pancreatic islets. Biochem J 1998;333:269–274 [DOI] [PMC free article] [PubMed] [Google Scholar]
- 37.Mogami H, Tepikin AV, Petersen OH. Termination of cytosolic Ca2+ signals: Ca2+ reuptake into intracellular stores is regulated by the free Ca2+ concentration in the store lumen. EMBO J 1998;17:435–442 [DOI] [PMC free article] [PubMed] [Google Scholar]
- 38.Shannon TR, Ginsburg KS, Bers DM. Reverse mode of the sarcoplasmic reticulum calcium pump and load-dependent cytosolic calcium decline in voltage-clamped cardiac ventricular myocytes. Biophys J 2000;78:322–333 [DOI] [PMC free article] [PubMed] [Google Scholar]
- 39.Putney JW. Capacitative calcium entry: from concept to molecules. Immunol Rev 2009;231:10–22 [DOI] [PubMed] [Google Scholar]
- 40.Henquin JC. Relative importance of extracellular and intracellular calcium for the two phases of glucose-stimulated insulin release: studies with theophylline. Endocrinology 1978;102:723–730 [DOI] [PubMed] [Google Scholar]
- 41.Beauvois MC, Merezak C, Jonas JC, Ravier MA, Henquin JC, Gilon P. Glucose-induced mixed [Ca2+]c oscillations in mouse beta-cells are controlled by the membrane potential and the SERCA3 Ca2+-ATPase of the endoplasmic reticulum. Am J Physiol Cell Physiol 2006;290:C1503–C1511 [DOI] [PubMed] [Google Scholar]
- 42.Dyachok O, Gylfe E. Store-operated influx of Ca(2+) in pancreatic beta-cells exhibits graded dependence on the filling of the endoplasmic reticulum. J Cell Sci 2001;114:2179–2186 [DOI] [PubMed] [Google Scholar]
- 43.Miura Y, Henquin JC, Gilon P. Emptying of intracellular Ca2+ stores stimulates Ca2+ entry in mouse pancreatic beta-cells by both direct and indirect mechanisms. J Physiol 1997;503:387–398 [DOI] [PMC free article] [PubMed] [Google Scholar]
- 44.Bertram R, Sherman A. Filtering of calcium transients by the endoplasmic reticulum in pancreatic beta-cells. Biophys J 2004;87:3775–3785 [DOI] [PMC free article] [PubMed] [Google Scholar]
- 45.Wang Q, Zhang H, Zhao B, Fei H. IL-1beta caused pancreatic beta-cells apoptosis is mediated in part by endoplasmic reticulum stress via the induction of endoplasmic reticulum Ca2+ release through the c-Jun N-terminal kinase pathway. Mol Cell Biochem 2009;324:183–190 [DOI] [PubMed] [Google Scholar]
- 46.Jiang L, Allagnat F, Nguidjoe E, et al. Plasma membrane Ca2+-ATPase overexpression depletes both mitochondrial and endoplasmic reticulum Ca2+ stores and triggers apoptosis in insulin-secreting BRIN-BD11 cells. J Biol Chem 2010;285:30634–30643 [DOI] [PMC free article] [PubMed] [Google Scholar]
- 47.Guest PC, Bailyes EM, Hutton JC. Endoplasmic reticulum Ca2+ is important for the proteolytic processing and intracellular transport of proinsulin in the pancreatic beta-cell. Biochem J 1997;323:445–450 [DOI] [PMC free article] [PubMed] [Google Scholar]
- 48.Corbett EF, Michalak M. Calcium, a signaling molecule in the endoplasmic reticulum? Trends Biochem Sci 2000;25:307–311 [DOI] [PubMed] [Google Scholar]
- 49.Ma Y, Hendershot LM. ER chaperone functions during normal and stress conditions. J Chem Neuroanat 2004;28:51–65 [DOI] [PubMed] [Google Scholar]
- 50.Elouil H, Bensellam M, Guiot Y, et al. Acute nutrient regulation of the unfolded protein response and integrated stress response in cultured rat pancreatic islets. Diabetologia 2007;50:1442–1452 [DOI] [PubMed] [Google Scholar]


