

Abstract
The T cell migration stop signal is a central step in T cell activation and inflammation, however its regulatory mechanisms remain largely unknown. Using a live-cell, imaging-based, high-throughput screen we identified the prostaglandin, prostaglandin E2 (PGE2) as a T cell stop signal antagonist. Src kinase inhibitors, microtubule inhibitors and prostaglandin E2 prevented the T cell stop signal and impaired T cell-APC conjugation and T cell proliferation induced by primary human allogeneic dendritic cells. However, Src inhibition but not prostaglandin E2 or microtubule inhibition impaired TCR-induced ZAP-70 signaling, demonstrating that T cell stop signal antagonists can function either upstream or downstream of proximal TCR signaling. Moreover, we found that PGE2 abrogated TCR-induced activation of the small GTPase Rap1, suggesting that PGE2 may modulate T cell adhesion and stopping through Rap1. These results identify a novel role for prostaglandins in preventing T cell stop signals and limiting T cell activation induced by dendritic cells.
INTRODUCTION
T cells are highly migratory cells that travel at speeds up to 30 μm/minute (1), and during inflammation can arrest their migration in response to receptor-mediated signals (2). T cells receive a migration “stop signal” and can rapidly halt migration following T-cell antigen receptor (TCR) signaling and interaction with antigen presenting cells (APCs). Transient T cell stopping can also be sufficient to induce T cell activation under some conditions (3, 4) and more prolonged interactions can be associated with the generation of CD8+ memory T cells (5). In any case, the T cell stop signal is essential for some types of immune synapse formation and T cell activation (6), and represents an attractive therapeutic target. The molecular mechanisms controlling the T cell stop signal are not well-understood, but likely involve signaling through one or more of the TCR proximal kinases Lck, Fyn, and zeta-chain-associated protein kinase (ZAP-70), and activation of the small GTPase Rap1 (7). Inhibiting proximal T cell receptor signaling through ligation of the endogenous receptor cytotoxic T-lymphocyte-associated protein 4 (CTLA-4) can reverse the T cell stop signal (8).
Despite its importance we have limited understanding of the signaling pathways that regulate T cell arrest induced by TCR engagement. In this study, we describe a live-cell imaging-based high-throughput method to identify signaling pathways that control the T cell stop signal induced by TCR ligation. Using live imaging the kinetics that accompany the decision to stop or go in response to TCR engagement can be assessed and we can identify small molecules that modify the kinetics of T cell stopping and thereby may impact duration of T cell-APC interactions. This is especially important in light of recent studies that demonstrate that the duration of T cell-APC contacts can determine T cell fate and the development of T cell activation or tolerance (9).
Here, we identified PGE2 as a novel regulator of T cell stopping and T cell-dendritic cell (DC) interactions. Prostaglandins are bioactive lipids that have been implicated in inflammation and are targeted by cyclooxygenase (COX) inhibitors commonly used to treat inflammatory disease (10, 11). However, the precise mechanisms by which prostaglandins control inflammation are not well-understood and recent studies have suggested that specific prostaglandins, notably, PGE2 may have anti-inflammatory effects (12, 13). Our findings provide novel insight into how PGE2 may limit T cell activation by impairing T cell arrest and inhibiting T cell-DC interactions. Moreover, our studies demonstrate that PGE2, unlike Src kinase inhibition, alters T cell stopping downstream of ZAP-70 and LAT (linker of activated T cells) phosphorylation at the level of Rap1 GTPase activation, indicating that the T cell stop signal can be decoupled from proximal TCR signaling.
MATERIALS AND METHODS
Reagents and Supplies
OKT3 antibody was purified from a B cell hybridoma line (14) and ICAM-1-Fc purified from transfected CHO cells (15) by affinity to protein G sepharose. Calcein-AM was obtained from Invitrogen (Carlsbad, CA). FTY720 was from Cayman Chemical (Ann Arbor, MI). Phytohemagglutinin (PHA), PP2, U-73122, and prostaglandin E2 were obtained from Fisher Scientific.
T cell purification
Leukocytes were obtained from whole blood (16) using Lymphoprep and resuspended in fresh T cell media (RPMI-1640, 10% heat-inactivated FBS, 1x HEPES, pyruvate, NEAA, BME). Cells were stimulated with PHA and expanded in the presence of IL-2 (50 U/mL) (Chiron) for 5-10 days. For conjugation and proliferation assays fresh human T cells were magnetically purified by a negative selection method using a pan T cell isolation kit (Miltenyi Biotechnology, Auburn, CA).
Generation of dendritic cells
DCs were obtained as described (17, 18). Monocytes were purified by magnetic sorting with anti-CD14 beads (Miltenyi Biotech) and differentiated three days in RPMI-1640 media supplemented with 2 mM L-glutamine, 100 μg/mL penicillin/streptomycin, and 10% FBS containing 300 U/mL of recombinant human GM-CSF (Berlex Labs) and 200 U/mL of recombinant human IL-4 (Peprotech, Rocky Hill, NJ).
Plate coating
384-well tissue culture treated plates (BD Optilux) were coated by addition of ICAM (20 μL to each well) at 5 μg/mL in coating buffer (Tris pH 9.5). Plates were incubated at 37°C for 1 hour, washed, and blocked by addition of 50 μl of blocking buffer (2% BSA in 1x PBS) for 1 hour at 37°C.
Quantification of adhesion
Cells were suspended at 500,000/mL and labeled by addition of 1 μM calcein AM for 15 minutes. Cells were collected by centrifugation and washed 2x with media. Cells were plated and centrifuged at 500g for 5 minutes, then incubated for 30 minutes at 37°C in the presence of inhibitors. 1 μg/mL OKT3 for was added for 10 minutes. Cells were aspirated and washed 3-6 times with pre-equilibrated fresh media. Adherent cells were quantified by plate reading.
Stop signal assay
We established conditions (modified from (8)) for modeling the T cell stop signal in a high-throughput assay (Supplemental Table S1). HPBT cells were labeled with calcein-AM (Invitrogen). 50 μL of HBPT cells at 1 × 10⁶/mL (following 5-14 days of expansion) were added to each well of a 384-well plate. Cells were plated and centrifuged at 500g for 5 minutes, then incubated for 5 minutes at 37°C. For low throughput experiments, cells were washed twice using pre-equilibrated culture media and test compounds were added by pipetting. For high throughput experiments, cells were mixed 6 times with a robotic pipette and media exchanged once. Test compounds were added using a 384-well pin transfer device. The T cell stop signal was induced with soluble OKT3 (1 μg/mL), a CD3 antibody known to stimulate TCR signaling (14), for 10 minutes after plating and washing the cells. Migration was monitored using a BD Pathway microscope. Two images were acquired under 10x magnification at an interval of ~7.5 minutes. Cells in the t=0 image were outlined with a 3 pixel dilation width to define the region of interest (ROI) for each cell and intensity within the ROI was calculated. Background intensity was subtracted and the percent remaining intensity for each individual ROI was calculated according to the following equation: (Ifinal - BG)/(Iinitial - BG) = Iremaining where I is pixel intensity and BG is background intensity. ROIs (cells) with Iremaining values of greater than 0.5 were deemed stopped while those with values under 0.5 migrating. Hits were defined by having a percent migration of greater than 40%. Treatment with OKT3 caused rapid depolarization and stopped migration within minutes and changed the distribution of the population of T cells from primarily migratory to stopped (Supplemental Movie S1). Typically, 60-80% of control cells were migrating compared to 5-20% of the OKT3-treated cells. This approach yielded an average Z’ factor of 0.5 and a 6.7 fold difference between positive and negative controls.
2D/OKT3 stop signal (Nikon)
50 μL of HBPT cells (following 5-14 days of expansion) were added to each well of a 384-well plate. Cells were plated and centrifuged at 500g for 5 minutes, then incubated for 5 minutes at 37°C. Cells were washed twice using pre-equilibrated culture media and test compounds were added by pipetting. Cells were incubated with compounds for 30 minutes 37°C. Stop signal was induced by addition of OKT3 antibody for 10 minutes at 37°C. Cells placed on movable microscope stage in a climate controlled chamber set at 37°C. Images were obtained using Metamorph and data analyzed by Microsoft Excel. For typical experiments, images were acquired for 15 minutes at 30 or 45 second intervals simultaneously for 8-12 experimental conditions. Migration was quantified by cell tracking, typically 30 cells picked at random per movie were tracked.
Cell based conjugation assay
DCs were stimulated for 8 hours with 250 ng/mL of LPS (Sigma Aldrich, St Louis, MO). DCs were labeled with DiD (Invitrogen). T cells were labeled with 2.5 μM CFSE. T cells (1×10⁵ cells in 100 μL) were treated for 30 minutes with indicated concentration of compounds, then mixed at a 1:1 ratio with DCs in media. Mixture was immediately centrifuged at 800g for 3 minutes and incubated at 37°C for the indicated time. Mixture was vortexed for 30 seconds and analyzed by flow cytometry.
T cell proliferation assay
T cells were labeled with 2.5 μM CFSE and cultured at a 50:1 ratio with allogeneic LPS-matured DCs with inhibitors or DMSO. Proliferation was assessed on day 6 by flow cytometry. The percentage of live T cells that had undergone cell division was determined by gating on DAPI-negative CD3+ cells, and assessing the fraction that showed diminished CFSE fluorescence intensity.
Western Blot Analysis
T cells (Day 5-10) at 2×10⁷/ml in 0.5-1 mL media were incubated with compounds for 30 minutes. Cells were placed on ice for 5 minutes then coated with 1 μg/mL OKT3 on ice for 20 minutes. Cells were suspended in 100 μL of media containing goat anti-mouse F(Ab)2 at 37°C for 3 minutes. Cells were lysed with 500 μL ice cold RIPA buffer (25 mM Tris•HCl pH 7.6, 150 mM NaCl, 1% NP-40, 1% sodium deoxycholate, 0.1% SDS). Lysing buffer contained freshly added phosphatase inhibitor cocktail (1:100 dilution, P-5726; Sigma) and protease inhibitor cocktail (1:100 dilution, P-8340; Sigma). Proteins were resolved by SDS-PAGE on 10% gels, transferred to nitrocellulose, and blotted with p-ZAP-70-Y319 (Cell Signaling), p-LAT-Y191 (Cell Signaling), p-Lck-Y505 (Cell Signaling), pY (4G10), vinculin (Sigma), p-Src-416 (Cell Signaling), p-Src-529 (Cell Signaling), or Fyn (Santa Cruz) antibodies. Detection was performed using Alexa-Fluor 680 goat-anti-mouse IgG (Molecular Probes) and IRDye 800CW goat-anti-rabbit IgG (Rockland).
Rap1 activation assay
Activated hPBT cells (25 × 106) were suspended in 1 mL of fresh T cell media in the presence or absence of test compounds for 30 minutes at 37°C and stimulated with OKT3 as described above. Cells were lysed in 500 μL Rap1 lysis buffer (1% Triton X-100; 50 mM Tris-HCl, pH 7.5; 100 mM NaCl; 10 mM MgCl2; 1 mM PMSF; 1 mM leupeptin; 0.5 mM aprotinin) (19). Lysates were cleared by centrifugation (16000 RPM for 10 minutes) and incubated with GST-RalGDS-RBD (Millipore) for 1 hour at 4°C with rotation. Beads were washed three times with lysis buffer and subjected to Western Blot analysis with anti-Rap1 (Santa Cruz). 25 uL of lysate was reserved to use as a loading control.
IL-2 production
Activated hPBT cells (1.5 × 10⁶) in 1 mL of T cell media were added to 24-well plates that had been pre-coated for 2 hours with 1 μg/mL OKT3 in PBS. Cells were stimulated for 5 hours at 37 °C in the presence of Brefeldin A (eBioscience). Cells were pelleted by centrifugation and resuspended in FACS buffer (2% FBS in PBS). Cells were labeled with APC-CD4 (eBioscience) according to manufacturer protocol, washed, and fixed overnight with 4% paraformaldehyde. Cells were resuspended in FACS buffer containing 0.1% saponin for 15 minutes. Cells were blocked for 15 minutes with Fc block (eBioscience) and labeled for 30 minutes with FITC-IL2 (eBioscience). Cells were washed twice with FACS buffer and analyzed by flow cytometry.
Statistical Analysis
All columns in bar graphs represent the mean of the indicated number of replicates. Error bars on graphs represent standard errors of the mean (SEM). ANOVA with Tukey's post hoc testing was used to calculate statistical significance. Unless otherwise indicated comparisons were done relative to the control. An α level of 0.05 was used as the level of significance.
RESULTS
Src inhibitor, PP2, is a T cell stop signal antagonist
To identify novel regulators of the T cell migration stop signal, we developed an image-based high-throughput screen for small molecules that impair TCR-induced T cell arrest (Figure 1, Supplemental Table S1, Supplemental Movie S1). The T cell stop signal was induced in primary human T cells by treatment with the anti-CD3 antibody OKT3 as described in the methods section (Figure 1A). Soluble OKT3 was sufficient to induce the T cell stop signal without TCR cross-linking or co-stimulation with anti-CD28 antibody, which is generally required to induce full T cell activation and proliferation, suggesting that early TCR engagement may be sufficient to induce the T cell stop signal (Figure 1B, Supplemental Movie S1).
Figure 1. Src kinase inhibitors prevent the T cell stop signal.

A) Schematic of methods used to distinguish between motile and non-motile cells. B) The fraction of migratory cells significantly decreased with OKT3 treatment, and was prevented by addition of 5 μM PP2 (representative data from over 15 experiments, 32 replicates each, mean +/- STDEV). C) Src kinase inhibitors reversed the OKT-3 mediated T cell stop signal. Cells were pre-treated with 5 μM of Src inhibitors PP1, PP2, SKI-1 and SU6656 (mean +/- STDEV, n=3, p<0.05 by ANOVA). D) SU6656 inhibits T cell adhesion to ICAM-1. Cells were incubated for 30 minutes with indicated concentrations (mean +/- STDEV, n=3, p<0.05 by ANOVA). E) PP2 and SU6656, but not SKI-1, inhibited phosphorylation of ZAP-70 and LAT. Cells were incubated for 30 minutes with compounds and stimulated for 3 minutes with OKT3 as described in methods. Representative blots from three independent experiments are shown. F) Quantification of Western Blots (mean +/- STDEV, n=3, p<0.5 ANOVA with Tukey's post-hoc test).
Lck and Fyn both play a critical role in proximal T-cell receptor (TCR) signal transduction (20). To determine if inhibition of proximal TCR signal transduction was sufficient to block the stop signal, T cells were pretreated with the Src kinase inhibitor PP2, which inhibits both Lck and Fyn activity (20). PP2 had no effect on T cell random motility on ICAM-1, but blocked T cell arrest induced by TCR ligation with OKT3 (Figure 1B). In the presence of both OKT3 and PP2 primary human T cells on ICAM-1 demonstrated rapid, random motility comparable to untreated control T cells on ICAM-1. The findings demonstrate that Src kinases are required for the T cell stop signal but not T cell random motility.
The Src kinase inhibitors PP1 and SU6656 but not SKI-1 impair TCR-induced T cell arrest
To determine if blocking proximal TCR signal transduction using other Src family kinase inhibitors was also sufficient to block the TCR-induced stop signal a panel of other Src inhibitors including PP1, SU6656 or SKI-1 (21) were used. PP1 and SU6656, like PP2, impaired TCR-induced T cell arrest (Figure 1C). Pretreatment with PP1, SU6656 or SKI-1 had no effect on T cell random motility on ICAM-1. However, SU6656, but not SKI-1, blocked the TCR stop signal and impaired adhesion of T cells to ICAM-1 coated plates (Figure 1D). Accordingly, we also found that SU6656 but not SKI-1 inhibited phosphorylation of ZAP-70 and LAT under the conditions of our assay (Figure 1E-F). Taken together, we found that the 3 different Src kinases inhibitors that impaired proximal TCR signaling also blocked the TCR-mediated T cell stop signal.
PGE2 impairs TCR-induced T cell arrest
To identify novel signaling pathways involved in T cell stop signals, we screened a library of 1600 compounds for effects on OKT3-induced T cell arrest as described in Methods and Supplemental Table S1. (Figure 2, Supplemental Table S2). Cells were plated on ICAM-1 coated 384-well plates in the presence or absence of test compounds. Approximately 60% of control cells (green line) were actively migrating, while stimulation with OKT3 induced a stop signal, decreasing migration to ~10% (red line) (Figure 2A). The majority of test compounds did not alter the ability of T cells to stop migrating (grey dots). After confirmation, five compounds, 0.31% of the total screened, prevented the T cell stop signal (Figure 2A). The positive compounds included two prostaglandins (PGE1 and PGE2), and three microtubule disrupting compounds (colchicine, albendazole and nocodazole) (Table 1). Representative time lapse images for PP2, PGE2 and colchicine are shown in Figure 2B. Control cells which were actively migrating do not colocalize at times T=0 and T=7.5, while cells stopped with OKT3 co-localized. Treatment with PP2, PGE2, or colchicine was sufficient to reverse co-localization and block T cell stopping.
Figure 2. A high-throughput assay for the HPBT cell migration stop signal identifies PGE2 and microtubule inhibitors as T cell stop signal antagonists.

A) PGE1, PGE2, colchicine, nocodazole and albendazole, impaired TCR-induced T cell stopping. Calcein-labeled HPBT cells (50,000/well) were plated and screened as described in methods. B) Representative images at T=0 and T=7.5 minutes from primary screen following 30 minute treatment with selected compounds (PP2, PGE2, and colchicine) (~6-12 μM) and 10 minute treatment with OKT3 (1 μg/mL). Merged image shows overlapped cells in the presence of OKT3 alone that is reversed by PP2, PGE2 and colchicine.
Table 1.
Confirmed hits from screening 1600 compounds of known bioactivity
| Name | Structure | % Migration | |
|---|---|---|---|
| Controls | Untreated | NA | 0.72 |
| CD3 | NA | 0.15 | |
| PP2 |
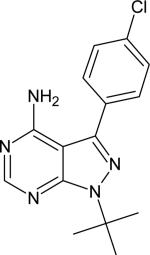
|
0.68 | |
| Prostanoids | Alprostidil (PGE1) |
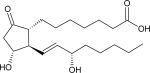
|
0.65 |
| Dinoprostone (PGE2) |
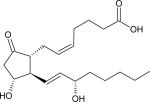
|
0.52 | |
| Microtubules | Colchicine |
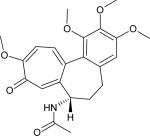
|
0.58 |
| Albendazole |
|
0.46 | |
| Nocodazole |
|
0.62 |
To confirm these results, time-lapse microscopy was performed to track the kinetics of T cell motility in T cells stimulated with OKT3 in the presence and absence of test compounds (Figure 3). As previously reported, primary human T cells were highly polarized and motile on ICAM-1 coated plates (Figure 3A). Treatment with OKT3 induced a loss of T cell polarity and impaired migration (from 10 μm/min in control T cells to 3 μm/min with OKT3) (Figure 3A-C). The effects of OKT3 on cell polarity and T cell motility were prevented by either treatment with PGE2 or the microtubule disrupting compound, colchicine (Figure 3B-C, Supplemental Movies S2-S4). The other positive hits also increased T cell polarity and random motility in the presence of OKT3 (Supplemental Figure S1A), however, PP2 was most effective at reversing T cell stopping. Taken together, these results identify both prostaglandins (PGE2) and microtubule disrupting agents (colchicine) as novel T cell stop signal antagonists. The identification of prostaglandins as stop signal antagonists is particularly surprising because prostaglandins have previously been reported to inhibit T cell directed migration (22).
Figure 3. PGE2 treatment impairs the T cell receptor stop signal.

A) DIC images of HPBT cells migrating on ICAM-1 in the presence or absence of PGE2 (5 μM) and OKT3 (1 μg/mL) demonstrated that OKT3 induced a loss of cell polarity that is abrogated in the presence of both PGE2 and OKT3. Bar, 20 microns. B) Displacement of individual cells during a 15 minute time period. C) Migration speeds in (microns/minute) expressed as mean +/- SEM (n=3, * p < 0.05, ANOVA).
PP2, but not PGE2 or colchicine, impairs proximal TCR signal transduction
Src kinase inhibition with PP2 prevents proximal T cell receptor signal transduction and activation of ZAP-70. To determine if PGE2 functions upstream of proximal T cell signaling to affect T cell arrest we characterized the effects of PGE2 on phosphorylation of downstream targets (Figure 4). In accordance with previous reports, stimulation of human T cells with OKT3 for three minutes induced an increase in total tyrosine phosphorylation, which was blocked by PP2 but was not altered by treatment with PGE2 or colchicine. To determine if PGE2 affects ZAP-70 phosphorylation, phosphorylation on tyrosine 319 was examined (23). OKT3 strongly stimulated ZAP-70 Y319 phosphorylation which was prevented by treatment with PP2. In contrast, PGE2 and colchicine, at concentrations that abrogate T cell arrest, had no effect on OKT3-induced ZAP-70 phosphorylation. PP2, but not PGE2 or colchicine, prevented OKT3-induced ZAP-70 activation and phosphorylation of LAT (linker of activated T cells) at Y191. Moreover, PP2, but not PGE2 or colchicine, decreased levels of the activating Fyn phosphorylation at Y420. Taken together, these results demonstrate that PGE2 and colchicine, in contrast to PP2, function as T cell stop signal antagonists downstream or independently of proximal T cell signal transduction. These results were surprising because PGE2 has been reported to inhibit Src kinase activity under some conditions (10, 24).
Figure 4. PP2, but not PGE2 or colchicine, impairs TCR-induced phosphorylation of ZAP-70 and LAT.

A) Western blot analysis of whole cell lysate. Cells were treated with 5 μM of compounds. OKT3 induced total tyrosine phosphorylation (4G10) and phosphorylation of ZAP-70 at Y319 and phosphorylation of LAT at Y191, which was prevented by treatment with PP2 but not PGE2 or colchicine. PP2 but not PGE2 or colchicine also impaired phosphorylation of Fyn. For analysis of Fyn, lysates were immunoprecipitated with Fyn antibody and blotted with p-Src-418 antibody. One representative blot from three experiments is shown. B) Quantification of Western Blots (mean +/- SEM, n=3, p<0.05 ANOVA)
PGE2 impairs TCR-induced LFA-1 mediated adhesion to ICAM-1
TCR engagement induces LFA-1 activation and T cell adhesion to ICAM-1 (25). To determine if PGE2 modulates TCR-mediated LFA-1 activation, we tested the effects of PGE2 on T cell adhesion to ICAM-1 in the presence of OKT3. Treatment with OKT3 induced a 3-6 fold increase in adhesion to ICAM-1 relative to untreated control cells (Figure 5A). PP2 blocked TCR-induced adhesion of T cells to ICAM-1. PGE2 and colchicine also impaired T cell adhesion to ICAM-1 in the presence of OKT3. These results suggest that PGE2 limits T cell arrest by impairing TCR-mediated inside-out LFA-1 activation and adhesion to ICAM-1.
Figure 5. PGE2 treatment impairs TCR-induced adhesion to ICAM-1 and activation of Rap1.

A) Adhesion to ICAM-1. Cells were treated with 10 or 50 μM PP2, colchicine, or PGE2 and assessed for adhesion to ICAM-1 in the presence or absence of OKT3. B) Representative Western Blot analysis of GTP-bound Rap1 following treatment with 10 μM of PP2 or PGE2 and stimulation with OKT3. C) quantification of rap1 GTP binding (mean +/- SEM, n=3, p<0.05 ANOVA).
PGE2 impairs TCR-induced Rap1 activation
TCR engagement induces activation of the small GTPase Rap1, which is required for inside out activation of LFA-1 and subsequent adhesion to ICAM-1 (19). To determine if PGE2 modulates Rap1 activation, we tested the effects of PGE2 on Rap1 GTP binding following stimulation with OKT3. OKT3 induced an ~8 fold increase in GTP-bound Rap1 relative to untreated control cells (Figure 5B). Both PP2 and PGE2 blocked Rap1 activation (Figure 5C). These results suggest that PGE2 may limit T cell arrest by preventing Rap1 GTPase activation and impairing LFA-1-mediated adhesion to ICAM-1.
PGE2 impairs T cell-DC interactions and DC-induced T cell proliferation
Duration of T cell-DC interactions modulate T cell fate and activation (9). To determine if PGE2 modulates human T cell-DC interactions, we characterized the effects of PGE2 on the interactions between T cells and allogeneic DCs using flow cytometry. Dendritic cells were derived from peripheral blood monocytes treated with GM-CSF and IL-4 for 3 days, followed by LPS for 8 hours. Interactions with naïve human T cells, labeled with CFSE was performed using flow cytometry as described in the methods section (Hedge, 2009) (Figure 6 and Supplemental Figure S1B). In the presence of vehicle control, the efficiency of T cell-DC conjugation was 22.3% (Figure 6A). PP2 (50 μM) reduced the rate of conjugation to 9.5%, which was reported as TCR-dependent conjugation. Treatment of T cells with PGE2 (50 μM) also inhibited conjugation, with an approximate 60% decrease in TCR-dependent conjugation (Figure 6B, 6C). To determine if PGE2 modulates downstream T cell signaling, we tested the effects of PGE2 on TCR-stimulated IL-2 production (Figure 6D). OKT3 induced a ~15 fold increase in IL-2 production relative to untreated control cells. PP2, PGE2, and colchicine blocked TCR-induced IL-2 production.
Figure 6. PGE2 inhibits T cell conjugation and proliferation with allogeneic dendritic cells.

A) CFSE-labeled T cells were mixed with allogeneic DiD-labeled DCs and assessed for conjugation in the presence or absence of PP2 (50 μM) or PGE2 (50 μM). Conjugation events as a percentage of total events for one representative experiment is shown. B) Percentage of conjugation from three independent experiments in the presence or absence of colchicine (50 μM), PP2 (50 μM), or PGE2 (50 μM). C) Fraction of TCR-dependent conjugation inhibited by PGE2 (mean +/- SEM, n = 3, *p < 0.05 ANOVA). D) IL-2 production in T cells that had been pretreated with PP2, PGE2, or colchicine (mean +/- SEM, n = 3, *p < 0.05 ANOVA). E) CFSE-labeled T cells were activated by DCs and analyzed for proliferation by CFSE dilution at 6 days post-stimulation in the presence or absence of PGE2 (50 μM) or PP2 (50 μM). Data are representative from three independent experiments. F) Dose response curves for allogeneic DC stimulated T cell proliferation in the presence or absence of PGE2, PP2, or colchicine (mean +/- SEM, n = 3, *p < 0.05 ANOVA).
To determine if PGE2 modulates DC-induced T cell proliferation, we analyzed proliferation of T cells using CFSE dilution at day six following stimulation with allogeneic dendritic cells (Figure 6E and Supplemental Figure S1C). In the presence of DMSO only, 31% of cells were proliferative. PP2 and PGE2 blocked T cell proliferation at concentrations of 50 μM (0.6% and 0.5%, of control respectively). The inhibition by PGE2 was dose-dependent (Figure 6F), and a statistically significant decrease in proliferation was seen at concentrations as low as 2.5 μM. Growth inhibition was also observed upon stimulation with CD3/CD28-coated beads in the presence of PGE2 (Supplemental Figure S1D). Taken together, these data demonstrate that PGE2 impairs T cell-DC conjugation and DC-induced T cell proliferation.
DISCUSSION
The identification of small molecules that alter T cell interactions with antigen presenting cells represents an intriguing therapeutic strategy for autoimmune diseases such as rheumatoid arthritis and systemic lupus erythematosus (SLE). Indeed, a recent study has highlighted the critical importance of T cell and APC contact duration in determining T cell fate in vivo and the development of T cell tolerance or activation (9). There are currently no known small molecules which reverse the T cell stop signal in clinical use, and the addition of such drugs to treat autoimmune diseases is particularly attractive given the high cost of biologic agents and the resultant burden on the healthcare system. Here, we have identified at least three distinct classes of “reverse-stop” small molecules that impair TCR-induced T cell arrest but not random T cell motility: 1) Src family tyrosine kinase inhibitors, 2) microtubule depolymerizing agents, and 3) prostaglandins. These compounds act in contrast to inhibitors of phospholipase C (U73122), which block both basal and activated T cell motility or sphingosine-1-phosphate analog FTY720 and the PI3K inhibitor LY-294002 which altered basal motility but did not affect adhesion or spreading induced by OKT3 (Supplemental Table S3).
The requirement of Src family kinases for the TCR induced T cell stop signal but not for T cell random motility indicates that Src inhibitors represent T cell stop signal antagonists. This is consistent with the model that proximal T cell signaling is necessary for TCR-induced T cell arrest. It is intriguing that not all Src kinase inhibitors, most notably SKII, are capable of reversing the T cell stop signal. The results suggest that the stop signal is dependent on a Src family kinase which is preferentially targeted by PP1, PP2, and SU6656 but not SKI1.
Previous work has indicated that Src kinase activation is required for TCR-mediated polarization of the microtubule organizing center toward the T cell-APC contact (26) (27). It is interesting that our data indicate that Src inhibitors and microtubule disruption impair T cell stopping and interactions with APC. This is, to our knowledge, the first report to show that microtubules are necessary for the T cell arrest induced by TCR ligation. In accordance with our findings, previous studies have reported that microtubule disruption induces random motility of neutrophils (28) and modulates T cell random migration through rho/ROCK signaling (29). However, ROCK inhibition did not affect TCR-induced T cell stopping in our system, suggesting that effects of microtubule inhibition on T cell arrest may be independent of Rho/ROCK signaling.
The finding that both microtubule polymerization inhibitors and prostaglandins are capable of preventing the T cell stop signal without affecting ZAP-70 or LAT phosphorylation (i.e. proximal T cell receptor signaling) is particularly interesting (Figure 3). In fact, we had initially hypothesized that the screening results would yield molecules that work to disrupt proximal signaling, such as the Src inhibitors. Our findings suggest that it is possible to decouple proximal T cell receptor signaling from the T cell receptor stop signal. PGE2 had no effect on the phosphorylation of Lck or Fyn at concentrations that block T cell arrest, suggesting that PGE2 effects on T cell arrest are independent of its effects on Src kinase activity. Our findings identified a novel role for PGE2 in regulation of the small GTPase Rap1, which is critical for TCR induced inside out activation of LFA-1.
To our knowledge, this is the first report to implicate PGE2 in regulating the T cell stop signal. In contrast, previous studies have reported that PGE2 stimulates the ability of DCs to induce T cell proliferation (30). The finding that PGE1 and PGE2 impair T cell migration stopping as well as inhibit T cell proliferation (31) indicate there may be counteracting mechanisms in place. Therefore, the presence of prostaglandins may both promote and block DC-dependent T cell activation depending on the context of exposure. Additionally, while PGE2 has been largely thought to be pro-inflammatory, recent studies have suggested that PGE2 and prostaglandin analogs may be anti-inflammatory in cases of autoimmune diseases such as systemic lupus erythematosus (13), due to its effects on DC-mediated cytokine production and shifting immune response from a Th1 to Th2 profile. Inhibition of the T cell receptor stop signal would provide an additional anti-inflammatory mechanism for PGE2.
Interactions between dendritic cells and T cells play a central role in the pathogenesis of autoimmune diseases such as SLE and represent an important therapeutic target. In addition to affecting the T cell receptor stop signal, we found that PGE2 significantly impaired T cell-DC interactions and DC-induced T cell proliferation (Figure 4). PGE2 and certain PG analogs are FDA-approved agents, and the novel effects on T cell stop signal and interactions with dendritic cells suggests they may have therapeutic benefit in patients with SLE. In support of this possibility is a recent paper that suggests that PGE2 also inhibits IFN-alpha secretion by plasmacytoid dendritic cells, key players in SLE pathogenesis (13). Additionally, another report recently demonstrated that cyclooxygenase (COX) inhibitors disrupt resolution of inflammation that was dependent upon PGE2 in a mouse arthritis model (12). Moreover, our results may help to explain why exacerbation of SLE-like symptoms have been reported in patients treated with (COX) inhibitors (13), which function to decrease prostaglandin synthesis.
In summary, we have identified small molecules that modulate the T cell stop signal using a novel image-based high throughput screen. Because the approach is activation-based rather than inhibition-based, there are likely to be fewer off-target hits. We have shown that Src kinase inhibitors potently block the T cell stop signal and impair T cell-DC interactions. Our findings suggest that compounds which function either downstream or independently of ZAP-70 and LAT are also capable of reversing the T cell stop signal. The ability of prostaglandins to block TCR-induced Rap1 activation and antagonize the T cell stop signal is especially intriguing and supports the use of this class of compounds as therapeutic agents that may have benefit in autoimmune disease. Likewise, these results may help explain the surprising pro-inflammatory effects sometimes seen with COX-2 inhibitors. Taken together, the findings suggest that small molecules that reverse the migration stop signal in vitro may either impair proximal TCR signaling, inhibit signaling at the level of Rap1, or directly induce random motility, thereby limiting TCR-induced stopping and DC-induced T cell activation. The present study illustrates that high throughput imaging of primary human cells can effectively be used to identify small molecules that alter migration stopping, allowing for further understanding of the molecular mechanisms that regulate antigen-induced T cell arrest, and offering a new paradigm for drug discovery.
Supplementary Material
ACKNOWLEDGEMENTS
We thank Noel Peters and Song Guo at the UW Keck Small Molecule Screening Facility and Kathy Schell at the UW Flow Cytometry Facility for technical assistance. We thank Sarah Wernimont, Miriam Shelef, David Bennin and Taylor Starnes for phlebotomy assistance. A.J.W. designed research, performed research, contributed new reagents or analytic tools, analyzed data, and wrote the paper. S.H. performed research and reviewed the paper. J.E.G. designed research and reviewed the paper. A.H. designed research, analyzed data, and wrote the paper.
Footnotes
This work was supported by National Institutes of Health Grant NIAID R01 to A.H. [AI068062] and a grant from the Burroughs Wellcome Foundation to A.H. Postdoctoral support was provided to A.J.W. by the UW Institute on Aging Training Grant (NIH#T32AG000213-17), Sanjay Asthana PI.
REFERENCES
- 1.Friedl P, Weigelin B. Interstitial leukocyte migration and immune function. Nat. Immunol. 2008;9:960–969. doi: 10.1038/ni.f.212. [DOI] [PubMed] [Google Scholar]
- 2.Dustin ML, Bromley SK, Kan Z, Peterson DA, Unanue ER. Antigen receptor engagement delivers a stop signal to migrating T lymphocytes. Proc. Natl. Acad. Sci. USA. 1997;94:3909–3913. doi: 10.1073/pnas.94.8.3909. [DOI] [PMC free article] [PubMed] [Google Scholar]
- 3.Gunzer M, Schafer A, Borgmann S, Grabbe S, Zanker KS, Brocker EB, Kampgen E, Friedl P. Antigen presentation in extracellular matrix: interactions of T cells with dendritic cells are dynamic, short lived, and sequential. Immunity. 2000;13:323–332. doi: 10.1016/s1074-7613(00)00032-7. [DOI] [PubMed] [Google Scholar]
- 4.Gunzer M, Weishaupt C, Hillmer A, Basoglu Y, Friedl P, Dittmar KE, Kolanus W, Varga G, Grabbe S. A spectrum of biophysical interaction modes between T cells and different antigen-presenting cells during priming in 3-D collagen and in vivo. Blood. 2004;104:2801–2809. doi: 10.1182/blood-2004-03-1193. [DOI] [PubMed] [Google Scholar]
- 5.Scholer A, Hugues S, Boissonnas A, Fetler L, Amigorena S. Intercellular adhesion molecule-1-dependent stable interactions between T cells and dendritic cells determine CD8+ T cell memory. Immunity. 2008;28:258–270. doi: 10.1016/j.immuni.2007.12.016. [DOI] [PubMed] [Google Scholar]
- 6.Mempel TR, Henrickson SE, Von Andrian UH. T-cell priming by dendritic cells in lymph nodes occurs in three distinct phases. Nature. 2004;427:154–159. doi: 10.1038/nature02238. [DOI] [PubMed] [Google Scholar]
- 7.Guy CS, Vignali DA. Organization of proximal signal initiation at the TCR:CD3 complex. Immunol. Rev. 2009;232:7–21. doi: 10.1111/j.1600-065X.2009.00843.x. [DOI] [PMC free article] [PubMed] [Google Scholar]
- 8.Schneider H, Downey J, Smith A, Zinselmeyer BH, Rush C, Brewer JM, Wei B, Hogg N, Garside P, Rudd CE. Reversal of the TCR stop signal by CTLA-4. Science. 2006;313:1972–1975. doi: 10.1126/science.1131078. [DOI] [PubMed] [Google Scholar]
- 9.Katzman SD, O'Gorman WE, Villarino AV, Gallo E, Friedman RS, Krummel MF, Nolan GP, Abbas AK. Duration of antigen receptor signaling determines T-cell tolerance or activation. Proc. Natl. Acad. Sci. USA. 2010 doi: 10.1073/pnas.1010560107. [DOI] [PMC free article] [PubMed] [Google Scholar]
- 10.Chemnitz JM, Driesen J, Classen S, Riley JL, Debey S, Beyer M, Popov A, Zander T, Schultze JL. Prostaglandin E2 impairs CD4+ T cell activation by inhibition of lck: implications in Hodgkin's lymphoma. Cancer Res. 2006;66:1114–1122. doi: 10.1158/0008-5472.CAN-05-3252. [DOI] [PubMed] [Google Scholar]
- 11.Wymann MP, Schneiter R. Lipid signalling in disease. Nature Reviews Molecular Cell Biology. 2008;9:162–176. doi: 10.1038/nrm2335. [DOI] [PubMed] [Google Scholar]
- 12.Chan MM, Moore AR. Resolution of inflammation in murine autoimmune arthritis is disrupted by cyclooxygenase-2 inhibition and restored by prostaglandin E2-mediated lipoxin A4 production. J. Immunol. 2010;184:6418–6426. doi: 10.4049/jimmunol.0903816. [DOI] [PMC free article] [PubMed] [Google Scholar]
- 13.Fabricius D, Neubauer M, Mandel B, Schutz C, Viardot A, Vollmer A, Jahrsdorfer B, Debatin KM. Prostaglandin E2 inhibits IFN-alpha secretion and Th1 costimulation by human plasmacytoid dendritic cells via E-prostanoid 2 and E-prostanoid 4 receptor engagement. J. Immunol. 2010;184:677–684. doi: 10.4049/jimmunol.0902028. [DOI] [PubMed] [Google Scholar]
- 14.Van Wauwe JP, De Mey JR, Goossens JG. OKT3: a monoclonal anti-human T lymphocyte antibody with potent mitogenic properties. J. Immunol. 1980;124:2708–2713. [PubMed] [Google Scholar]
- 15.Stanley P, Hogg N. The I domain of integrin LFA-1 interacts with ICAM-1 domain 1 at residue Glu-34 but not Gln-73. J. Biol. Chem. 1998;273:3358–3362. doi: 10.1074/jbc.273.6.3358. [DOI] [PubMed] [Google Scholar]
- 16.Simonson WTN, Franco SJ, Huttenlocher A. Talin1 regulates TCR-mediated LFA-1 function. J. Immunol. 2006;177:7707–7714. doi: 10.4049/jimmunol.177.11.7707. [DOI] [PubMed] [Google Scholar]
- 17.Hegde S, Jankowska-Gan E, Roenneburg DA, Torrealba J, Burlingham WJ, Gumperz JE. Human NKT cells promote monocyte differentiation into suppressive myeloid antigen-presenting cells. J Leukoc Biol. 2009;86:757–768. doi: 10.1189/jlb.0209059. [DOI] [PMC free article] [PubMed] [Google Scholar]
- 18.Hegde S, Chen X, Keaton JM, Reddington F, Besra GS, Gumperz JE. NKT cells direct monocytes into a DC differentiation pathway. J Leukoc Biol. 2007;81:1224–1235. doi: 10.1189/jlb.1206718. [DOI] [PubMed] [Google Scholar]
- 19.Katagiri K, Hattori M, Minato N, Kinashi T. Rap1 functions as a key regulator of T-cell and antigen-presenting cell interactions and modulates T-cell responses. Mol. Cell Biol. 2002;22:1001–1015. doi: 10.1128/MCB.22.4.1001-1015.2002. [DOI] [PMC free article] [PubMed] [Google Scholar]
- 20.Salmond RJ, Filby A, Qureshi I, Caserta S, Zamoyska R. T-cell receptor proximal signaling via the Src-family kinases, Lck and Fyn, influences T-cell activation, differentiation, and tolerance. Immunol. Rev. 2009;228:9–22. doi: 10.1111/j.1600-065X.2008.00745.x. [DOI] [PubMed] [Google Scholar]
- 21.Blake RA, Broome MA, Liu X, Wu J, Gishizky M, Sun L, Courtneidge SA. SU6656, a selective src family kinase inhibitor, used to probe growth factor signaling. Mol. Cell Biol. 2000;20:9018–9027. doi: 10.1128/mcb.20.23.9018-9027.2000. [DOI] [PMC free article] [PubMed] [Google Scholar]
- 22.Mesri M, Liversidge J, Forrester JV. Prostaglandin E2 and monoclonal antibody to lymphocyte function-associated antigen-1 differentially inhibit migration of T lymphocytes across microvascular retinal endothelial cells in rat. Immunology. 1996;88:471–477. doi: 10.1046/j.1365-2567.1996.d01-671.x. [DOI] [PMC free article] [PubMed] [Google Scholar]
- 23.Pelosi M, Di Bartolo V, Mounier V, Mege D, Pascussi JM, Dufour E, Blondel A, Acuto O. Tyrosine 319 in the interdomain B of ZAP-70 is a binding site for the Src homology 2 domain of Lck. J. Biol. Chem. 1999;274:14229–14237. doi: 10.1074/jbc.274.20.14229. [DOI] [PubMed] [Google Scholar]
- 24.Choudhry MA, Uddin S, Sayeed MM. Prostaglandin E2 modulation of p59fyn tyrosine kinase in T lymphocytes during sepsis. J. Immunol. 1998;160:929–935. [PubMed] [Google Scholar]
- 25.Abraham C, Griffith J, Miller J. The dependence for leukocyte function-associated antigen-1/ICAM-1 interactions in T cell activation cannot be overcome by expression of high density TCR ligand. J. Immunol. 1999;162:4399–4405. [PubMed] [Google Scholar]
- 26.Martin-Cofreces NB, Sancho D, Fernandez E, Vicente-Manzanares M, Gordon-Alonso M, Montoya MC, Michel F, Acuto O, Alarcon B, Sanchez-Madrid F. Role of Fyn in the rearrangement of tubulin cytoskeleton induced through TCR. J. Immunol. 2006;176:4201–4207. doi: 10.4049/jimmunol.176.7.4201. [DOI] [PubMed] [Google Scholar]
- 27.Gomez TS, Billadeau DD. T cell activation and the cytoskeleton: you can't have one without the other. Adv. Immunol. 2008;97:1–64. doi: 10.1016/S0065-2776(08)00001-1. [DOI] [PubMed] [Google Scholar]
- 28.Xu J, Wang F, Van Keymeulen A, Rentel M, Bourne HR. Neutrophil microtubules suppress polarity and enhance directional migration. Proc. Natl. Acad. Sci. USA. 2005;102:6884–6889. doi: 10.1073/pnas.0502106102. [DOI] [PMC free article] [PubMed] [Google Scholar]
- 29.Takesono A, Heasman SJ, Wojciak-Stothard B, Garg R, Ridley AJ. Microtubules regulate migratory polarity through Rho/ROCK signaling in T cells. PLoS ONE. 2010;5:e8774. doi: 10.1371/journal.pone.0008774. [DOI] [PMC free article] [PubMed] [Google Scholar]
- 30.Scandella E, Men Y, Gillessen S, Forster R, Groettrup M. Prostaglandin E2 is a key factor for CCR7 surface expression and migration of monocyte-derived dendritic cells. Blood. 2002;100:1354–1361. doi: 10.1182/blood-2001-11-0017. [DOI] [PubMed] [Google Scholar]
- 31.Goodwin JS, Bankhurst AD, Messner RP. Suppression of human T-cell mitogenesis by prostaglandin. Existence of a prostaglandin-producing suppressor cell. J. Exp. Med. 1977;146:1719–1734. doi: 10.1084/jem.146.6.1719. [DOI] [PMC free article] [PubMed] [Google Scholar]
Associated Data
This section collects any data citations, data availability statements, or supplementary materials included in this article.