

Abstract
A detailed investigation of the conformational properties of all the biologically relevant O-glycosidic linkages using the Hamiltonian replica exchange (HREX) simulation methodology and the recently developed CHARMM carbohydrate force field parameters is presented. Fourteen biologically relevant O-linkages between five sugars, N-acetylgalactosamine (GalNAc), N-acetylglucosamine (GlcNAc), D-glucose (Glc), D-mannose (Man) and L-fucose (Fuc) and the amino acids Ser and Thr were studied. The force field was tested by comparing the simulation results of the model glycopeptides to various NMR 3J couplings, NOE distances and data from MD with time-averaged restraints (tar-MD). The results show the force field to be in overall agreement with experimental and previous tar-MD simulations, although some small limitations are identified. An in depth hydrogen bond and bridging water analysis revealed an interplay of hydrogen bonding and bridge water interactions influencing the geometry of the underlying peptide backbone, with the O-linkages favoring extended β-sheet and PPII conformations over the compact αR helical conformation. The newly developed parameters were also able to identify hydrogen bonding and water mediated interactions between O-linked sugars and proteins. These results indicate that the newly developed parameters in tandem with HREX conformational sampling provide the means to study glycoproteins in the absence of targeted NMR restraint data.
Keywords: Molecular Dynamics, O-Glycan, Force Field, CHARMM, Glycoprotein
Introduction
Glycosylation is one of the most abundant posttranslational modifications of proteins. It involves the covalent attachment of carbohydrates to the side chains of either asparagine (N-linked) or Ser or Thr (O-linked).1 Glycans attached to proteins can have a wide variety of roles ranging from processes such as protein folding and trafficking, immune recognition, and developmental regulation.2,3 Among the two types of glycosidic linkages N-glycosylation is well defined and occurs between a core β-N-acetylglucosamine (GlcNAc) and asparagine residues embedded in the consensus tripeptide sequence Asn-Xxx-Ser/Thr, Xxx being any amino acid but proline.4-7 On the other hand O-glycosidic linkages, which occur between different carbohydrate moieties and Ser or Thr, show no particular amino acid sequence preference.8
Among the various O-linkages the most prevalent type is the linking of N-acetylgalactosamine (GalNAc) in a α-anomeric configuration to the β-hydroxyl group of either Ser or Thr. 9 This type of glycosylation is commonly present in mucin type structures. Other O-linked glycosylations include the β-O-N-Acetylglucosamine (GlcNAc) modification of cytosolic and nuclear proteins, 10-14 α-O-linked glycosylation by L-fucose (Fuc) and β-O-linked glycosylation by D-glucose (Glc) in EGF-like repeats on the transmembrane protein Notch and its cognate ligands, 15-21 and α-O-linked mannose (Man) modifications in yeast. 22,23
NMR studies have shown that the O-linkages bias the adjacent peptide backbone towards an extended conformation, with the amount of perturbation due to the carbohydrate moiety varying among each case. 24-26 Studies also suggest that O-glycosylation may have no effect on the peptide backbone conformation in the absence of amide groups on the sugar moiety. 27 These results highlight the chemical diversity of the O-linkages and their potential impact on local protein backbone conformation, both of which will impact the biological function of O-linked glycoproteins.
Due to the absence of high resolution crystal structures of O-linkages in glycoproteins the structural characteristics of these linkages are not well understood. NMR experiments and CD data provide insights into the properties of the O-linkages, though the results do not give direct structural results. A general methodology adopted in NMR experiments is the determination of the 3J coupling constant associated with adjacent hydrogen atoms. Dihedral values back calculated from the 3J coupling data along with mean distances derived from the NOE data are then used as restraints for molecular dynamics (MD) or Monte-Carlo (MC) simulations to derive an ensemble of structures that satisfy the restraints. These structures are then analyzed to understand the structural properties of these linkages and the associated peptide moiety. 24-33 Such MD simulations targeting experimental restraints have been referred to as targeted MD simulations (tar-MD). However, with increasing size of the protein the NMR spectrum becomes overcrowded thereby hindering the determination of residue specific 3J coupling constants and NOE data. To this end MD simulations accounting for the conformational sampling of the O-linkages in tandem with accurate force fields to describe the O-linkage geometry as well as the associated saccharides and polypeptide can provide atomic level-of-detail properties such as structure, dynamics, and thermodynamics.
In an ongoing effort to enable the atomic-level modeling of a wide variety of carbohydrates in an aqueous environment and interacting with other biopolymers such as proteins, nucleic acids, and lipids, our laboratory has undertaken the development of a comprehensive force field for carbohydrates 34-38 in the context of the CHARMM additive biomolecular force field.39 To this end we have recently developed parameters to extend the carbohydrate force field to model the O- and N- glycosidic linkages to proteins. The aim of this study is to use the newly developed parameters to characterize the structure and properties of O-glycosidic linkages in the absence of restraint data, thereby further validating the parameters as well as enabling the molecular modeling of larger glycoproteins.
In the present work standard MD and Hamiltonian replica exchange (HREX) simulations have been performed on 14 glycoprotein dipeptides, which are representative of all the naturally occurring O-linkages. Recent combined NMR and tar-MD studies of α,β-GalNAc, β-GlcNAc and β-Glc Ser/Thr dipeptides by Corzana and co-workers were used as the primary target data to compare and validate our force field and simulation methodology. 40,41,42,43 Analysis characterized the presence and absence of key hydrogen bond interactions which influence the overall structure of the glycopeptides. A detailed analysis of the solvent structure was preformed to identify bridging solvent interactions, which are also shown to bias the conformation of the underlying peptide backbone. Validation was also extended to the glucoamylase from Aspergillus awamori var. X100 (PDB id: 3GLY) to confirm the ability of the force field to identify carbohydrate-protein direct and water-medicated interactions present in the crystal structure.
Methods
Models Compounds
Glycoprotein dipeptides were chosen to study the conformational behavior of Ser and Thr O-glycosidic linkages (Figure 1). The five sugars, N-acetylgalactosamine (GalNAc), N-acetylglucosamine (GlcNAc), D-glucose (Glc), D-mannose (Man) and L-fucose (Fuc), known biologically to form the O-glycosidic linkages have been studied in this work. From previous studies it is known that all the sugars do not adopt the same anomeric configuration at the O-linkage. GalNAc and Man are known to adopt both the α and β configurations, GlcNAc and D-Glc show a preference for the β-configuration, while L-Fuc shows a preference for the α configuration. 1-3,8,9,44-48 To comprehensively sample these linkages a total of 14 glycoprotein dipeptides were selected for the present study. In addition, the crystal structure of glucoamylase from Aspergillus awamori var. X100 (PDB id: 3GLY) was simulated as a test of the force field on a large glycoprotein.
Figure 1.
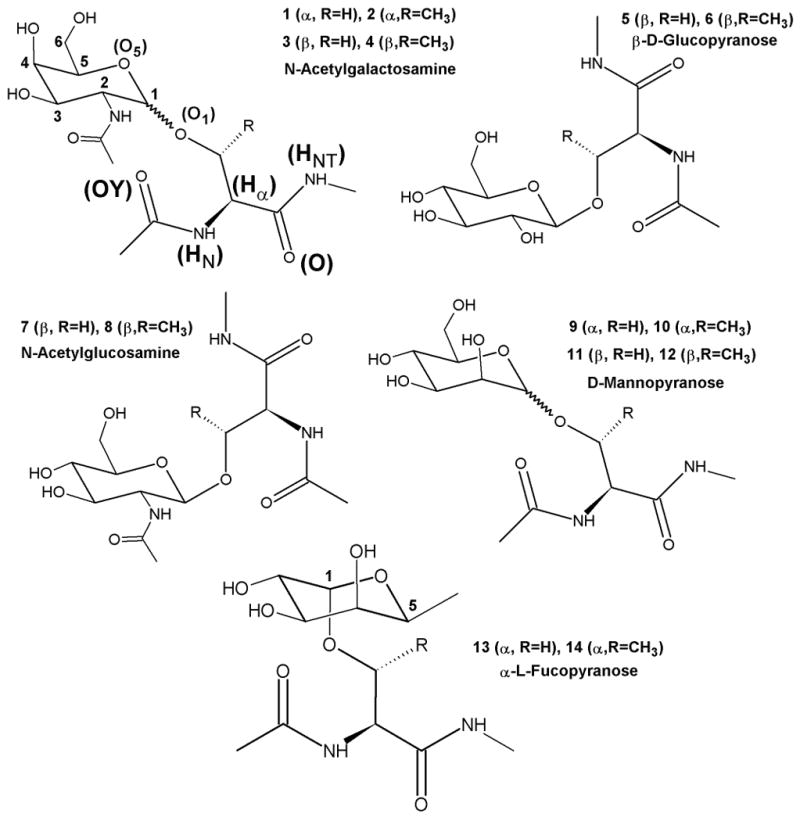
Molecular structures of the O-linked model glycopeptides showing the atom names and atom numbering.
Molecular dynamics
MD simulations were performed with the CHARMM program. 39 The CHARMM22 protein force field49 with CMAP (dihedral correction map), 50 the CHARMM carbohydrate force field 34-38 and the modified TIP3P water model51 were used to represent the model glycopeptides in solution. Initial geometries of the model compounds were generated from the topology information present in the force field, which has been recently extended to treat O-glycosidic linkages. For both GalNAc and GlcNAc linkages an initial anti configuration was chosen for the H-N-C2-H2 dihedral in accordance with NMR studies. These initial geometries were subjected to a 1000-step steepest descent (SD) minimization followed by an adopted basis Newton–Raphson (ABNR) minimization to a force gradient tolerance of 10-6 kcal/mol/Å. 52,53 The minimized geometries of the glycopeptides were then immersed in a preequilibrated cubic water box of size 32 Å × 32 Å × 32 Å. The size of the water box was selected based on the condition that it extend at least 10 Å beyond the non-hydrogen atoms of the glycopeptides. Water molecules with the oxygen overlapping with the non-hydrogen solute atoms within a distance of 2.8 Å were deleted. For all of the subsequent minimizations and MD simulations, periodic boundary conditions were employed using the CRYSTAL module implemented in the CHARMM program. Before performing an equilibration, the water molecules were allowed to rearrange around the fixed solute atoms by a short minimization cycle of 50 SD steps followed by 50 ABNR steps. Next, with a mass-weighted harmonic restraint of 1.0 kcal/mol/Å on the non-hydrogen atoms of the glycopeptides, the systems were subjected to a 50 step SD minimization followed by a 50 step ABNR minimization cycle. This was followed by a 100 ps simulation in the NVT ensemble with the same harmonic restraints to equilibrate the solvent molecules around the glycopeptides. A 200 ps NPT simulation at 1atm and 298K followed the NVT simulation, wherein all the previous restraints were removed. In the NPT simulation the center of mass of the glycoprotein was restrained near the origin by using the MMFP module54 in CHARMM using a harmonic restraint of 1.0 kcal/mol/Å applied to the center of mass of the glycopeptides. This was done to keep the glycoprotein from drifting out of the simulation box. This option was also retained in the production runs. The electrostatic interactions were treated via the particle mesh Ewald method with a real space cutoff of 12 Å, kappa value of 0.34 Å-1 and a 6th order spline. 55 Nonbond interaction lists were updated heuristically out to 16 Å with a force switch smoothing function from 10 Å to 12 Å used for the LJ interactions. 56 Production runs were carried out for 20 ns in the NPT ensemble with the Leapfrog integrator employing an integration time step of 2 fs, while the SHAKE algorithm was used to constrain all covalent bonds involving hydrogen atoms. 57 The temperature was maintained at 298K by a Nose-Hoover heat bath with a thermal piston parameter of 2000 kcal mol−1 ps2. 58 Constant pressure of 1 atm was controlled using the Langevin piston with a mass of 364 amu (ie. Pmass = integer(system mass/50.0). 59 Coordinates were saved every 1 ps from the MD simulations for all subsequent analyses.
Hamiltonian Replica Exchange (HREX)
In a standard MD simulation of a biological or chemical system the simulation often does not explore all the available conformational states. This is due to limitations of MD simulations to transverse high-energy barriers. To address this issue replica-exchange molecular dynamics (REMD) presents an alternative approach that combines perturbation methods that facilitate conformational sampling with a Metropolis based, multiple-simulation strategy. 60-62 In its most common implementation conformational sampling of the molecular system is modified through temperature (t-REMD), which is gradually increased (T0, T1, T2, …TN) across an ensemble of MD simulations (or replicas). 63,64 Each of the simulations then exchange conformations at selected time intervals according to a Metropolis criterion, thereby facilitating the sampling of conformational space over that which would occur at room temperature in the same length simulations. Importantly, the Metropolis exchange criterion based on the probabilities as defined in equations 1 through 3 assures that the ground state (i.e. room temperature) replica reproduces a correct ensemble.
| (1) |
| (2) |
| (3) |
with β = 1/RT (R: gas constant and T: temperature) and E(r) representing the potential energy of the system for a given configuration, rj or ri, from replicas i and j, respectively.
However, the general applicability of t-REMD is limited by differences in the free-energy landscape as a function of temperature requiring small temperature differences between adjacent replicas in explicit solvent simulations, thereby requiring an excessive number of replicas, as well as the potential for sampling of statistically insignificant conformational states. 65 To address this HREX is an alternate method for conformational sampling, in which a gradual perturbation is applied to the potential energy function across the system of replicas. HREX has been shown to be efficient when compared to t-REMD for condensed phase simulations. 66-70 The difference between HREX and t-REMD methods lies in the definition of the change in energy used in the Metropolis acceptance criterion. In HREX instead of simulating different replicas at different temperatures they are simulated using different Hamiltonians (H0, H1, H2, …HN). The replica exchanges between neighboring simulations are accepted or rejected according to the energy difference between neighboring configurations at the same temperature using the force field for replica j (Ej) minus the force field for replica i (Ei) where the energy differences in equations 1 and 2 is defined as
| (4) |
Various HREX strategies have been applied to study biomolecular conformations, ranging from bond based 71,72 biasing potentials to dihedral based biasing potentials. 73-75 In this study we use a combination of the two-dimensional (2D) dihedral grid-based energy correction map (CMAP) extension of the CHARMM force field and a Saxon-Wood potential as the biasing potential across the different replicas.50 Two CMAP biasing potentials are used, corresponding to ϕs/ψs and ϕ/ψ to sample the conformational space of the glycopeptides around the O-glycosidic linkage and the protein backbone (Figure 2). The Saxon-Wood potential is used to enhance conformational sampling about the χs dihedral. Addition of the biasing potentials during a simulation lowers the energy barriers for the involved dihedrals, thereby enabling enhanced conformational sampling.
Figure 2.
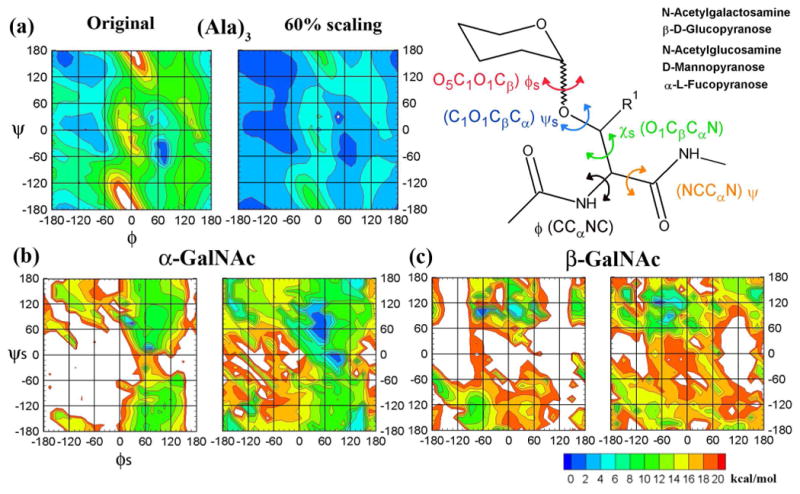
Definitions of the dihedrals investigated in this work. (a) (Ala)3 ϕ/ψ MM energy surfaces. ϕs/ψs MM energy surfaces for (b) Ser α-GalNAc and (c) Ser β-GalNAc. In all figures the left panel depicts the un-scaled energy surface while the right panel depicts the scaled energy surface using a 60% scaled bpCMAP.
Biasing potential CMAPs (bpCMAP) used to perturb the Hamiltonian in each replica were designed to create a “flat” 2D energy surface for the fully perturbed state (ie. the change in potential energy as a function of dihedrals is essentially zero for the entire surface). To construct the bpCMAPs we obtained the 2D MM energy profiles at a resolution of 15° for the full range of the ϕs/ψs dihedral angles for the glycosidic linkages of each of the glycopeptide systems. This was done to include the influence of the various intramolecular interactions between the different sugar units (GalNAc, GlcNAc, Glc, Man and Fuc) and the peptide backbone. We observed that the difference between the intramolecular interactions was also dependent on the configuration at the anomeric center. This fact is illustrated by the 2D MM energy surfaces of the ϕs/ψs dihedral angles for the α and β anomers of GalNAc presented in Figure 2; the global minima lie in different regions for each surface, thereby requiring individual CMAPs for the HREX methodology. Thus, an independent bpCMAP was generated for each system yielding 14 different bpCMAPs, wherein each bpCMAP, in combination with the underlying MM ϕs/ψs 2D energy surface, yields flat 2D energy surfaces for the linkage. For the ϕ/ψ 2D surfaces in the peptide backbone, the published CHARMM CMAPs for the alanine and glycine dipeptides were altered to produce the bpCMAP that yields the corresponding flat ϕ/ψ 2D surfaces for HREX. This was done so that the scaled CMAPs used in this study could be used for larger glycopeptide systems and still remain in agreement with the philosophy of the original CMAP correction in which the alanine and glycine maps were used as the underlying correction for the other amino acids except proline. 50
To arrive at the bpCMAPs for the different replicas the underlying MM 2D energy profiles were offset by setting the global minimum to 0 kcal/mol. The modified energy surfaces were then used to generate the 8 CMAPs for the 8 replicas by multiplying the scaled energy values at each grid point of the bpCMAP by a scaling factor (n × -0.15), where n was varied from 0 to 7. Analysis of the rescaled (modified) energy surfaces show the influence of the scaling factor is maximal for the high-energy regions and minimal for the low energy regions, thereby leading to a gradual lowering of the energy barrier in subsequent replicas. Thus, the first replica with 0% scaling represents a simulation with no perturbing potential and the subsequent replicas are under an influence of 15%, 30%, 45%, 60%, 90% and 105% of the respective bpCMAPs (Figure 2).
For the χs dihedral the Saxon-Wood potential was utilized with a scaled force constant term as the biasing potential across the replicas.
| (5) |
where h = (n × -0.75) kcal/mol, n going from 0 to 7 for replicas 1 to 8, p1 = 0.1, p2 = 0.3 and θref = 30° (α-GalNAc), 45° (β-GalNAc, β-GlcNAc, β-Glc, β-Man) and 60° (α-Man, α-Fuc). Where, θref was set to the local minimum from a dihedral scan about χs in each system.
The REPDSTR module of a modified version of CHARMM c36a2 was used to perform the HREX simulations.76 The HREX simulations were started from the equilibrated coordinates obtained after the 200 ps unbiased NPT simulation at 1atm and 298K. The same MMFP restraints as those used in the production runs were utilized in the HREX runs to constrain the glycoprotein at the center of the simulation box. An exchange between neighboring replicas was attempted every 1000 MD steps and the coordinates were saved every 1 ps. Each replica was simulated for 10 ns and the trajectories from the final 10 ns of the first replica (unbiased, ground state replica) were used for subsequent analysis.
Glycoprotein Simulation
The crystal structure of glucoamylase from Aspergillus awamori var. X100 (PDB id: 3GLY) solved at a resolution of 2.20 Å was chosen to extend the results from the present study of model glycopeptides to a glycoprotein in aqueous environment.77 Scripts obtained from CHARMM-GUI and modified accordingly to include the O-linkages were used to setup the simulation.78,79 Coordinates of the crystal structure were retrieved from the PDB (Protein Data Bank). 80 The Reduce software was used to place missing hydrogen positions and to choose optimal Asn and Gln sidechain amide and His sidechain ring orientations.81 Patch residues were used to incorporate disulfide bonds and O-glycosidic linkages between Ser or Thr residues and the relevant sugar units. Crystallographic water molecules, counter ions and heteroatoms were included in the simulation system. The built geometries were then immersed in a pre-equilibrated cubic water box that extended at least 10 Å beyond the non-hydrogen atoms of the protein structure, which resulted in a simulation box of size 90 × 90 × 90 Å3. Water molecules with the oxygen overlapping with the non-hydrogen solute atoms within a distance of 2.8 Å were deleted. Based on the overall charge of the system, 29 potassium ions were added to neutralize the system. The whole system was then subjected to the same equilibration protocol used to setup the glycopeptide systems, which included a 100 ps NVT simulation followed by a 200 ps NPT simulation. The equilibrated structures were then used for a 16 ns production simulation performed using NAMD version 2.7b1.82 A Langevin coupling coefficient of 1 ps−1 with a temperature bath of 298 K was applied to all atoms to achieve constant pressure. Piston oscillation period of 200 fs and barostat damping time scale of 100 fs were used to maintain a piston pressure of 1 atm. The last 10 ns of the simulation trajectory were used for the analyses.
Karplus Equations (3J Coupling Constants)
3J coupling constants about the dihedral torsions C-N-Cα-C, H-N-C2-H2 (for α/β-GalNAc and β-GlcNAc) and N-Cα-Cβ-O1 were calculated from the simulations to compare them with experimental values. The respective dihedral value associated with the proton-proton coupling was calculated every 1 ps for each of the production runs amounting to 10,000 points (10 ns) and 20,000 points (20 ns) for the HREX and independent MD simulations, respectively. The 3J coupling constants were then calculated from the dihedral values of each snapshot using the following Karplus equations.
| (6)83 |
| (7)84 |
| (8)85 |
Experimental J-couplings measured at room temperature inherently include a certain degree of averaging of the torsion angles about the mean positions. The effect of Gaussian fluctuations of the torsion angle with a variance σ2 on the 3J coupling can be described by a Karplus equation with modified coefficients.
| (9)86 |
where A, B and C are the coefficients of the original Karplus equation and θ0 is the average torsional angle. The analyses of the 3J coupling constants were performed both in the presence and the absence of the motional averaging.
2D radial pair distribution
2D radial pair distributions, g(r1, r2), were calculated to analyze the localized water densities, in particular the bridging water molecules between the carbohydrate and peptide units. The 2D radial pair distribution function g(r1, r2) gives the probability of finding an atom, in our case the water oxygen, at a distance r1 and r2 from two selected solute atoms, relative to the probability expected for a random distribution.
| (10) |
where N(r1,r2) is the number density, ρw is the water density and Vintersect is the intersection volume. We calculate Vintersect and g(r1,r2) using the formalism suggested by Engelsen and co-workers which has been successfully used to identify bridging water sites in carbohydrates. 87-89
Results and Discussion
In the present study the ability of the newly developed CHARMM carbohydrate force field in combination with the HREX sampling method to reproduce solution geometries of the glycopeptides is tested followed by additional validation on the target glycoprotein, glucoamylase. The major validation data are NMR J-coupling constants and NOE data. Emphasis on adequate sampling of conformational space involved both extended MD and HREX simulations; results presented below are primarily from the HREX simulations. Comparison of selected MD and HREX simulations results highlight the advantages of the HREX methodology. Notably, it is shown that the applied sampling method is able to reproduce previously published tar-MD results, thereby making it a viable option to study larger glycoprotein systems in the absence of restraint data. While available tar-MD studies only included a subset of the biologically known O-linkage geometries, the present study includes all the biologically known glycopeptide linkages (14 model systems), thus performing a comprehensive study of O-linkages. Notably, results from these simulations show that the O-linkage geometry is dependent on the interplay between intramolecular hydrogen bonding and bridging waters, interactions that are present in both glycopeptides and glycoproteins.
3JHNHα couplings
3JHNHα coupling constants calculated from both MD and HREX simulations by applying the appropriate Karplus equation (eqn 6) are summarized in Table 1. The 3J coupling constants obtained by averaging over the whole simulation trajectory agree well with the experimentally observed values. Over the eight systems for which experimental J-couplings exist, the RMS differences are 0.55 or less and average differences are 0.09 or less; the largest discrepancies occurs with 1 followed by 2 with the six remaining systems in excellent agreement with experiment (maximum difference 0.6). The α-linkages show the largest discrepancy with the experimental results while the β-linkages are in good agreement. The 1H NMR experiments also predict the 3J coupling constant associated with the C-N-Cα-C dihedral to be lower for Ser linkages (odd-numbered systems) when compared to the Thr linkages (even-numbered systems).40-42 The force field is able to capture this trend. To gain insight into the origins of these trends we plot the distribution of the C-N-Cα-C dihedral versus the calculated 3J coupling constant associated with it obtained from the HREX simulations for compounds 1 to 4 in Figure 3a to 3d. Each panel also includes the 3J values from experimental studies (solid line) and average 3J values from HREX (dashed line). The ϕ (C-N-Cα-C) dihedral samples three major conformations distributed around -150°, -60° and 60° for the Ser linkage (1), while it samples only conformations distributed around -150° and -60° for the Thr linkage (2). The effect of this conformational preference is clearly seen on the evaluated 3J coupling constant values plotted in Figure 3a and 3c for 1 and 3, respectively. We observe that the sampling of conformations around 60° leads to an additional distribution in the ϕ vs 3J plot with a maximum 3J value of 6.3 Hz. This additional distribution causes an overall decrease in the calculated average 3J value for the Ser linkages, while the absence of this distribution (Figure 3b and 3d) results in a higher average 3J value for the Thr linkages. NMR studies on larger glycoprotein systems find that the 3J value for the Ser-α-GalNAc linkage vary in the range 6.5-7.5 Hz. 24,25,32 The calculated 3J value for the Ser linkage (7.7 Hz) is close to the experimental range. On the other hand for the Thr-α-GalNAc linkage the experimental studies always find the 3J coupling constant to lie in the range 8.6-9.2 Hz, suggesting a trans relationship between these protons or a dihedral distribution lying between -160° < ϕ < −80°.24,25,32 From the ϕ vs 3J distribution plotted in Figure 3b for Thr-α-GalNAc (2) it may be seen that the tail regions of the plot for ϕ < -160° and ϕ>−80° are responsible for bringing down the overall calculated average. The average 3J value excluding this region is found to be 9.0 Hz, which is in better agreement with the experimentally observed value of 8.8 Hz; the dihedral distribution lies in the favorable -160° < ϕ < −80° trans region for 74% of the total simulation time. Thus, for the majority of the simulations the experimentally observed conformational space is being sampled.
Table 1.
Sampling and associated J-coupling constants of the C-N-Cα-C (ϕ) dihedral in the fourteen glycopeptides. J-coupling constants in Hz.
| Comp | Expt 3J Coupling | MD (20ns) |
HREX (10ns) |
MD (20ns) |
HREX (10ns) |
MD (20ns) |
HREX (10ns) |
|||||
|---|---|---|---|---|---|---|---|---|---|---|---|---|
| Averaging | Motional Aver | -150a | -60a | 60a | -150a | -60a | 60a | |||||
| 1 | 6.240 | 7.5 | 7.7 | 7.4 | 7.7 | 48.8% | 40.0% | 11.2% | 52.4% | 37.9% | 9.7% | |
| 2 | 8.8 41 | 8.6 | 7.9 | 8.6 | 7.9 | 55.0% | 45.0% | 0.0% | 43.7% | 55.7% | 0.7% | |
| 3 | 6.6 41 | 6.6 | 6.9 | 6.6 | 6.9 | 33.9% | 57.0% | 9.1% | 40.3% | 49.8% | 9.9% | |
| 4 | 7.4 41 | 7.2 | 6.9 | 7.2 | 6.9 | 33.0% | 67.0% | 0.0% | 29.9% | 70.0% | 0.2% | |
| 5 | 6.943 | 7.0 | 7.1 | 6.9 | 7.1 | 48.8% | 39.0% | 12.1% | 50.6% | 41.6% | 7.8% | |
| 6 | 7.543 | 6.9 | 7.0 | 6.9 | 7.0 | 27.2% | 72.8% | 0.0% | 29.7% | 68.3% | 2.0% | |
| 7 | 6.8 42 | 7.3 | 6.8 | 7.3 | 6.8 | 60.8% | 33.1% | 6.1% | 42.1% | 33.7% | 24.2% | |
| 8 | 7.5 42 | 7.2 | 7.2 | 7.2 | 7.2 | 31.8% | 68.2% | 0.0% | 31.8% | 68.2% | 0.0% | |
| 9 | 7.3 | 7.1 | 7.2 | 7.1 | 43.1% | 45.7% | 11.2% | 46.5% | 44.3% | 9.1% | ||
| 10 | 7.4 | 7.6 | 7.4 | 7.6 | 35.4% | 64.6% | 0.0% | 37.0% | 62.7% | 0.2% | ||
| 11 | 7.1 | 7.2 | 7.1 | 7.2 | 54.7% | 33.6% | 11.6% | 58.0% | 31.8% | 10.2% | ||
| 12 | 7.3 | 7.2 | 7.3 | 7.2 | 33.4% | 66.5% | 0.1% | 32.4% | 65.6% | 2.0% | ||
| 13 | 7.1 | 7.2 | 7.0 | 7.1 | 43.7% | 45.0% | 11.3% | 51.8% | 41.8% | 6.5% | ||
| 14 | 7.8 | 7.0 | 7.8 | 7.0 | 35.7% | 64.3% | 0.0% | 27.3% | 72.6% | 0.2% | ||
| RMS Diffb | 0.39 | 0.52 | 0.37 | 0.51 | ||||||||
| Averageb | 0.08 | 0.00 | 0.05 | -0.02 | ||||||||
Distributions binned from -180° to -100°, -100° to 0°, and 0° to 180°.
Root-mean-square (RMS) and average difference over the 8 systems for which experimental J-couplings are available.
Figure 3.
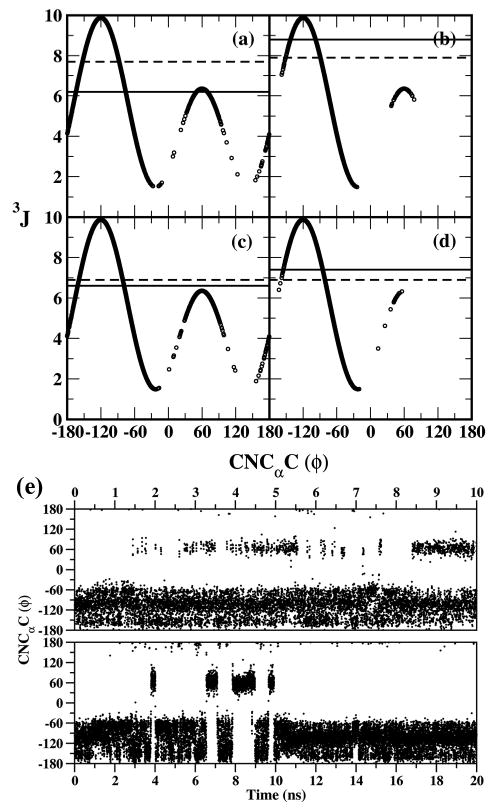
C-N-Cα-C (ϕ) vs associated 3JHNHα from HREX simulations for (a) 1, (b) 2, (c) 3 and (d) 4. The 3J values from experimental studies (solid line) and average 3J values from HREX (dashed line) are included in each panel. (e) Time series of the C-N-Cα-C dihedral for comp 1 from HREX (upper panel) and MD (lower panel) simulations.
From the distribution of ϕ/ψ (ϕ CNCαC, ψ NCαCN) dihedrals observed in protein structures90 it is known that a ϕ value of -150° is generally observed in extended β sheet or random coil δ geometries, a ϕ value of -60° corresponds to either an extended PPII geometry or a right handed α helical geometry (αR) and a ϕ value of 60° generally corresponds to a left handed α helix (αL). Thus, from the analysis of the 3J coupling data it is evident that Thr linkages can sample β sheet, δ coil, PPII or αR geometries, while Ser can also adopt the αL geometries. The population distributions of the ϕ dihedral around the three favorable conformational basins (-150°, -60° and 60°) are summarized in Table 1. Ser linkages significantly adopt the ϕ ∼ 60° conformation while none of the Thr linkages adopt this conformation. On comparison we observe that both MD and HREX simulations correctly predict the conformational preference and dihedral distributions (Table 1). Better conformational sampling is achieved in the HREX compared to the single MD simulations. This is illustrated by comparing the time series for the C-N-Cα-C dihedral for 1 plotted in Figure 3e for both HREX and MD simulations. 454 transitions occur between the αL and αR conformational bins for the HREX simulation when compared to 15 transitions between the same two bins in the standard MD simulation, indicative of the enhanced sampling in HREX simulations. In the rest of the paper we primarily discuss the results from the HREX simulations. Additional results from standard MD simulations are reported in the supporting information file.
ϕ/ψ Distribution
While 3JHNHα provides partial insight into the conformational preference of the protein backbone, the ϕ/ψ distributions gives direct insight into the backbone conformation. 2D plots of the relative free energy as a function of ϕ and ψ for all the compounds from HREX simulations are presented in Figure 4. Three major global minima are identified from the ϕ/ψ plots at -75°/-45° (6, 8, 9, 10, 12), -75°/135° (3, 4, 5, 7, 13) and -105/0° (1,2). Compound 11 and 14 are found to be outliers with global minima located at -165/150° and -105/-15°. Thus, the O-linkages prefer three well defined structural conformational basins corresponding to the β-sheet (ϕ/ψ = -135/135°), PPII (ϕ/ψ = -75°/150°) and αR-helical (ϕ/ψ = -60°/-45°) geometries. Ser O-linkages also sample the αL-helical (ϕ/ψ = 60°/45°) geometry. In addition, the Thr linkages prefer the PPII geometry over the β-sheet geometry, highlighting another structural difference between Ser and Thr linkages. In all cases the O-linkages also populate the flexible random coil δ region of the Ramachandran surface. Thus, the HREX simulations are able to identify various conformational regions sampled by the O-linkages that are consistent with published tar-MD and NMR studies. 24-26,29,40-43. In Figure S1 of the supporting information presents the relative probabilities of each region of the ϕ/ψ space. It is of interest to note that in tar-MD studies, performed with the GLYCAM force field, removal of targeted restraints resulted in conformations that did not agree with the NMR data. This was due to oversampling of the αR-helical conformations and a complete loss of the extended geometries (PPII and β-sheet conformations). In comparison our simulations are able to capture conformations that agree with the NMR data in the absence of restraint data, highlighting the ability of the force field to sample the experimentally observed conformations.
Figure 4.
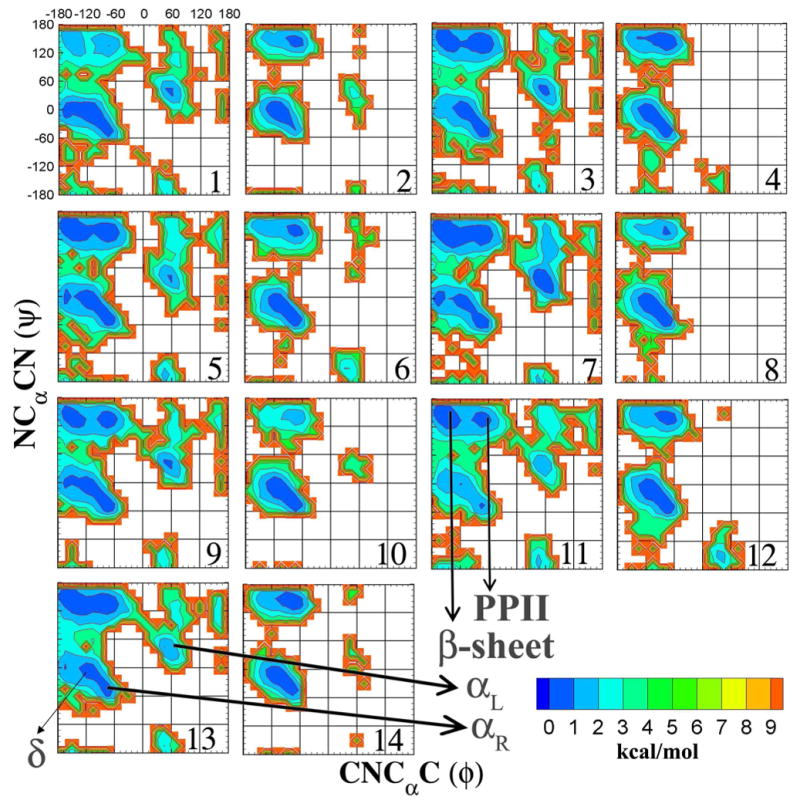
Two-dimensional relative free energy surfaces for ϕ(CNCαC) versus ψ(NCαCN) dihedrals, given in degrees, calculated from HREX simulations for all the model glycopeptide systems. The various significant regions of the ϕ/ψ plot have been labeled. Relative free energies are calculated from the natural logarithm of the relative probability and are given in kcal/mol.
NOE distances
In addition to the 3JHNHα coupling data, tar-MD simulations and NMR refinement protocols use NOE derived distance restraints to refine an ensemble of structures. A key experimental observation from NMR studies of O-linkages is the presence of strong d(Hα,HNT) NOE in comparison to the weak d(HNT,HN) NOE (hydrogen atoms naming scheme illustrated in Figure 1).40-43 The longer distance between the consecutive amide hydrogens is indicative of extended conformations of the peptide backbone. 91 In Table 2 the mean distances d(HN,HNT), d(Hα,HNT) and d(Hα,HN) calculated as a <r-6>-1/6 average from HREX simulations are summarized. The CHARMM carbohydrate parameters capture the correct conformational preference of the backbone with d(HN,HNT) > d(Hα,HNT) in most cases. Since experimental NOE signal strengths are dependent on the proximity of the spin centers, to better compare the experimental results with the computational studies the distance distributions of d(HN,HNT), d(Hα,HNT) and d(Hα,HN) were analyzed and are plotted in Figure S2 of the supporting information. Both the d(HN,HNT) and d(Hα,HNT) distributions exhibit a bimodal distribution while d(Hα,HN) predominantly exhibits a single mode.
Table 2.
NOE derived distances from NMR experiments and mean Proton-Proton distances from HREX simulations calculated as a <r-6>-1/6 average for all model glycopeptide systems (compounds 1 to 14). Sampling of the proton-proton distances exhibiting bimodal distribution from HREX simulations.
| Comp | Experiment | HREX | d(HN,HNT) | d(Hα,HNT) | |||||||
|---|---|---|---|---|---|---|---|---|---|---|---|
| d1a | d2a | d3a | d1a | d2a | d3a | <3.6Å | >3.6Å | <2.9Å | >2.9Å | ||
| 1 | 2.9 40 | 2.3 40 | 2.9 40 | 2.28 | 2.78 | 2.73 | 81.9% | 18.1% | 26.4% | 73.6% | |
| 2 | 2.841 | 2.441 | 2.941 | 2.51 | 2.69 | 2.88 | 71.3% | 28.7% | 30.3% | 69.7% | |
| 3 | 2.941 | 2.241 | 2.641 | 2.67 | 2.46 | 2.70 | 45.6% | 54.4% | 61.3% | 38.7% | |
| 4 | 3.041 | 2.341 | 2.841 | 2.66 | 2.52 | 2.86 | 50.5% | 49.5% | 49.7% | 50.3% | |
| 5 | 2.743 | 2.343 | 2.643 | 2.54 | 2.45 | 2.74 | 44.0% | 56.0% | 60.7% | 39.3% | |
| 6 | 2.343 | 2.543 | 2.843 | 2.53 | 2.7 | 2.82 | 69.1% | 30.9% | 29.6% | 70.4% | |
| 7 | 3.042 | 2.342 | 2.742 | 2.58 | 2.44 | 2.55 | 48.1% | 51.9% | 69.1% | 30.9% | |
| 8 | 2.842 | -- | -- | 2.45 | 2.84 | 2.87 | 82.0% | 18.0% | 18.4% | 81.6% | |
| 9 | 2.47 | 2.49 | 2.72 | 55.0% | 45.0% | 53.0% | 47.0% | ||||
| 10 | 2.39 | 3.02 | 2.88 | 91.0% | 9.0% | 9.9% | 90.1% | ||||
| 11 | 2.89 | 2.37 | 2.71 | 26.4% | 73.6% | 79.1% | 20.9% | ||||
| 12 | 2.53 | 2.67 | 2.83 | 67.0% | 33.0% | 31.5% | 68.5% | ||||
| 13 | 2.64 | 2.4 | 2.76 | 36.5% | 63.5% | 69.1% | 30.9% | ||||
| 14 | 2.61 | 2.57 | 2.86 | 56.7% | 43.3% | 43.6% | 56.4% | ||||
d1 - d(HN,HNT), d2 - d(Hα,HNT), d3 - d(Hα,HN),
Distances are given in angstroms.
The two modes for d(HN,HNT) are centered about ∼2.50 Å and ∼4.25 Å representative of compact and extended conformations. Population analyses for these two distributions are summarized in Table 2. From the population analysis we find that the glycopeptides linkages sample the compact and extended regions about 59% and 41%, respectively. However the compact behavior is due to the overpopulation of the δ random coil regions in the flexible di-amide model compounds. Thus, the newly developed parameters capture the balance between the compact and extended conformations. In Table T1 of the supporting information file we summarize the mean distances d(HN,HNT), d(Hα,HNT) and d(Hα,HN) calculated as a <r-6>-1/6 average from standard MD simulations. Results of the population analysis for d(HN,HNT) and d(Hα,HNT) from standard MD simulations are also summarized in Table T1. We observe that even the standard MD simulations capture the correct conformational preference of the backbone with d(HN,HNT) > d(Hα,HNT) in most cases. However, from the population analysis we find that glycopeptides linkages sample the compact and extended regions for about 63% and 37% in standard MD simulations. This indicates a slight shift toward compact regions, which may be due to the fewer transitions between these conformational regions in standard MD simulations when compared to HREX simulations.
ϕs/ψs Distribution
Distributions of the sugar ϕs(O5C1O1Cβ) and ψs(C1O1CβCα) dihedrals for all the model compounds from HREX are presented in Figure 5a and 5b, respectively. The ϕs (O5C1O1Cβ) dihedral is generally very rigid and samples values close to 65° and 70° for the Ser and Thr linkages of the α anomers, and close to -65° and -70° for Ser and Thr linkages of the β anomers. This distribution is in good agreement with the exo-anomeric effect.92 This behavior is also consistent with results from tar-MD simulations.40-43 On the other hand the sugar ψs dihedral is more flexible and populates different conformational basins for different linkages. For the Ser linkages three major conformational basins are sampled centered at -120° (Glc, GlcNAc, Fuc) -100° (β-GalNAc, α/β-Man) and 110° (Glc, GlcNAc, α-Man, Fuc) while for α-GalNAc and α-Man the peaks are shifted to 120° and 100° respectively. Note that the ψs dihedral distributions for the Ser-linkages (1, 3, 5, and 7) are slightly shifted when compared to the results from the previously reported tar-MD simulations which find the distribution to be centered on ψs∼180°.24-26,29,40-43 In both the tar-MD and our simulations the linkages sample the anti conformation. These slight differences in the distribution are suggested to arise from the use of the dihedral restraint on the Cα-Cβ dihedral in the tar-MD simulations which in turn affects the Cβ-O1 dihedral distribution. For the Thr linkages three well-defined conformational basins are sampled with peak maximums at 120° for the α linkages (α-GalNAc, α-Man), 130° for the β linkages (GalNac, Glc, GlcNac, Man) and 160° for the α-Fuc linkage.
Figure 5.
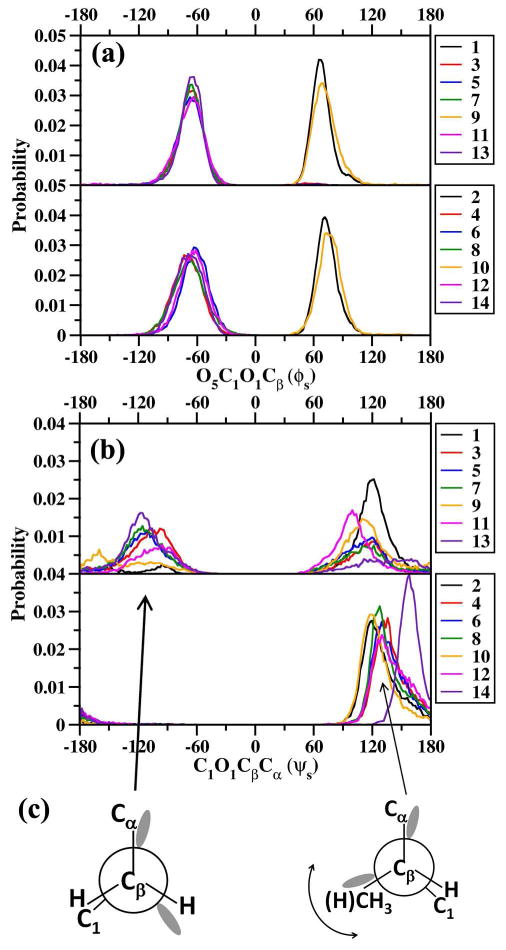
(a) O5C1O1Cβ(ϕs) and (b) C1O1CβCα (ψs) dihedral probability distributions from HREX simulations. For both dihedrals the distributions from Ser linkages (odd-numbered systems) are depicted in the upper panel and the distributions from Thr linkages (even-numbered systems) in the lower panel. (c) Newmann projections illustrating the major ψs conformations for both Ser and Thr linkages.
We also observe that the CH3-Cβ-O1-C1 dihedral is always close to 60°, ie the methyl group is always in a staggered conformation with respect to the C1 carbon of the sugar (Figure 5c). It should be noted that the ϕs and ψs distributions differ between α/β-GalNAc and β-GlcNAc, indicating different secondary interaction in these N-acetlyamino sugars.
3JHNH2 Coupling Constants
The 3J coupling data for the H-N-C2-H2 dihedral, which is unique to the GalNAc (1 to 4) and GlcNAc (7 and 8) glycopeptides, was analyzed. Calculated 3JHNH2 coupling constants from the HREX simulations using equation 7 are summarized in Table 3. The 3J coupling constant values for the β substitutions (3, 4, 7 and 8) are in better agreement with the experimental values when compared to the α substitutions (1 and 2). From the population analysis also presented in Table 3, it is observed that the β substitutions prefer either the eclipsed or anti conformations with no sampling of the intermediate conformations. To gain insight into the origins of these trends the distribution of the H-N-C2-H2 dihedral versus the calculated 3J coupling constant associated with it are presented for compounds 1, 2, 3, 4, 7 and 8 in Figure 6a to 6f It is again evident that intermediate conformations cause the significant decrease in the overall 3J coupling value for 1 and 2. The mean 3J coupling values excluding the intermediate region were evaluated to be 8.5 Hz and 9.0 Hz, which are in better agreement with the experimental values of 9.2 Hz and 9.5 Hz for 1 and 2, respectively. From the population distributions tabulated in Table 3 it may be seen that the intermediate conformations are sampled for only 11% and 8% of the overall simulation time for 1 and 2, respectively. Thus, the systems are predominately sampling conformations that are in agreement with experimental data. From an analysis of the trajectories it is evident that sampling of the intermediate conformations is due to the formation of a weak intra-molecular hydrogen bond or water mediated hydrogen bond (water bridge) between the amide hydrogen (HN) of the acetlyamino (-NHCOCH3) side chain and the O3-HO3 hydroxyl. The 3JHNH2 coupling constants from standard MD simulations using equation 7 and the associated population distributions are summarized in Table T2 of the supporting information. The standard MD simulations are also in close agreement with the experimental 3JHNH2 coupling constants with an average RMS difference of 0.9. For 1 and 2 the intermediate conformations are sampled for 14% and 7%, respectively, from standard MD simulations compared to 11% and 8% from HREX simulations. This indicates that even the standard MD simulations predominantly sample conformations that are in agreement with experimental data.
Table 3.
J-coupling constants and associated sampling of the H-N-C2-H2 dihedrals in the six model glycopeptides with the acetlyamino (-NHCOCH3) side chain.
| Comp | Expt | HREX | Motional Aver | Antia | Inta | Ecla |
|---|---|---|---|---|---|---|
| 1 | 9.240 | 8 | 7.7 | 86.7% | 10.7% | 2.6% |
| 2 | 9.541 | 8.5 | 8.2 | 91.8% | 8.2% | 0.0% |
| 3 | 9.641 | 10.0 | 9.6 | 78.1% | 0.6% | 21.3% |
| 4 | 9.941 | 10.2 | 9.8 | 87.3% | 0.4% | 12.3% |
| 7 | 9.442 | 10.2 | 9.8 | 87.6% | 0.4% | 12.0% |
| 8 | 9.442 | 10.3 | 9.9 | 90.6% | 0.4% | 9.1% |
| RMS Diffb | 0.8 | 0.6 | ||||
| Averageb | 0.0 | -0.4 |
Anti: Distributions binned from -120° to 120°, Intermediate (Int): Distributions binned from -120° to – 60° and 60° to 120°, Eclipsed (Ecl): Distributions binned from -60° to 60°.
Figure 6.
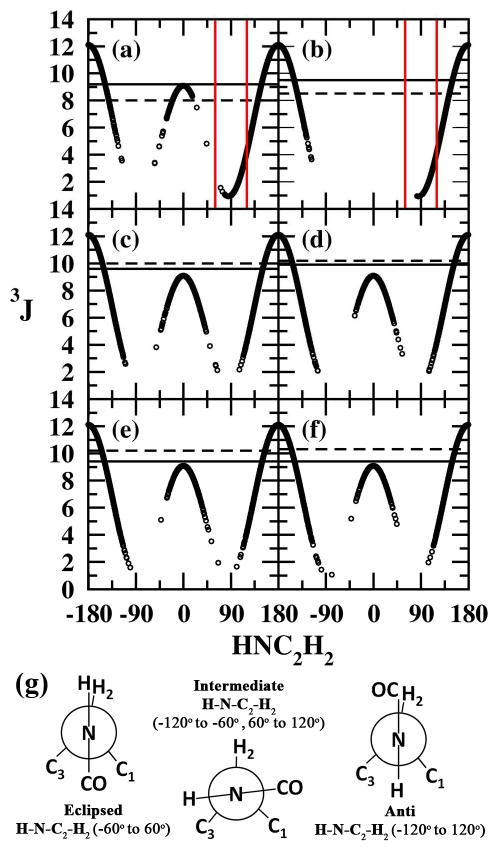
H-N-C2-H2 dihedral vs associated 3JHNH2 from HREX simulations for (a) 1, (b) 2, (c) 3, (d) 4, (e) 7 and (f) 8. In each panel the 3J values from experimental studies (solid line) and average 3J values from HREX (dashed line) are plotted. For 1 and 2 the intermediate region responsible for the disagreement with the experimental 3JHNH2 value are highlighted by red lines. (g) Newmann projections illustrating the three major conformations adopted by the H-N-C2-H2 dihedral.
3JHαHβ Coupling Constants
3JHαHβ coupling constants calculated from the HREX simulations based on equation 8 are summarized in Table 4. The coupling constants for the Thr derivatives are smaller than those observed for Ser derivatives, which is consistent with experimental observations 24-26,29,40-43. Also the overall agreement between the experimentally observed and theoretically calculated 3JHαHβ values is better for the Thr systems when compared to the Ser systems.
Table 4.
J-coupling constants and the associated sampling of the N-Cα-Cβ-O1 (χs) dihedral for the fourteen glycopeptides. The standard deviation of the calculated coupling constant values is presented in parenthesis. J-coupling constants in Hz.
| Comp | Exptd | HREXd | Motional Averd | +60°a | -60°a | ±180°a |
|---|---|---|---|---|---|---|
| 1 | 5.5,4,5 40 | 5.4(3.1), 4.3(3.5) | 4.7(1.4), 4.9(3.3) | 71.1% | 14.7% | 14.2% |
| 2 | 2.5 41 | 3.1 (1.0) | 3.3 (0.9) | 100.0% | 0.0% | 0.0% |
| 3 | 6.8,… 41 | 6.7(3.8),7.2(4.8) | 5.2(1.5),8.0(3.9) | 27.8% | 45.3% | 26.9% |
| 4 | 3.5 41 | 3.2 (1.3) | 3.3 (1.2) | 99.3% | 0.8% | 0.0% |
| 5 | 4.6,… 43 | 7.9(4.1), 5.4(4.2) | 5.5 (1.4), 6.8(3.4) | 31.7% | 26.1% | 42.2% |
| 6 | 3.443 | 3.2 (1.6) | 3.5 (1.5) | 95.7% | 1.8% | 2.5% |
| 7 | 6.6.5,242 | 8.4(4.2), 6.0(4.4) | 5.5(1.4), 7.6(3.2) | 18.8% | 30.8% | 50.4% |
| 8 | --- | 3.0 (0.9) | 3.1 (0.9) | 100.0% | 0.0% | 0.0% |
| 9 | 8.6(4.3), 5.4(4.1) | 5.5(1.5), 7.2(3.1) | 21.4% | 24.2% | 54.4% | |
| 10 | 3.2 (1.0) | 3.4 (0.9) | 100.0% | 0.0% | 0.0% | |
| 11 | 9.8(4.0), 6.1(4.4) | 5.9(1,2), 8.2(2.6) | 1.1% | 32.0% | 66.9% | |
| 12 | 3.4 (1.9) | 3.5 (1.8) | 96.4% | 3.1% | 0.6% | |
| 13 | 8.6(4.1), 5.0(4.1) | 5.7(1.4), 6.8(3.1) | 26.4% | 23.2% | 50.5% | |
| 14 | 3.1 (0.9) | 3.3 (0.9) | 99.9% | 0.0% | 0.0% | |
| Avgb | 5.9,4.9 | 7.9(4.0),5.6(4,2) | 5.4(1.4),7.1(3.2) | |||
| Avgc | 3.1 | 3.2(1.2) | 3.3(1.2) |
+60° (g+): Distributions binned from 0° to 120°, -60°(g-): Distributions binned from -120° to −0°, ±180° (anti): Distributions binned from -180° to -120° and 120° to 180°.
Ser derivatives: J values averaged over the available experimental data and from the odd numbered compounds for HREX simulations.
Thr derivatives: J values averaged over the available experimental data and from the even numbered compounds for HREX simulations. The standard deviations are also averaged for the HREX data.
For all the odd numbered systems the first value corresponds to 3JHα,Hβpro R and the second value corresponds to 3JHα,Hβpro S.
To gain insights into these trends the 3JHαHβ coupling constant vs the N-Cα-Cβ-O1 (χs) dihedral for 1 and 2 are presented in Figure 7a (upper panel). Also plotted is the N-Cα-Cβ-O1 (χs) dihedral probability distribution in Figure 7a (lower panel). Results show that the χs dihedral populates three conformational basins corresponding to g+(60°), g-(-60°) and anti(±180°) conformations. The evaluated 3JHαHβ value for these three dihedrals using equation 8 is found to be 3.4 Hz, 3.4 Hz and 12.9 Hz, respectively. Thus, two distinct ranges of 3JHαHβ values can be sampled. The low range around 3.4 Hz corresponds to the g+(60°), g-(-60°) conformations and the high range around 12.9 Hz corresponds to the anti(±180°) conformation.
Figure 7.
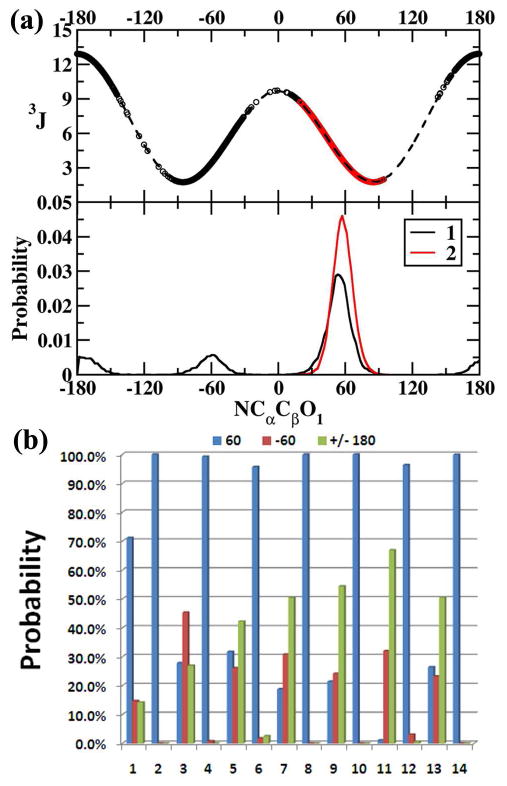
(a) N-Cα-Cβ-O1 dihedral vs associated 3JHαHβ (upper panel) from HREX simulations for 1 (black circles) and 2 (red circles). The theoretical 3JHαHβ for the range -180 to +180 has also been presented in dashed lines (upper panel). The N-Cα-Cβ-O1 dihedral probability distribution for 1 (black line) and 2 (red line) is presented in the lower panel. (b) Population distributions of the N-Cα-Cβ-O1 (χs) dihedral in the three conformational regions g+(60°), g-(-60°) and anti (±180°) from HREX simulations for all the model glycopeptides.
The N-Cα-Cβ-O1 (χs) dihedral for all the Thr derivatives (even-numbered systems) remains rigid and samples the g+(60°) conformational space (Table 4 and Figure 7b). This conformational preference is clearly reflected in the observed and evaluated average 3JHαHβ values, which are found to be 3.1 Hz from experimental studies and 3.2 (1.2) Hz from HREX simulations. The standard deviations for the evaluated 3JHαHβ values are low, around 1.2 Hz, which agrees well with the limited range being sampled by that dihedral associated with the conformational bin around g+(60°) in Figure 7a.
In contract, the N-Cα-Cβ-O1 (χs) dihedral samples all the three conformations for the Ser derivatives (odd-numbered systems). This causes a significant shift in the 3JHαHβ values as now the average 3JHαHβ is evaluated over two different ranges around 3.4 Hz and 12.9 Hz. This is reflected in the experimental 3JHαHβ values, which are found to vary in the range 4.5 Hz-6.8 Hz for the systems studied. Also it should be noted that in few cases (3 and 5) the 3JHαHβ values could not be experimentally resolved, which is indirect evidence of the flexibility of this dihedral in these systems41,43. Good agreement between the average 3JHαHβ values from experimental data (5.9 Hz, 4.9 Hz) and HREX simulations (7.9(4.0) Hz, 5.6(4.2) Hz) is obtained. Note that the standard deviations for the average values are large (4.0 Hz and 4.2 Hz) due to the two ranges that are being sampled by the linkages.
3JHαHβ coupling constants calculated from the standard MD simulations based on equation 8 and the associated population distribution for the N-Cα-Cβ-O1 (χs) dihedral are summarized in Table T3 of the supporting information file. The evaluated average 3JHαHβ value for the Thr derivatives 3.1 (0.9) Hz agrees well with the average experimental 3JHαHβ value of 3.1 Hz. This is again due to the rigidity of the N-Cα-Cβ-O1 (χs) dihedral sampling exclusively the g+(60°) conformational space for all the Thr derivatives. However, for the Ser derivatives the agreement of the average 3JHαHβ values from standard MD simulations (8.7(3.7) Hz, 5.8(3.9) Hz) to the experimental data (5.9 Hz, 4.9 Hz) is somewhat poorer when compared to the HREX simulations (7.9(4.0) Hz, 5.6(4.2) Hz). This discrepancy is due to the oversampling of the anti (±180°) conformations in standard MD simulations (54%) compared to the HREX simulations (44%) which causes the significant shift in the evaluated 3JHαHβ values.
Intramolecular Hydrogen Bonds
To gain insights into the various hydrogen bonding (H-bonds) interactions in the studied glycopeptides, the H-bond occupancy from HREX simulations is summarized in Table 5. The intramolecular H-bonds in glycopeptides can be classified as intra-peptide, intra-sugar and sugar-peptide H-bonds. The only possible intra-protein H-bond is between the carbonyl oxygen (O) and the amide hydrogen (HN) and only occurs in the Ser derivatives (odd-numbered systems). This H-bond only forms when the peptide adopts the β-sheet geometry. The H-bond occupancy corresponds with the presence and absence of relative free energy minima at the β-sheet regions of the ϕS/ψS surfaces (Figure 4) for the Ser and Thr derivatives, respectively.
Table 5.
Hydrogen bond occupancies for all the model glycopeptides systems from HREX simulations. The occupancies are classified into intra-protein, intra-sugar and sugar-peptide hydrogen bonds.
| Comp | Protein | Sugar | Sugar-Peptidea | |||||||
|---|---|---|---|---|---|---|---|---|---|---|
| O..HN | O4..HO3 | O5..HO6 | O2..HO3 | O1..HN | O1..HNT | Osug..HN | HO6..O | O5..HNT | HO2..O1 | |
| 1 | 0.037 | 0.143 | 0.036 | --- | 0.178 | 0.020 | 0.002 | --- | --- | --- |
| 2 | --- | 0.133 | 0.045 | --- | 0.190 | --- | 0.001 | --- | --- | --- |
| 3 | 0.103 | 0.136 | 0.034 | --- | 0.133 | 0.031 | --- | 0.022 | 0.034 | --- |
| 4 | --- | 0.148 | 0.079 | --- | 0.237 | 0.014 | 0.052 | 0.093 | 0.004 | --- |
| 5 | 0.133 | 0.020 | 0.102 | 0.039 | 0.120 | 0.052 | --- | 0.055 | 0.072 | --- |
| 6 | --- | 0.022 | 0.207 | 0.038 | 0.228 | 0.029 | --- | 0.240 | 0.018 | --- |
| 7 | 0.120 | 0.018 | 0.092 | --- | 0.060 | 0.055 | 0.036 | 0.011 | 0.060 | --- |
| 8 | --- | 0.016 | 0.250 | --- | 0.284 | 0.019 | 0.054 | 0.331 | 0.002 | --- |
| 9 | 0.086 | 0.031 | 0.110 | 0.106 | 0.055 | 0.025 | --- | --- | --- | --- |
| 10 | --- | 0.030 | 0.108 | 0.107 | 0.166 | 0.003 | --- | --- | --- | --- |
| 11 | 0.216 | 0.020 | 0.089 | 0.153 | 0.028 | 0.126 | --- | 0.003 | 0.136 | 0.060 |
| 12 | --- | 0.019 | 0.212 | 0.157 | 0.227 | 0.023 | --- | 0.195 | 0.016 | 0.110 |
| 13 | 0.142 | 0.132 | --- | 0.036 | 0.087 | 0.036 | --- | --- | --- | 0.113 |
| 14 | --- | 0.142 | --- | 0.034 | 0.227 | 0.003 | --- | --- | --- | 0.127 |
For the sugar-Peptide H-bonds the sugar atom is listed first followed by the peptide atom in the heading.
H-bond occupancies > 0.1 are presented in bold letters.
Three intra-sugar H-bonds, O4…HO3, O5…HO6 and O2…HO3 are observed for the glycopeptides. Of these, O4…HO3 and O2…HO3 are characteristic to the sugar moieties involved, while O5…HO6 reflects secondary interactions with the peptide moiety. The O4…HO3 H-bond is found in both GalNAc (1, 2, 3, 4) and Fuc (13, 14) derivatives where the hydroxyls at position 3 and 4 are in equatorial and axial orientations, respectively. The O2…HO3 H-bond is found only in the Man (9, 10, 11, 12) derivatives where the hydroxyls at position 2 and 3 are in axial and equatorial orientations, respectively. For the O5…HO6 H-bond we find that even though the O5…HO6 moiety has the same conformational geometry for all the systems, with the -CH2-OH side group at position 5 (1 to 12), the H-bonding pattern is not the same. The H-bond is found to be very weak for the GalNAc derivatives (1 to 4), while for all the other systems the H-bond showed significant occupancies. For the β derivatives (5 to 8, 11, 12) the H-bond occupancies for the Thr derivatives (even-numbered) are significantly higher when compared to the Ser derivatives (odd-numbered). This difference arises due to the concerted formation of both the O5…HO6 H-bond and the sugar-peptide HO6…O H-bond for the Thr β derivatives (6, 8, 12).
NMR studies have attributed the conformational behavior of O-glycosylation to the formation of specific H-bonds between the peptide moiety and the sugar unit, which in turn “lock” the orientation of the sugar with respect to the backbone.24,30,93-95 Two significant H-bonds between the sugar units and the peptide units occur, which are present in multiple systems. The first one is between the ether oxygen (O1) of the glycosidic linkage and the amide hydrogen of the corresponding amino acid (Ser/Thr). This H-bond (O1…HN) is significantly populated in the Thr derivatives when compared to the Ser derivatives. The significant occupancy of the O1…HN H-bond for the Thr-derivatives is a result of the conformational rigidity of the N-Cα-Cβ-O1 (χs) dihedral for all the Thr derivatives. Among the Ser derivatives we find that both 1(0.178) and 5(0.120) show significant occupancies for this H-bond due to the significant population of the +60° (g+) conformation, 71% and 32%, for these systems, respectively (Table 4). The next significant H-bond is between the hydroxyl at position 6 (HO6) and the carbonyl oxygen (O). As discussed earlier this H-bond is formed in tandem with the O5…HO6 H-bond for the Thr β derivatives (6, 8 and 12),
Other than the above H-bonds a few system specific H-bonds are present. One is between the ether oxygen (O1) of the glycosidic linkage and the amide hydrogen of the adjacent amino acid (HNT), found in Ser β-Man (11). This proximity of O1 and HNT leads to the formation of another H-bond between the O5 oxygen and amide hydrogen of the adjacent amino acid (HNT) in 11. The absence of H-bonds between the N-acetyl moiety and the peptide backbone is consistent with the absence of significant NOE's in NMR experiments and tar-MD simulations for these systems 40,41,42,43.
Solvent Influence
The structure of carbohydrates in aqueous solution is intimately related to the interactions with the surrounding water molecules. The presence of bridging water molecules in carbohydrate structures is known to govern the conformational stability and properties of the carbohydrate structure.88,89 In particular, the solvent structure of O-linkages has attracted special attention due to the antifreeze behavior exhibited by mucin type linkages in Ala-Ala-Thr tripeptide repeats, where each Thr carries a Gal(β1-3)GalNAc(α1-O) moiety. A complete loss of antifreeze activity was observed on attaching GalNAc as a β-anomer or changing Thr to Ser, which have been indicated to be associated with changes in interactions with the solvent including the loss of carbohydrate-peptide bridging waters.94,96 Tar-MD simulations by Corzana and co-workers identified key bridging water interactions in α/β-GalNAc41-43 Here, it is shown that the unrestrained HREX simulations are able to capture the bridging water interactions between the carbohydrate and peptide units, thus enabling the study of O-linked glycopeptides without restraint data.
Significant bridge waters between the carbohydrate and peptide moieties were found in α-GalNAc (1, 2) and α-Fuc (13, 14). The bridge waters in α-GalNAc were present between the amide hydrogen (HN) atom of the carbohydrate side chain and the amide hydrogen (HN) of the corresponding amino acid (HN…H2O…HN; we use the following naming convention to describe the bridge: carbohydrate atom - H2O - peptide atom; see Figure 1 for atom naming). The occupancies were found to be 0.117 for Ser α-GalNAc (1) and 0.194 for Thr α-GalNAc (2). For this bridge water site the normalized 2D radial pair distribution function g(r1,r2) (2D-RDF) was calculated using equation 10 and is presented in Figure 8 for both 1 and 2. The bridge water density is highly localized and shows no elongated behavior, with a maximum density of 2.7 and 4.1 corresponding to (2.0 Å, 2.1 Å) for 1 and 2, respectively, indicative of a water residence time longer than that of bulk water. Thus, while both Thr and Ser α-GalNAc O-linkages are capable of forming structured water, the extent of the structured water formation is higher for Thr α-GalNAc when compared to Ser α-GalNAc. This feature is completely lost in β-GalNAc linkages, a result consistent with the reported experimental trends.94,96
Figure 8.
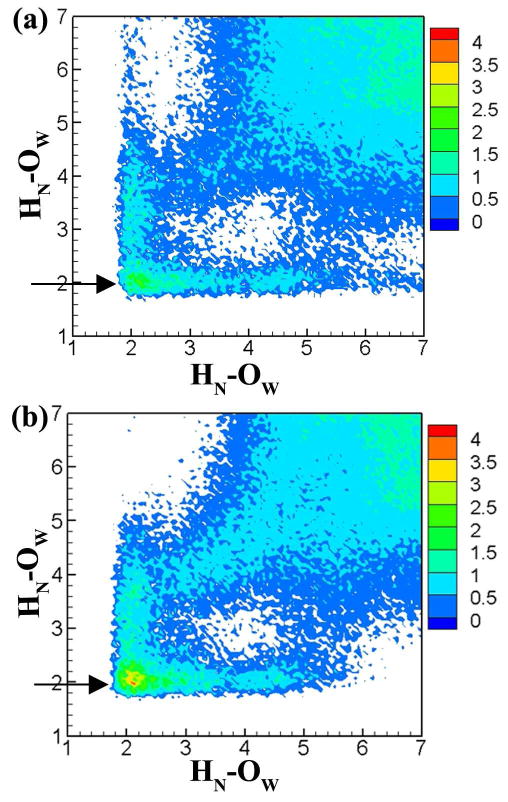
2D radial pair distribution plots to identify significant HN-H2O-HN water bridges from HREX simulations for (a) comp 1 and (b) comp 2. Arrows highlight the bridge water density. All the distances are given in angstroms (Å).
For Ser α-Fuc (13) there is a weak bridge water site between the HO2 hydroxyl and the amide hydrogen of the adjacent amino acid (HNT) (HO2…H2O…HNT). The occupancy of this bridge site was found to be 0.074. While for the Thr derivative (14) a relatively strong bridge site is present between HO2 and the amide hydrogen of the same amino acid (HN) (HO2…H2O…HN), the occupancy of which was found to be 0.132. The 2D-RDFs for these sites are presented in Figure S3 of the supporting information. Very weak densities are present for both the systems in the bridging region. However, for Thr α-Fuc (14) we find an additional density at (3.5 Å, 2.0 Å), which implies that the water molecule was in close proximity to the amide hydrogen as compared to the hydroxyl hydrogen (HO2). This could also lead to an alternative bridging mode involving the O2 oxygen and the amide hydrogen, which would satisfy the 3.5 Å distance between HO2 and the water oxygen.
Glycoprotein study
The crystal structure of glucoamylase from Aspergillus awamori var. X100 (PDB id: 3GLY) contains ten α-O-Man glycosylation sites clustered at the N-terminal domain of the crystal structure. The high density of α-O-Man groups in close proximity enables the study of both carbohydrate-peptide and carbohydrate-carbohydrate interactions. Out of the 10 O-linkages 6 are Ser-α-O-Man and 4 are Thr-α-O-Man linkages, which allows for differences between the Ser and Thr O-Man linkages to be investigated. A sequential numbering of the Man residues is used to describe each linkage; thus 1-Man describes the α-O-Man linkage at position 443 and subsequent linkages from 2-Man to 10-Man describe α-O-Man linkages at positions 444, 452, 453, 455, 457, 459, 460, 462 and 464, respectively.
Figure 9a shows the RMSD analysis of the simulation. The overall RMSD for the protein and carbohydrate remains lower than 2Å for the entire simulation length. On decomposing the overall RMSD into carbohydrate and protein components, it is evident that the carbohydrate regions are highly flexible showing deviations up to 3.5 Å, while the underlying protein regions remain stable with the RMSD always lower than 2 Å. The high RMSD for the carbohydrate regions is consistent with the flexibility of carbohydrates, something that has been observed in NMR studies. 40,41,42,43
Figure 9.
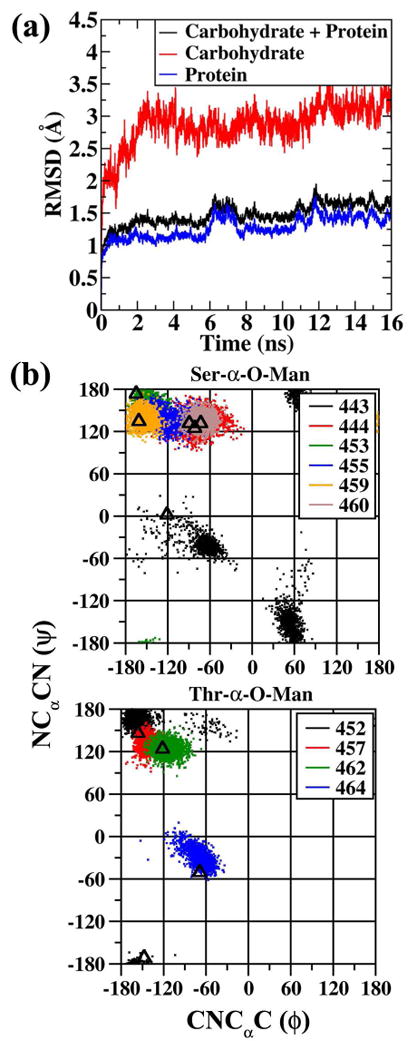
(a) RMSD analysis for the protein 3GLY. RMSD values are for all non-hydrogen atoms following RMS alignment with the crystallographic structure. (b) ϕ(CNCαC) versus ψ(NCαCN) dihedral distribution for the Ser-α-O-Man (upper panel) and Thr-α-O-Man (lower panel) linkages from the last 10 ns of the MD trajectory. Triangles indicate the ϕ/ψ values observed in the crystal structure. Dihedral angles given in degrees.
In Figure 9b the ϕ/ψ distributions of the underlying peptide backbone for the Ser and Thr O-linkages are presented from the last 10ns of the MD simulation. Other than the starting (Ser-443) and ending (Thr-464) linkages the underlying peptide backbone of all the O-linkages sample extended conformations. The Thr O-linkages favor β-sheet conformations while the other Ser O-linkages show preference for both β-sheet (Ser-453, Ser-459) and PPII (Ser-444, Ser-455, Ser 460) geometries. The results from the simulation are in good agreement with the crystallographic study where an average ϕ/ψ value of (-125°, 144°) is present, characteristic of an extended conformation while excluding residues 443 and 464 from the average.77
In Table 6 the H-bond occupancies for carbohydrate-protein and carbohydrate-carbohydrate intermolecular H-bonds from the MD simulation are summarized. From the MD simulation 5 significant carbohydrate-protein H-bond interactions were observed. Of these two strong H-bond interactions (ie. H-bond distance < 3.5 Å) were found in the initial crystal structure. Most of the long-lived carbohydrate-protein H-bonds were formed between Ser-O-linkages and peptide residues. Even though the carbohydrate moieties are closely spaced strong carbohydrate-carbohydrate H-bonds do not occur in the crystal structure, where the closest carbohydrate-carbohydrate contact distance is 3.86 Å. This was reproduced in the MD simulations. The bridge water occupancies for both carbohydrate-H2O-protein and carbohydrate-H2O-carbohydrate bridges from the MD simulation are also summarized in Table 6. The carbohydrates closer to the terminal, 4-Man to 8-Man, are involved in various bridging interactions with the protein residues. 8-Man (0.551), 4-Man (0.489) and 6-Man (0.402) form strong bridges with protein residues Val 461 and Tyr 458 and Ser 455, respectively. Four of the five water bridges detected by the MD simulation were present in the crystallographic structure, suggesting that these bridging water molecules stabilize the relative orientation of the carbohydrate with respect to the protein. In contrast, only 3 significant bridging interactions occurred amongst the carbohydrate moieties, one of which was also detected in the crystal structure. These results suggest that the interactions between the carbohydrate and protein, as well as competition with solvent are properly balanced in the force field. This is an outcome of the consistent approach used for the optimization of the nonbond parameters in the comprehensive CHARMM additive force field for biomolecules.
Table 6.
Significant Carbohydrate-Protein hydrogen bond occupancies and Carbohydrate-H2O-Protein, Carbohydrate-H2O-Carbohydrate bridge water occupancies detected from MD simulation of the 3GLY crystal structure. Also presented are the distances between the heavy atoms involved in the hydrogen bond and bridge-water interactions from the crystal structure.
| Carbohydrate-Protein | |||
|---|---|---|---|
| Carbohydrate | Protein | Occupancy | dA-B (crys)a |
| Man-8 (HO2) | Ala-86 (O) | 0.826 | 2.62 |
| Man-4 (HO4) | Gly-456 (O) | 0.513 | 4.34 |
| Man-9 (HO2) | Ser-460 (O) | 0.473 | 2.88 |
| Man-3 (HO2) | Gln-168 (O) | 0.231 | 5.05 |
| Man-2 (HO4) | Val-445 (O) | 0.195 | 4.77 |
|
| |||
| Carbohydrate-H2O-Proetin | |||
|
| |||
| Carbohydrate | Protein | Occupancy | dA-H2O,dB-H2O (crys) a |
|
| |||
| Man-8 (O3/HO3) | Val-461 (O) | 0.710 | 2.84,2.66 |
| Man-4 (O3/HO3) | Tyr-458 (HN) | 0.608 | 2.71,3.09 |
| Man-6 (O2/HO2) | Ser-455 (O) | 0.431 | --- |
| Man-4 (O2/HO2) | Ser-99 (O) | 0.378 | 3.34,2.50 |
| Man-8 (O2/HO2) | Ile-87 (O) | 0.279 | 2.81,3.15 |
|
| |||
| Carbohydrate-H2O-Carbohydrate | |||
|
| |||
| Carbohydrate | Carbohydrate | Occupancy | dA-H2O,dB-H2O (crys) a |
|
| |||
| Man-9 (O3/HO3) | Man-8 (O4/HO4) | 0.323 | 2.82,2.73 |
| Man-9 (O2/HO2) | Man-7 (O3/HO3) | 0.261 | 3.11,4.00 |
| Man-6 (O2/HO2) | Man-4 (O6/HO6) | 0.169 | --- |
all distances are in Å.
Conclusions
A conformational analysis of all the biologically relevant O-glycosidic linkages has been performed using the HREX simulation methodology and the recently developed CHARMM carbohydrate force field parameters. Comparison with NMR 3J coupling and NOE data shows that the simulations are able to satisfactorily reproduce the experimental results and trends. The agreement with the experimental data was excellent for the β-linkages while being less good for the α-linkages. Specifically, for the α-GalNAc O-linkages it was found that the sampling of the conformers that did not adhere to the trans relationship between the HN and Hα protons resulted in partial disagreement with the experimental results. However, even for these cases the simulations sampled the correct dihedral distribution for ∼74% of the total simulation time. Notably, the newly developed parameters lead to the correct description of the underlying peptide backbone conformations. From the HREX it was found that the peptide backbone favored the extended ϕ/ψ conformations (β-sheet and PPII) over the compact ϕ/ψ conformations (αR-helix), which is consistent with experimental NMR data. To the best of our knowledge this is the first study in which the extended peptide conformations were sampled in the absence of NMR restraints.
A detailed analysis of the intra-molecular H-bonds and bridging waters reveal that there is a synergistic interplay between these two phenomena, which contributes to the conformational stability of the O-linkages. This study also establishes that an H-bond only description cannot account for the conformational characteristics of the O-linkages. The analysis revealed that both the sugar moiety and the anomeric configuration control the conformational characteristics of the O-linkage. The newly developed parameters were also used to describe the O-linkage behavior in a protein crystal structure. The new parameters were able to identify the H-bonding and water mediated interactions in the presence of a protein environment. The current study highlights the quality of the carbohydrate force field in describing the O-linkage geometry, indicating its potential utility in computational studies of glycoproteins in the absence of NMR targeted restraint data.
Supplementary Material
Acknowledgments
Financial support from the NIH (GM070855) is acknowledged. The modified REPDSTR module to perform periodic boundary simulations with CHARMM c36a2 was kindly provided by Professor Benoit Roux and Dr. Wei Jiang (University of Chicago). 2D RDF's were prepared by a program kindly provided by Professor Søren Balling Engelsen (University of Copenhagen). We are grateful to Drs. Olgun Guvench, E. Prabhu Raman and Elizabeth Hatcher for useful discussions.
Footnotes
Supporting Information Available: Two-dimensional distributions for ϕ(CNCαC) versus ψ(NCαCN) dihedrals, Proton-proton distance distributions of d(HN,HNT), d(Hα,HNT) and d(Hα,HN) from HREX simulations for all the model glycopeptide systems. 2D-RDF plots to identify significant HO2-H2O-HNT and HO2-H2O-HN water bridges from HREX simulations for comp 13 and comp 14. Proton-Proton distances from standard MD simulations. 3JHNH2 and 3JHαHβ coupling constants from standard MD simulations. This material is available free of charge via the internet at http://pubs.acs.org.
References
- 1.Varki A. Essentials of glycobiology. Cold Spring Harbor Laboratory Press; Cold Spring Harbor, N.Y.: 2009. [PubMed] [Google Scholar]
- 2.Dwek RA. Chem Rev. 1996;96:683–720. doi: 10.1021/cr940283b. [DOI] [PubMed] [Google Scholar]
- 3.Lis H, Sharon N. Eur J Biochem. 1993;218:1–27. doi: 10.1111/j.1432-1033.1993.tb18347.x. [DOI] [PubMed] [Google Scholar]
- 4.Bause E. Biochem J. 1983;209:331–336. doi: 10.1042/bj2090331. [DOI] [PMC free article] [PubMed] [Google Scholar]
- 5.Hart GW, Brew K, Grant GA, Bradshaw RA, Lennarz WJ. J Biol Chem. 1979;254:9747–9753. [PubMed] [Google Scholar]
- 6.Kaplan HA, Welply JK, Lennarz WJ. Biochim Biophys Acta. 1987;906:161–173. doi: 10.1016/0304-4157(87)90010-4. [DOI] [PubMed] [Google Scholar]
- 7.Marshall RD. Biochem Soc Symp. 1974:17–26. [PubMed] [Google Scholar]
- 8.Van den Steen P, Rudd PM, Dwek RA, Opdenakker G. Crit Rev Biochem Mol Biol. 1998;33:151–208. doi: 10.1080/10409239891204198. [DOI] [PubMed] [Google Scholar]
- 9.Strous GJ, Dekker J. Crit Rev Biochem Mol Biol. 1992;27:57–92. doi: 10.3109/10409239209082559. [DOI] [PubMed] [Google Scholar]
- 10.Comer FI, Hart GW. J Biol Chem. 2000;275:29179–29182. doi: 10.1074/jbc.R000010200. [DOI] [PubMed] [Google Scholar]
- 11.Wells L, Vosseller K, Hart GW. Science. 2001;291:2376–2378. doi: 10.1126/science.1058714. [DOI] [PubMed] [Google Scholar]
- 12.Rexach JE, Clark PM, Hsieh-Wilson LC. Nat Chem Biol. 2008;4:97–106. doi: 10.1038/nchembio.68. [DOI] [PMC free article] [PubMed] [Google Scholar]
- 13.Zachara NE, Hart GW. Chem Rev. 2002;102:431–438. doi: 10.1021/cr000406u. [DOI] [PubMed] [Google Scholar]
- 14.Spiro RG. Glycobiology. 2002;12:43R–56R. doi: 10.1093/glycob/12.4.43r. [DOI] [PubMed] [Google Scholar]
- 15.Haltiwanger RS. Curr Opin Struct Biol. 2002;12:593–598. doi: 10.1016/s0959-440x(02)00371-8. [DOI] [PubMed] [Google Scholar]
- 16.Nishimura H, Kawabata S, Kisiel W, Hase S, Ikenaka T, Takao T, Shimonishi Y, Iwanaga S. J Biol Chem. 1989;264:20320–20325. [PubMed] [Google Scholar]
- 17.Kriss CT, Lou BS, Szabò LZ, Mitchell SA, Hruby VJ, Polt R. Tetrahedron: Asymmetry. 2000;11:9–25. [Google Scholar]
- 18.Jackson CM, Nemerson Y. Annu Rev Biochem. 1980;49:765–811. doi: 10.1146/annurev.bi.49.070180.004001. [DOI] [PubMed] [Google Scholar]
- 19.Mann KG, Jenny RJ, Krishnaswamy S. Annu Rev Biochem. 1988;57:915–956. doi: 10.1146/annurev.bi.57.070188.004411. [DOI] [PubMed] [Google Scholar]
- 20.Hase S, Nishimura H, Kawabata S, Iwanaga S, Ikenaka T. J Biol Chem. 1990;265:1858–1861. [PubMed] [Google Scholar]
- 21.Shao L, Luo Y, Moloney DJ, Haltiwanger R. Glycobiology. 2002;12:763–770. doi: 10.1093/glycob/cwf085. [DOI] [PubMed] [Google Scholar]
- 22.Herscovics A, Orlean P. FASEB J. 1993;7:540–550. doi: 10.1096/fasebj.7.6.8472892. [DOI] [PubMed] [Google Scholar]
- 23.Strahl-Bolsinger S, Gentzsch M, Tanner W. Biochim Biophys Acta. 1999;1426:297–307. doi: 10.1016/s0304-4165(98)00131-7. [DOI] [PubMed] [Google Scholar]
- 24.Coltart DM, Royyuru AK, Williams LJ, Glunz PW, Sames D, Kuduk SD, Schwarz JB, Chen XT, Danishefsky SJ, Live DH. Journal of the American Chemical Society. 2002;124:9833–9844. doi: 10.1021/ja020208f. [DOI] [PubMed] [Google Scholar]
- 25.Live DH, Kumar RA, Beebe X, Danishefsky S. J Proceedings of the National Academy of Sciences of the United States of America. 1996;93:12759–12761. doi: 10.1073/pnas.93.23.12759. [DOI] [PMC free article] [PubMed] [Google Scholar]
- 26.Live DH, Williams LJ, Kuduk SD, Schwarz JB, Glunz PW, Chen XT, Sames D, Kumar RA, Danishefsky SJ. Proceedings of the National Academy of Sciences of the United States of America. 1999;96:3489–3493. doi: 10.1073/pnas.96.7.3489. [DOI] [PMC free article] [PubMed] [Google Scholar]
- 27.Palian MM, Boguslavsky VI, O'Brie DF, Polt R. Journal of the American Chemical Society. 2003;125:5823–5831. doi: 10.1021/ja0268635. [DOI] [PubMed] [Google Scholar]
- 28.Chen YX, Du JT, Zhou LX, Liu XH, Zhao YF, Nakanishi H, Li YM. Chemistry & Biology. 2006;13:937–944. doi: 10.1016/j.chembiol.2006.06.017. [DOI] [PubMed] [Google Scholar]
- 29.Maeji NJ, Inoue Y, Chûjô R. Biopolymers. 1987;26:1753–1767. [Google Scholar]
- 30.Mimura Y, Yamamoto Y, Inoue Y, Chûjô R. International Journal of Biological Macromolecules. 1992;14:242–248. doi: 10.1016/s0141-8130(05)80036-4. [DOI] [PubMed] [Google Scholar]
- 31.Palian MM, Jacobsen NE, Polt R. The Journal of Peptide Research. 2001;58:180–189. doi: 10.1034/j.1399-3011.2001.00906.x. [DOI] [PubMed] [Google Scholar]
- 32.Simanek EE, Huang DH, Pasternack L, Machajewski TD, Seitz O, Millar DS, Dyson HJ, Wong CH. Journal of the American Chemical Society. 1998;120:11567–11575. [Google Scholar]
- 33.Wu Wg, Pasternack L, Huang DH, Koeller KM, Lin CC, Seitz O, Wong CH. Journal of the American Chemical Society. 1999;121:2409–2417. [Google Scholar]
- 34.Guvench O, Greene SN, Kamath G, Brady JW, Venable RM, Pastor RW, MacKerell AD., Jr J Comput Chem. 2008;29:2543–2564. doi: 10.1002/jcc.21004. [DOI] [PMC free article] [PubMed] [Google Scholar]
- 35.Guvench O, Hatcher ER, Venable RM, Pastor RW, MacKerell AD., Jr J Chem Theory Comput. 2009;5:2353–2370. doi: 10.1021/ct900242e. [DOI] [PMC free article] [PubMed] [Google Scholar]
- 36.Hatcher E, Guvench O, MacKerell AD., Jr J Chem Theory Comput. 2009;5:1315–1327. doi: 10.1021/ct9000608. [DOI] [PMC free article] [PubMed] [Google Scholar]
- 37.Hatcher E, Guvench O, MacKerell AD., Jr J Phys Chem B. 2009;113:12466–12476. doi: 10.1021/jp905496e. [DOI] [PMC free article] [PubMed] [Google Scholar]
- 38.Raman EP, Guvench O, MacKerell AD., Jr J Phys Chem B. 2010;114:12981–12994. doi: 10.1021/jp105758h. [DOI] [PMC free article] [PubMed] [Google Scholar]
- 39.Brooks BR, Brooks CL, 3rd, MacKerell AD, Jr, Nilsson L, Petrella RJ, Roux B, Won Y, Archontis G, Bartels C, Boresch S, Caflisch A, Caves L, Cui Q, Dinner AR, Feig M, Fischer S, Gao J, Hodoscek M, Im W, Kuczera K, Lazaridis T, Ma J, Ovchinnikov V, Paci E, Pastor RW, Post CB, Pu JZ, Schaefer M, Tidor B, Venable RM, Woodcock HL, Wu X, Yang W, York DM, Karplus M. J Comput Chem. 2009;30:1545–1614. doi: 10.1002/jcc.21287. [DOI] [PMC free article] [PubMed] [Google Scholar]
- 40.Corzana F, Busto JH, Jimenez-Oses G, Asensio JL, Jimenez-Barbero J, Peregrina JM, Avenoza A. Journal of the American Chemical Society. 2006;128:14640–14648. doi: 10.1021/ja064539u. [DOI] [PubMed] [Google Scholar]
- 41.Corzana F, Busto JH, Jimenez-Oses G, de Luis MG, Asensio JL, Jimenez-Barbero J, Peregrina JM, Avenoza A. Journal of the American Chemical Society. 2007;129:9458–9467. doi: 10.1021/ja072181b. [DOI] [PubMed] [Google Scholar]
- 42.Fernandez-Tejada A, Corzana F, Busto JH, Jimenez-Oses G, Jimenez-Barbero J, Avenoza A, Peregrina JM. Chemistry-a European Journal. 2009;15:7297–7301. doi: 10.1002/chem.200901204. [DOI] [PubMed] [Google Scholar]
- 43.Corzana F, Busto JH, Engelsen SB, Jimenez-Barbero J, Asensio JL, Peregrina JM, Avenoza A. Chemistry-a European Journal. 2006;12:7864–7871. doi: 10.1002/chem.200600128. [DOI] [PubMed] [Google Scholar]
- 44.Herzner H, Reipen T, Schultz M, Kunz H. Chem Rev. 2000;100:4495–4538. doi: 10.1021/cr990308c. [DOI] [PubMed] [Google Scholar]
- 45.Meyer B, Moller H. Glycopeptides and Glycoproteins: Synthesis, Structure, and Application. 2007;267:187–251. [Google Scholar]
- 46.Pratt MR, Bertozzi CR. Chemical Society Reviews. 2005;34:58–68. doi: 10.1039/b400593g. [DOI] [PubMed] [Google Scholar]
- 47.Seitz O. Chembiochem. 2000;1:215–246. doi: 10.1002/1439-7633(20001117)1:4<214::AID-CBIC214>3.0.CO;2-B. [DOI] [PubMed] [Google Scholar]
- 48.Wormald MR, Petrescu AJ, Pao YL, Glithero A, Elliott T, Dwek RA. Chemical Reviews. 2002;102:371–386. doi: 10.1021/cr990368i. [DOI] [PubMed] [Google Scholar]
- 49.MacKerell AD, Jr, Bashford D, Bellott M, Dunbrack RL, Evanseck JD, Field MJ, Fischer S, Gao J, Guo H, Ha S, Joseph-McCarthy D, Kuchnir L, Kuczera K, Lau FTK, Mattos C, Michnick S, Ngo T, Nguyen DT, Prodhom B, Reiher WE, Roux B, Schlenkrich M, Smith JC, Stote R, Straub J, Watanabe M, Wiorkiewicz-Kuczera J, Yin D, Karplus M. Journal of Physical Chemistry B. 1998;102:3586–3616. doi: 10.1021/jp973084f. [DOI] [PubMed] [Google Scholar]
- 50.MacKerell AD, Jr, Feig M, Brooks CL. Journal of Computational Chemistry. 2004;25:1400–1415. doi: 10.1002/jcc.20065. [DOI] [PubMed] [Google Scholar]
- 51.Jorgensen WL, Chandrasekhar J, Madura JD, Impey RW, Klein ML. The Journal of Chemical Physics. 1983;79:926–935. [Google Scholar]
- 52.Becker OM, M AD J, Roux B, Watanabe M, editors. Computational Biochemistry and Biophysics. Marcel-Dekker Inc; New York: 2001. [Google Scholar]
- 53.Brooks CL, III, Karplus M, Pettitt BM. Proteins: A Theoretical Perspective of Dynamics, Structure, and Thermodynamics. John Wiley & Sons; New York: 1988. [Google Scholar]
- 54.Beglov D, Roux B. The Journal of Physical Chemistry B. 1997;101:7821–7826. [Google Scholar]
- 55.Darden T, York D, Pedersen L. The Journal of Chemical Physics. 1993;98:10089–10092. [Google Scholar]
- 56.Steinbach PJ, Brooks BR. Journal of Computational Chemistry. 1994;15:667–683. [Google Scholar]
- 57.Ryckaert JP, Ciccotti G, Berendsen HJC. Journal of Computational Physics. 1977;23:327–341. [Google Scholar]
- 58.Nose S. The Journal of Chemical Physics. 1984;81:511–519. [Google Scholar]
- 59.Feller SE, Zhang Y, Pastor RW, Brooks BR. The Journal of Chemical Physics. 1995;103:4613–4621. [Google Scholar]
- 60.Predescu C, Predescu M, Ciobanu CV. The Journal of Physical Chemistry B. 2005;109:4189–4196. doi: 10.1021/jp045073+. [DOI] [PubMed] [Google Scholar]
- 61.Sugita Y, Okamoto Y. Chemical Physics Letters. 1999;314:141–151. [Google Scholar]
- 62.Swendsen RH, Wang JS. Physical Review Letters. 1986;57:2607. doi: 10.1103/PhysRevLett.57.2607. [DOI] [PubMed] [Google Scholar]
- 63.Gnanakaran S, Nymeyer H, Portman J, Sanbonmatsu KY, García AE. Current Opinion in Structural Biology. 2003;13:168–174. doi: 10.1016/s0959-440x(03)00040-x. [DOI] [PubMed] [Google Scholar]
- 64.Tai K. Biophysical Chemistry. 2004;107:213–220. doi: 10.1016/j.bpc.2003.09.010. [DOI] [PubMed] [Google Scholar]
- 65.Zuckerman DM, Lyman E. Journal of Chemical Theory and Computation. 2006;2:1200–1202. doi: 10.1021/ct600297q. [DOI] [PubMed] [Google Scholar]
- 66.Affentranger R, Tavernelli I, Di Iorio EE. Journal of Chemical Theory and Computation. 2006;2:217–228. doi: 10.1021/ct050250b. [DOI] [PubMed] [Google Scholar]
- 67.Jang S, Shin S, Pak Y. Physical Review Letters. 2003;91:058305. doi: 10.1103/PhysRevLett.91.058305. [DOI] [PubMed] [Google Scholar]
- 68.Kannan S, Zacharias M. Proteins: Structure, Function, and Bioinformatics. 2007;66:697–706. doi: 10.1002/prot.21258. [DOI] [PubMed] [Google Scholar]
- 69.Liu P, Kim B, Friesner RA, Berne BJ. Proceedings of the National Academy of Sciences of the United States of America. 2005;102:13749–13754. doi: 10.1073/pnas.0506346102. [DOI] [PMC free article] [PubMed] [Google Scholar]
- 70.Zhu Z, Tuckerman ME, Samuelson SO, Martyna GJ. Physical Review Letters. 2002;88:100201. doi: 10.1103/PhysRevLett.88.100201. [DOI] [PubMed] [Google Scholar]
- 71.Vreede J, Wolf MG, de Leeuw SW, Bolhuis PG. The Journal of Physical Chemistry B. 2009;113:6484–6494. doi: 10.1021/jp809641j. [DOI] [PubMed] [Google Scholar]
- 72.Wolf MG, de Leeuw SW. Biophysical Journal. 2008;94:3742–3747. doi: 10.1529/biophysj.107.122192. [DOI] [PMC free article] [PubMed] [Google Scholar]
- 73.Faraldo-Gómez JD, Roux B. Journal of Computational Chemistry. 2007;28:1634–1647. doi: 10.1002/jcc.20652. [DOI] [PubMed] [Google Scholar]
- 74.Jiang W, Roux Bt. Journal of Chemical Theory and Computation. 6:2559–2565. doi: 10.1021/ct1001768. [DOI] [PMC free article] [PubMed] [Google Scholar]
- 75.Kannan S, Zacharias M. International Journal of Molecular Sciences. 2009;10:1121–1137. doi: 10.3390/ijms10031121. [DOI] [PMC free article] [PubMed] [Google Scholar]
- 76.Woodcock HL, Hodošček M, Gilbert ATB, Gill PMW, Schaefer HF, Brooks BR. Journal of Computational Chemistry. 2007;28:1485–1502. doi: 10.1002/jcc.20587. [DOI] [PubMed] [Google Scholar]
- 77.Aleshin AE, Hoffman C, Firsov LM, Honzatko RB. Journal of Molecular Biology. 1994;238:575–591. doi: 10.1006/jmbi.1994.1316. [DOI] [PubMed] [Google Scholar]
- 78.Jo S, Kim T, Iyer VG, Im W. Journal of Computational Chemistry. 2008;29:1859–1865. doi: 10.1002/jcc.20945. [DOI] [PubMed] [Google Scholar]
- 79.Jo S, Song KC, Desaire H, MacKerell AD, Jr, Im W. Journal of Computational Chemistry. 2011 doi: 10.1002/jcc.21886. In Press. [DOI] [PMC free article] [PubMed] [Google Scholar]
- 80.Berman HM, Westbrook J, Feng Z, Gilliland G, Bhat TN, Weissig H, Shindyalov IN, Bourne PE. Nucleic Acids Research. 2000;28:235–242. doi: 10.1093/nar/28.1.235. [DOI] [PMC free article] [PubMed] [Google Scholar]
- 81.Word JM, Lovell SC, Richardson JS, Richardson DC. Journal of Molecular Biology. 1999;285:1735–1747. doi: 10.1006/jmbi.1998.2401. [DOI] [PubMed] [Google Scholar]
- 82.Kalé L, Skeel R, Bhandarkar M, Brunner R, Gursoy A, Krawetz N, Phillips J, Shinozaki A, Varadarajan K, Schulten K. Journal of Computational Physics. 1999;151:283–312. [Google Scholar]
- 83.Vuister GW, Bax A. Journal of the American Chemical Society. 1993;115:7772–7777. [Google Scholar]
- 84.Mobli M, Almond A. Organic & Biomolecular Chemistry. 2007;5:2243–2251. doi: 10.1039/b705761j. [DOI] [PMC free article] [PubMed] [Google Scholar]
- 85.Demarco A, Llinás M, Wüthrich K. Biopolymers. 1978;17:617–636. [Google Scholar]
- 86.Brueschweiler R, Case DA. Journal of the American Chemical Society. 1994;116:11199–11200. [Google Scholar]
- 87.Andersson C, Engelsen SB. J Mol Graph Model. 1999;17:101–105. 131–103. doi: 10.1016/s1093-3263(99)00022-4. [DOI] [PubMed] [Google Scholar]
- 88.Damager I, Engelsen SB, Blennow A, Moller BL, Motawia MS. Chem Rev. 110:2049–2080. doi: 10.1021/cr900227t. [DOI] [PMC free article] [PubMed] [Google Scholar]
- 89.Engelsen SB, Monteiro C, Hervé de Penhoat C, Pérez S. Biophysical Chemistry. 2001;93:103–127. doi: 10.1016/s0301-4622(01)00215-0. [DOI] [PubMed] [Google Scholar]
- 90.Richardson JS. Adv Protein Chem. 1981;34:167–339. doi: 10.1016/s0065-3233(08)60520-3. [DOI] [PubMed] [Google Scholar]
- 91.Dyson HJ, Wright PE. Annu Rev Biophys Biophys Chem. 1991;20:519–538. doi: 10.1146/annurev.bb.20.060191.002511. [DOI] [PubMed] [Google Scholar]
- 92.Thatcher GRJ. The Anomeric effect and associated stereoelectronic effects. American Chemical Society; Washington, DC: 1993. [Google Scholar]
- 93.Schuman J, Qiu D, Koganty RR, Longenecker BM, Campbell AP. Glycoconjugate Journal. 2000;17:835–848. doi: 10.1023/a:1010909011496. [DOI] [PubMed] [Google Scholar]
- 94.Tachibana Y, Fletcher GL, Fujitani N, Tsuda S, Monde K, Nishimura SI. Angewandte Chemie. 2004;116:783–783. doi: 10.1002/anie.200353110. [DOI] [PubMed] [Google Scholar]
- 95.Schuman J, Campbell AP, Koganty RR, Longenecker BM. Journal of Peptide Research. 2003;61:91. doi: 10.1034/j.1399-3011.2003.00031.x. [DOI] [PubMed] [Google Scholar]
- 96.Harding MM, Anderberg PI, Haymet ADJ. European Journal of Biochemistry. Vol. 270. Wiley-Blackwell; 2003. Antifreeze glycoproteins from polar fish; pp. 1381–1392. [DOI] [PubMed] [Google Scholar]
Associated Data
This section collects any data citations, data availability statements, or supplementary materials included in this article.