Abstract
Using multiple quantitative analyses, we discovered microRNAs (miRNAs) abundantly expressed in visual cortex that respond to dark-rearing (DR) and/or monocular deprivation (MD). The most significantly altered miRNA, miR-132, was rapidly upregulated after eye-opening and delayed by DR. In vivo inhibition of miR-132 prevented ocular dominance plasticity in identified neurons following MD, and affected maturation of dendritic spines, demonstrating its critical role in the plasticity of visual cortex circuits.
MiRNAs are small non-coding RNAs that are known to orchestrate the expression of protein coding genes1. They are particularly enriched in the nervous system, and have been shown to influence neuronal development and function2-4. However, little is known about their role in experience-dependent cortical plasticity. Here, we have used molecular analyses to discover changes in the expression of miRNAs in the primary visual cortex (V1) of mice that were visually deprived5,6, either by dark rearing (DR) with complete absence of light from birth, or by monocular deprivation (MD) with suture of one eyelid during the ‘critical period’ of heightened ocular dominance plasticity7. We show that the expression of a subset of miRNAs is significantly altered by visual deprivation. Moreover, we demonstrate with structural and functional analyses that the most robustly experience-dependent miRNA, miR-132, is a crucial regulator of visual cortex plasticity.
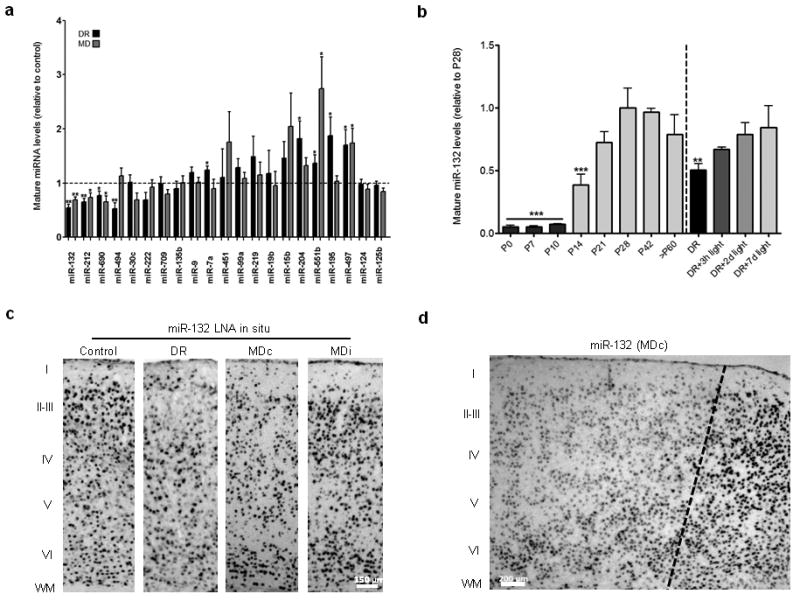
In order to screen for miRNAs that respond to visual deprivation, we compared their expression in RNA extracted from V1 of three groups of mice that were age-matched to the peak of the critical period5: P28 control mice reared with a normal light/dark cycle, P28 DR mice reared in darkness from birth, and P28 MD mice reared with their eyelid sutured from P24-28 (Supplementary Methods and Supplementary Fig. 1). All animal experiments were approved by the Massachusetts Institute of Technology Institutional Animal Care and Use Committee (IACUC). Statistical analysis of microarray data (SAM)8 revealed 21 differentially expressed miRNAs, the majority of which were affected in a similar manner by DR and MD (Supplementary Figs. 1-3 and Supplementary Table 1). Next, we applied mature miRNA-specific quantitative real-time polymerase chain reaction (qRT-PCR) to a larger set of DR and MD samples and independently detected 19 of the miRNAs differentially expressed according to microarray (Fig 1a). Overall, miRNA qRT-PCR and microarray results were significantly correlated (Supplementary Fig. 4a). qRT-PCR confirmed nine significantly altered miRNAs, with decreases in miR-132, miR-212 and miR-690 and increases in miR-497 and miR-551b expression observed after both DR and MD (Fig. 1a). Expression of two control brain-enriched miRNAs (miR-124a and miR-125b) was unaffected, in agreement with microarray results (Fig. 1a). Furthermore, no significant changes were observed in the ipsilateral V1 areas of MD-altered miRNAs (Supplementary Fig. 4b). In addition, qRT-PCR specific for primary miRNA precursors (pri-miRNAs) indicated that their changes mirrored those in mature for six out of nine miRNAs, suggestive of a transcriptional mechanism (Supplementary Fig. 5). We also combined in silico miRNA target prediction and pathway analysis and found that multiple pathways linked to synaptic plasticity were predicted to be highly targeted by experience-dependent miRNAs (Supplementary Tables 2 and 3). Thus, microarray and qRT-PCR analyses together revealed a set of miRNAs in V1 that are reliably regulated by visual experience, and are predicted to target plasticity-related molecular pathways.
Figure 1.

Experience-dependent miRNAs in mouse visual cortex, and detailed analysis of miR-132. (a) Graph showing mean ± S.E.M. relative to control DR and MD ratios with mature miRNA-specific qRT-PCR. One asterisk denotes P < 0.05 and two asterisks P < 0.01, based on two-tailed one-sample Student's t test. (b) Graph showing mean ± S.E.M. relative miRNA levels (normalized to control P28 mean) based on mature miRNA-specific qRT-PCR during development of V1, as well as after different durations of light exposure in DR mice. One asterisk denotes P < 0.05, and two asterisks P < 0.01, based on ANOVA with Dunnett's test for multiple comparisons relative to control P28. (c) Representative images from LNA in situ hybridization of miR-132 in V1 at P28 in control, DR, and MD cases both contralateral (MDc) and ipsilateral (MDi) to the sutured eye. (d) LNA in situ hybridization for miR-132 in the medial edge of contralateral V1 (marked by dotted line).
Focusing on the most highly affected miRNA, miR-132, we demonstrated using qRT-PCR that it is robustly increased after eye-opening and through the critical period for ocular dominance plasticity, and that its diminished expression after DR is gradually normalized after light exposure (Fig. 1b). Furthermore, using locked nucleic acid (LNA) in situ hybridization, we found that expression of miR-132 was reduced in cortical layers 2-4 of V1 after both DR and MD (Fig. 1c-d and Supplementary Figs. 6 and 7), which are sites of rapid ocular dominance plasticity9. Given these observations, we reasoned that miR-132 is well positioned to orchestrate the molecular components of experience-dependent plasticity in V1.
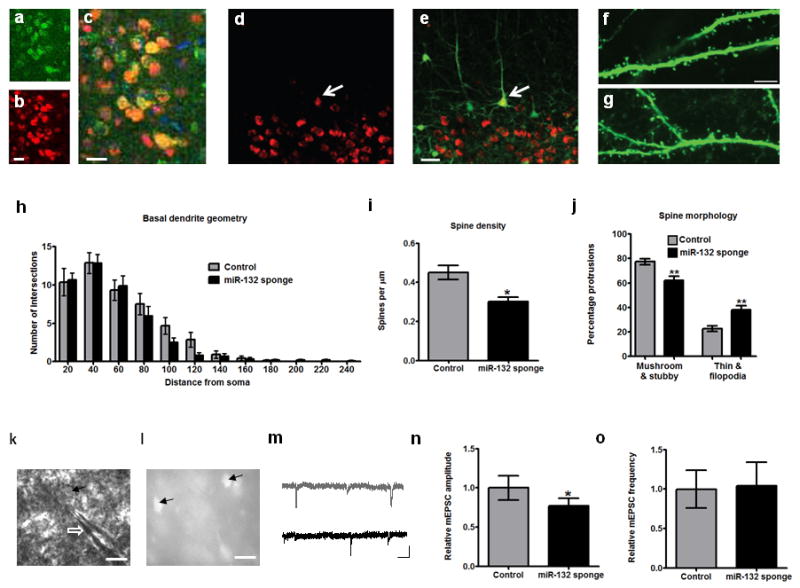
In order to manipulate miR-132 function in vivo, we injected wild type or GFP-S mice with a mCherry-miR-132 sponge-expressing lentivirus that predominantly infects neurons and results in specific “sequestering” of endogenous miR-1324,10 (Supplementary Fig. 8). We then measured levels of p250GAP, a GTPase targeted by miR-132 known to affect spine growth and morphology11-13, and examined structural changes in transfected pyramidal neurons at P28. We found increased levels of p250GAP in mCherry-miR-132 sponge-expressing pyramidal neurons, and reduced spine density, despite normal neuronal size and arborization of sponge-infected neurons after both P5 and P16 injections (Fig. 2a-i and Supplementary Fig. 9a-i). Examination of the changes in spine morphology revealed that miR-132 inhibition resulted in more immature spines (Fig. 2j), mainly by reducing the percentage of mushroom spines and increasing the proportion of immature filopodia (Supplementary Fig. 9j). We assayed for accompanying physiological synaptic changes in sponge-infected neurons by measuring AMPA receptor-dependent spontaneous miniature excitatory postsynaptic currents (mEPSCs), using whole-cell recordings from layer 2/3 pyramidal neurons (Fig. 2k-m). Our results showed no changes in mEPSC frequency, yet a significant reduction in mEPSC amplitude in sponge-infected neurons (Fig. 2n-o). These effects of miR-132 inhibition are consistent with delayed synaptic maturation of pyramidal V1 neurons.
Figure 2.

Structural and electrophysiological effects of miR-132 inhibition. (a-c) Expression of (a) p250GAP, (b) mCherry, as well as their (c) co-localization in mCherry-miR-132 sponge-expressing neurons. DAPI staining is seen in blue in (c). Scale bars = 25 μm. (d-e) Confocal microscope images from GFP-S transgenic mice showing layer 5 mCherry-miR-132 sponge-expressing neurons. mCherry expression is shown in (d), and co-localization with GFP in (e). White arrows point to mCherry and GFP positive neuron used for structural analysis. Scale bar = 50 μm. (f-g) Representative confocal images from secondary dendritic branches of (f) control and (g) miR-132 sponge-infected layer 5 pyramidal neurons used for spine analysis. Scale bar = 5 μm. (h-j) Results (all shown as mean ± S.E.M.) from analysis of (h) dendritic arborization (Sholl analysis), (i) spine density, and (j) spine morphology of sponge-infected and control neurons. One asterisk denotes P < 0.05 and two asterisks P < 0.01, based on two-tailed Student's t test. (k) DIC image showing whole-cell patched pyramidal neuron (arrow) in layer 2/3 of mouse V1. Shadow of patch pipette marked by white open arrow. Scale bar = 20 μm. (l) Image of the same slice showing miR-132 sponge-infected cells (arrows). Scale bar = 40 μm. (m) Representative traces showing mEPSCs recorded from miR-132 sponge-infected and non-infected cells (shown in black and gray, respectively). Scale bar denotes 20 pA, 0.5 sec. (n-o) Histogram showing (n) mean ± S.E.M. amplitude and (o) frequency of mEPSCs recorded from control non-infected (gray) and infected neurons (black; n=9 neurons per group).
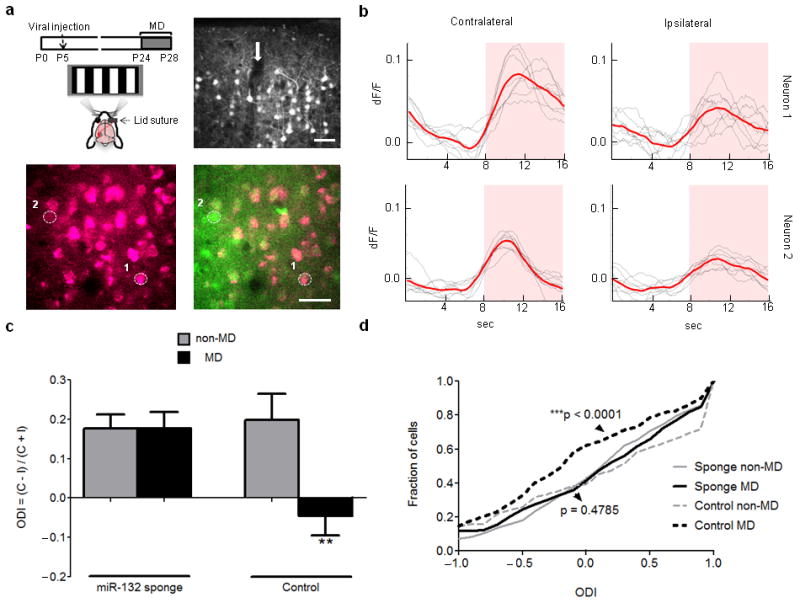
To directly examine the influence of miR-132 on ocular dominance plasticity, we used two-photon calcium imaging to measure the strength of neuronal responses to contralateral and ipsilateral eye stimulation in the binocular area of V1, contralateral to the deprived eye, following neonatal injection of mCherry-miR-132 sponge-expressing virus (Fig. 3a). The relative strength of contralateral and ipsilateral eye-driven responses was quantified by calculating the ocular dominance index (ODI) for each neuron (Fig. 3b). Our results demonstrated that in vivo miR-132 inhibition disrupted the ocular dominance shift that is normally present after four days of MD (Fig. 3c,d). Analysis of eye-specific responses showed that the observed blockade of plasticity was mainly due to prevention of MD effects on contralateral responses (Supplementary Figs. 10 and 11). As expected, neurons that were transfected with the control virus (containing mCherry without the miR-132 sponge sequence) did show a shift in ocular dominance towards the non-deprived eye (Fig. 3c,d). Notably, low miR-132 sponge-expressing neurons (as judged by mCherry load) that were present in the proximity of higher expressing neurons displayed a shift in their ODI comparable to control MD animals (Supplementary Fig. 12a-d), as did non-infected neurons located adjacent to sponge-infected ones (Supplementary Fig. 12e), suggesting a potential threshold for the degree of miR-132 inhibition needed to abrogate ocular dominance plasticity. Thus, miR-132 expression in V1 neurons is essential for plasticity of their responses and underlying circuits.
Figure 3.

In vivo inhibition of miR-132 in V1 neurons disrupts their ocular dominance plasticity. (a) Top left: Schematic of experimental design. Top right: Images from confocal microscopy showing mCherry expression in cortical layers 1-3 at P28 following neonatal injection (arrow) of mCherry-miR-132 sponge-expressing lentivirus. Bottom: Two-photon microscope image showing mCherry expression alone (left) and its overlay with OGB (green) fluorescence (right) in an injected animal that underwent MD; selected neurons used for (b) are circled and numbered. Scale bars = 40 μm. (b) Example of contralateral and ipsilateral eye-driven calcium responses of the neurons shown in (a) that express high (top – neuron 1) or low (bottom - neuron 2) levels of mCherry-miR-132 sponge. Pink shaded area indicates period with visual stimulus. Calculated ODIs are: 0.73 (top – neuron 1), and 0.55 (bottom – neuron 2). (c) Ocular Dominance Index values (ODI = (contra – ipsi) / (contra + ipsi); mean ± S.E.M.) derived from peak visual responses obtained by two-photon calcium imaging in mice injected with mCherry-miR-132 sponge-expressing lentivirus. Black bars show animals subjected to 4 day MD and light gray bars show animals not subjected to MD: miR-132 sponge non-MD: 5 animals, 290 neurons; miR-132 sponge MD: 4 animals, 232 neurons; control non-MD: 3 animals, 120 neurons; control MD: 3 animals, 177 neurons. Note the lack of ODI shift following MD for mice that were injected with miR-132 sponge but not control virus. Control MD animals show a significantly larger ocular dominance shift compared to each of the other conditions (P < 0.01, Mann-Whitney test comparing neurons; P < 0.05 treating each animal as a single datum). (d) Cumulative histogram of ODI data shown in (c). There is a significant difference between control MD and non-MD neurons (black and light gray dotted lines respectively), but not between miR-132 sponge-infected MD and non-MD neurons (black and light gray lines, respectively). P-values shown are based on Kolmogorov–Smirnov test.
Ocular dominance plasticity following MD during the critical period leads to coordinated changes in functional responses of neurons and structural properties of spines7,14,15. Since miR-132 is upregulated after eye-opening through a time window that parallels the critical period, and dark-rearing prevents this upregulation, we hypothesize that light- and hence activity-induced elevation of miR-132 expression is crucial for the initiation of ocular dominance plasticity. Indeed, sequestering miR-132 levels before eye-opening and extending through the critical period prevents both MD-induced functional plasticity and structural maturation of spines. Thus the failure of miR-132 sponge-expressing neurons to exhibit ocular dominance plasticity at P28 likely reflects a shift of the critical period to a later age, effectively by maintaining the cortex in a prior developmental stage. We conclude that experience-dependent upregulation of miR-132 contributes fundamentally to the sensitive period of cortical plasticity.
Supplementary Material
Acknowledgments
We thank Jitendra Sharma and Caroline Runyan for feedback on the manuscript, Gabriel Kreiman for assistance in analysis of data, Martha Constantine-Paton and her laboratory for sharing equipment for structural analysis, and Bibek Karki for excellent technical assistance. N.M. was supported by National Eye Institute (NEI) Ruth L. Kirschstein Postdoctoral Fellowship 1F32EY020066-01. D.E. was supported by the Helmholtz Young Investigator program HZ-NG-607 and A.B. is supported by a Simons Foundation postdoctoral fellowship. Supported by NIH grants EY017098 and EY007023 to M.S.
Footnotes
Author Contributions: N.M. conceived the hypothesis, designed and executed experiments, analyzed data and wrote the manuscript. H.S. conducted in vivo two-photon calcium imaging and analyzed related data. J.C. conducted neonatal virus injections and structural analysis. A.B. carried out slice electrophysiology. A.B., C.L., A.K., B.C., J.C. and D.T. assisted in various experiments, data analysis and figure preparation. J.S. and D.E. constructed and tested lentivirus vectors, and S.L. performed miRNA microarray experiments. M.S. supervised and orchestrated all experiments and wrote the manuscript together with N.M.
Accession codes. Gene Expression Omnibus: GSE31536.
References
- 1.Bartel DP. Cell. 2004;116:281–297. doi: 10.1016/s0092-8674(04)00045-5. [DOI] [PubMed] [Google Scholar]
- 2.Giraldez AJ, et al. Science. 2005;308:833–838. doi: 10.1126/science.1109020. [DOI] [PubMed] [Google Scholar]
- 3.Schratt GM, et al. Nature. 2006;439:283–289. doi: 10.1038/nature04367. [DOI] [PubMed] [Google Scholar]
- 4.Edbauer D, et al. Neuron. 2010;65:373–384. doi: 10.1016/j.neuron.2010.01.005. [DOI] [PMC free article] [PubMed] [Google Scholar]
- 5.Gordon JA, Stryker MP. J Neurosci. 1996;16:3274–3286. doi: 10.1523/JNEUROSCI.16-10-03274.1996. [DOI] [PMC free article] [PubMed] [Google Scholar]
- 6.Frenkel MY, Bear MF. Neuron. 2004;44:917–923. doi: 10.1016/j.neuron.2004.12.003. [DOI] [PubMed] [Google Scholar]
- 7.Hensch TK. Nat Rev Neurosci. 2005;6:877–888. doi: 10.1038/nrn1787. [DOI] [PubMed] [Google Scholar]
- 8.Tusher VG, Tibshiran R, Chu G. Proc Natl Acad Sci USA. 2001;98:5116–5121. doi: 10.1073/pnas.091062498. [DOI] [PMC free article] [PubMed] [Google Scholar]
- 9.Trachtenberg JT, Trepel C, Stryker MP. Science. 2000;287:2029–2032. doi: 10.1126/science.287.5460.2029. [DOI] [PMC free article] [PubMed] [Google Scholar]
- 10.Ebert MS, Neilson JR, Sharp PA. Nat Methods. 2007;4:721–726. doi: 10.1038/nmeth1079. [DOI] [PMC free article] [PubMed] [Google Scholar]
- 11.Vo N, et al. Proc Natl Acad Sci USA. 2005;102:16426–16431. doi: 10.1073/pnas.0508448102. [DOI] [PMC free article] [PubMed] [Google Scholar]
- 12.Wayman GA, et al. Proc Natl Acad Sci USA. 2008;105:9093–9098. doi: 10.1073/pnas.0803072105. [DOI] [PMC free article] [PubMed] [Google Scholar]
- 13.Impey S, et al. Mol Cell Neurosci. 2010;43:146–156. doi: 10.1016/j.mcn.2009.10.005. [DOI] [PMC free article] [PubMed] [Google Scholar]
- 14.Mataga N, Mizuguchi Y, Hensch TK. Neuron. 2004;44:1031–1041. doi: 10.1016/j.neuron.2004.11.028. [DOI] [PubMed] [Google Scholar]
- 15.Oray S, Majewska A, Sur M. Neuron. 2004;44:1021–1030. doi: 10.1016/j.neuron.2004.12.001. [DOI] [PubMed] [Google Scholar]
Associated Data
This section collects any data citations, data availability statements, or supplementary materials included in this article.


