Abstract
Pulsed Q collision induced dissociation (PQD) was developed to facilitate detection of low-mass reporter ions from labeling reagents (e.g. iTRAQ) in peptide quantification using an LTQ mass spectrometer (MS). Despite the large number of linear ion traps worldwide, the use and optimization of PQD for protein identification have been limited, in part due to less effective ion fragmentation relative to the collision induced dissociation (CID). PQD expands the m/z coverage of fragment ions to the lower m/z range by circumventing the typical low mass cut-off of an ion trap MS. Since database searching relies on the matching between theoretical and observed spectra, it is not clear how ion intensity and peak number might affect the outcomes of a database search. In this report, we systematically evaluated the attributes of PQD mass spectra, performed intensity optimization, and assessed the benefits of using PQD on the identification of peptides and phosphopeptides from an LTQ. Based on head-to-head comparisons between CID (higher intensity) and PQD (better m/z coverage), peptides identified using PQD generally have Xcorr scores lower than those using CID. Such score differences were considerably diminished by the use of 0.1% m-nitrobenzyl alcohol (m-NBA) in mobile phases. The ion intensities of both CID and PQD were adversely affected by increasing m/z of the precursor, with PQD more sensitive than CID. In addition to negating the 1/3 rule, PQD enhances direct bond cleavage and generates patterns of fragment ions different from those of CID, particularly for peptides with a labile functional group (e.g. phosphopeptides). The higher energy fragmentation pathway of PQD on peptide fragmentation was further compared to those of CID and the quadrupole-type activation in parallel experiments.
Keywords: Pulsed Q collision induced dissociation (PQD), linear ion trap, triple quadrupole (QqQ), protein identification
INTRODUCTION
Linear ion trap (LIT) is one of the most extensively utilized mass spectrometers in proteomic research [1, 2]. LIT employs resonance excitation during the collision-induced dissociation (CID) and is subject to the low mass cut off (LMCO) effect. LMCO exists because only ions above a certain m/z are trapped with stable trajectories at a particular qeject value in a quadrupole ion trap [1]. Such an LMCO effect, dubbed the “1/3 rule”, prevents ion trap mass spectrometers from detecting immonium ions or sequencing ions less than ~1/3 m/z of precursor peptides.
Pulsed Q collision induced dissociation (PQD) was developed aiming to eliminate the LMCO effect using LTQ. PQD is regarded as a 3-step process: 1) a short (100 μs vs. 30 ms in CID) precursor ion activation under a higher Q (0.7) and higher amplitude (8× that of CID); 2) the conversion of kinetic energy to internal energy at the high Q for a short period of time (a delay time of ~100 μs); and 3) the dissociation after Q pulsed down to trap fragment ions as low as 50 m/z [2]. In contrast, CID is a 2-step process: both precursor ion activation and dissociation occur at a constant activation Q of 0.25 [2]. In either PQD or CID, the fragmentation occurs over a similar time scale and activation is achieved using supplementary voltage at a frequency equal to the distinct secular frequency of the precursor ion. From resonance excitation, the activated precursor ion gradually gains kinetic energy, which is converted to internal energy via collisions with the bath gas, leading to subsequent fragmentation [3].
Despite the large number of linear ion traps worldwide, reports on the use of PQD or its optimization for protein identification have been limited. This might in part be ascribed to the less effective fragmentation of PQD, compared to the CID [4, 5], as well as the greater interest of researchers in using PQD for proteomic quantification [4–10]. Although PQD spectra generally have a lower overall intensity, they expand the m/z coverage of fragment ions to the lower m/z range. While many database search algorithms rely on the matching of ion peaks and masses between observed and theoretical peptide spectra, they do not capitalize on the information of ion intensities. Given that PQD enhances direct bond cleavage [2], the intensities of fragment ions from PQD could be different from those of CID, particularly for those peptides with a labile functional group such as phosphopeptides (p-peptides). Thus, it would be of interest to see if PQD might yield information complementary to CID for peptide identification.
In this study, we focused on the identification of proteins by systematically exploring attributes of PQD mass spectra, parameters affecting peak intensity, and the potential benefit of performing PQD to identify peptides and p-peptides. We also compared the fragmentation pathway of PQD to that obtained from CID or quadrupole-type activation.
MATERIALS AND METHODS
Proteins, peptides, and cell lysates
Bovine serum albumin, β-galactosidase, α-lactalbumin, β-lactoglobulin, lysozyme, apotransferrin, myoglobin, glu1-fibrinopeptide B (Glu-Fib), angiotensin I, and m-nitrobenzyl alcohol (m-NBA) were obtained from Sigma (St. Louis, MO). P-peptides were purchased from Waters (Milford, MA), Sigma, Invitrogen (Carlsbad, CA), and custom synthesized. Peptide standards and ß-galactosidase tryptic digest were obtained from Applied Biosystems (Framingham, MA). Murine S49 wild type (WT) lymphoma cell lines were cultured in Dulbecco's modified Eagle's medium supplemented with 10% heat-inactivated horse serum and 10 mM Hepes (pH 7.4) in a humidified incubator at 37°C and 5% CO2. For protein extraction, cells were cultured to a density of ~3 × 10⁶ cells/ml, harvested by centrifugation at 1,200 rpm (306× g), and pellets were washed 6 times with PBS. The cells were sonicated five times (10 s each) with 1× protease and phosphatase inhibitor cocktail solution (Pierce, Rockford, IL) and centrifuged at 100,000× g for 60 min. The supernatant was saved as the cell lysate.
Phosphoproteins (p-proteins) preparation
P-proteins of WT S49 cells were extracted using a commercial IMAC (immobilized metal affinity chromatography) enrichment kit (Clontech, Mountain View, CA). The eluted p-proteins were desalted using PD10 columns (GE Healthcare, UK) in 50 mM ammonium bicarbonate prior to tryptic digestion.
Liquid chromatography and ion trap mass spectrometry
Reduction, alkylation and tryptic digestion of proteins were performed as described previously [11]. All samples (synthetic peptides, 0.2 μg six-protein mixture, and 0.4 μg IMAC enriched S49 WT p-proteins) were analyzed using a Thermo Fisher Scientific linear ion trap (LTQ/Orbitrap XL) by infusion or C18 reversed phase chromatography. For the latter, the elution was achieved with a linear gradient (2–60% mobile phase B) for 25 or 55 min, or otherwise specified [11]. In selected experiments, 0.1% m-NBA was added in both mobile phases A (water with 0.1% formic acid) and B (acetonitrile with 0.1% formic acid). The data-dependent acquisition mode was enabled, and each survey MS scan was followed by 4 MS/MS scans (alternating CID/PQD on a common precursor ion), with the dynamic exclusion option. CID/PQDdefault denotes an alternate scheme with CID and default PQD parameter settings (activation Q of 0.7; activation time of 0.1 ms); while CID/PQDmodified denotes an alternate scheme with CID and modified PQD parameter settings (activation Q of 0.55; activation time of 0.4 ms) [5]. The spray voltage and ion transfer tube temperature were set at 1.8 kV and 160°C, respectively.
Database search
SEQUEST/Bioworks 3.3.1 SP1 was used to match MS/MS spectra to peptides in the SwissProt human or mouse databases. Spectra/peptide matches were considered significant if the following criteria were met: a normalized difference in cross-correlation score (ΔCn) of at least 0.08; minimum cross-correlation score (XCorr) of 1.5 for +1, 2.0 for +2, and 2.5 for +3 charged ions; max XCorr rank 1, and max Sp rank ≤ 10.
Software program to perform in silico protein digestion and fragmentation
A specific software program (FragIonStat.cpp) was written in C++ to perform in silico enzyme digestion and ion fragmentation. Several rules were followed to generate the in silico tryptic peptides: 1) enzymatic digestion at K or R; 2) no miscleavage; 3) charge state of either 2 (no internal histidine) or 3 (with one internal histidine); and 4) precursor ion in the range of 400–1500 m/z. Peptides with ≥ 2 internal histidines were disregarded, as they add complexity to our modeling. Moreover, the formation of fragment ions diminishes due to the sequestration of the mobile proton by the multiple histidines.
Triple quadrupole mass spectrometry
Selected experiments were conducted on a QTrap 4000 MS equipped with a Tempo nano MDLC system and a nanospray ion source (Applied Biosystems). Spray voltage, ion transfer tube temperature, curtain gas, ion source gas 1, and declustering potential were set at 2.4 kV, 140°C, 10, 20, and 70, respectively. Q1 and Q3 were set at unit resolution (0.7 Da) with scan rate of 4,000 m/z per sec. The collision energy was determined based on the mass and charge state of the given precursor ion, following the manufacturer's rolling collision energy algorithm. Data analysis was performed using the Analyst software (version 1.5).
RESULTS AND DISCUSSION
Factors affecting PQD fragmentation efficiency
As reported earlier by others [4, 5], PQD is not as effective as CID in precursor fragmentation, although the underlying cause has not been adequately defined. We speculated that it might be the consequence of competition between resonance excitation and resonance ejection [3]. In CID, a relatively low voltage (≤ 1–2 V) is used in resonance excitation for ions to gain kinetic energy but remain inside the trap; while higher energy (3–30 V) is employed in resonance ejection to exceed the ion trapping field and elicit ion ejection [12]. The higher excitation amplitude used in PQD may cause a fraction of the precursor ions to be ejected before complete fragmentation takes place, resulting in reduced intensities of the product ions. It is also likely that a fraction of the activated precursor ions undergo dissociation during the 100 μs delay, thus reducing the detectable product ions. An approach, termed HASTE (High Amplitude Short Time Excitation), which pulses down Q after activation to observe ions below the LMCO, performs activation at a conventional Q value of 0.25 [13]. Compared to HASTE, the trapping-well depths for precursor ions under PQD are deeper (due to higher Q applied), which presumably reducing the chance of undesirable resonance ejection of precursor ions.
To assess collision energy (CE) dependency, the peptide Glu-Fib was fragmented by varying the CE under CID or PQD. Supplemental Fig. 1a shows that the optimized CECID spreads over a broad peak and plateaus at 15–40% CE, while the optimized CEPQD has a sharper peak that centers around 30% CE (suppl. Fig. 1b). These observations are consistent with those previously reported [6, 8]. However, more careful analysis revealed that these seemingly different CE optimization plots are actually very similar if one takes into consideration the scales of energy inputs used during the optimization. The resonance excitation amplitude used for a selected CE under PQD is ~8X that of CID. If the percent collision energy (normalized CE) on the x axis is replaced with the actual resonance excitation voltage, the peak widths of CID and PQD would be quite comparable. The practical implication is that CEPQD has to be more delicately tuned, due to the greater stride in energy per percentage change, to derive the optimal CE range for fragmentation.
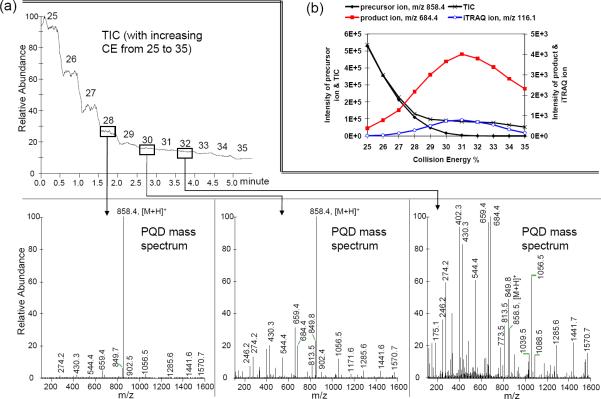
The effect of CE on ion intensity using PQD was further illustrated with iTRAQ-labeled Glu-Fib. The TIC profile at various CEPQD (25–35%) is shown at the top panel of Fig. 1a. At CE of 28%, the prominent ion is the unfragmented precursor (m/z 858.4). Around CE ~30%, both the precursor and fragment ions are clearly noticeable. This is different from the typical CID spectrum in which the precursor ion is often less prominent, if not totally negligible, at this CE level. Above CE 30%, the precursor ion significantly diminishes (CE 32%, Fig. 1a). The effects of CE on TIC and intensities of the precursor, product, and reporter ions are shown in Fig. 1(b); both TIC and precursor ion intensity decrease rapidly between 25 and 28% CE. The precursor ion accounts for the bulk of the TIC (see Fig. 1a, lower left). Of note, at CEs between 29 and 32%, there is a continued decline of the precursor ion intensity but the TIC only decreases slightly. CE at 31% appears to be optimal for both the monitored product (m/z 684.4) and the iTRAQ ions.
Figure 1.
(a) Total ion current (TIC) profile with increasing collision energy (CEPQD) on iTRAQ-labeled Glu-Fib B (0.5 pmol/μl). Samples were infused at 0.5 pmol/μl and the energy level was varied every 0.5 min. (b) Effect of increasing CEPQD on TIC of the precursor ion, a selected product ion, and an iTRAQion.
Table 1 lists the optimized CE ranges and associated total ion currents (TIC of MS2) for a variety of peptides. The optimal CEPQD for peptides with +1 to +4 charges ranges from 27 to 31% (Table 1a) on our LTQ. We noted that decreasing optimal CEPQD tends to occur with increasing charge state of the same peptide, e.g., ACTH (clip 1–17, +3 to +5) and peptide DVSLLHKPTTQISDFHVATR of ß galactosidase (+4 to +5). This charge-state dependency is also noted in the CECID for those peptides, although the ranges of “optimal” CID are much broader. This finding reiterates the importance of fine-tuning CEPQD in order to achieve optimal fragmentation of a target peptide. When CID is performed in a data-dependent manner, LTQ uses default %CE that have been normalized (often at 35%) according to the m/z of the precursors [14] and users seldom have to make adjustments. The observation thus suggests that there might be room for improving fragmentation, particular for peptides that exist in higher charge state >4.
Table 1.
The optimized CE ranges for listed transitions and total ion currents (TIC) of full-scan MS2 ions of synthetic and tryptic peptides. The peptides were infused at a concentration of 0.5–1 pmol/μl and a flow rate of 0.5 μl/min
| (a) transitions involving sequence ions. | ||||
|---|---|---|---|---|
| Peptides | Optimal CE and associated TIC |
|||
| CID | TIC* | PQD# | TIC | |
| MRFA | 15–45% | 2.6E5 | 30% | 1.7E5 |
| 524.4 (+1) → 288.2 (+1,b2) | ||||
|
| ||||
| Des-Arg1-bradykinin, PPGFSPFR | 15–60% | 5.5E5 | 31% | 5.3E5 |
| 452.7 (+2) → 404.4 (+2,y7) | ||||
|
| ||||
| Angiotensin I, DRVYIHPFHL | 15–40% | 5.7E5 | 29% | 5.6E5 |
| 432.9 (+3) → 583.6 (+2, b9) | ||||
|
| ||||
| Glu1-fibrinopeptide B, EGVNDNEEGFFSAR | 15–40% | 1.8E5 | 30% | 6.5E4 |
| 785.8 (+2) → 684.4 (+1,y6) | ||||
|
| ||||
| ACTH (clip 1–17), SYSMEHFRWGKPVGKKR | 12–50% | 5.2E4 | 31% | 2.3E4 |
| 698.4 (+3) → 922.4 (+2, y15) | ||||
|
| ||||
| ACTH (clip 1–17), SYSMEHFRWGKPVGKKR | 12–40% | 4.3E5 | 28% | 3.5E5 |
| 524.0 (+4) → 615.3 (+3, y15) | ||||
|
| ||||
| ACTH (clip 1–17), SYSMEHFRWGKPVGKKR | 12–40% | 3.5E5 | 26% | 3.0E5 |
| 419.4 (+5) → 461.9 (+4, y15) | ||||
|
| ||||
| ACTH (clip 18–39), RPVKVYPNGAEDESAEAFPLEF | 15–40% | 2.1E5 | 27% | 6.9E4 |
| 822.4 (+3) → 1086.3 (+2, b20) | ||||
|
| ||||
| ACTH (clip 7–38), FRWGKPVGKKRRPVKVYPNGAEDESAEAFPLE | 15–45% | 3.7E5 | 27% | 1.7E5 |
| 732.4 (+5) → 789.6 (+4, b28) | ||||
|
| ||||
| (myoglobin tryptic digest) YLEFISDAIIHVLHSK | 15–40% | 7.2E5 | 28% | 1.3E5 |
| 943.4 (+2) → 720.5 (+1,y6) | ||||
|
| ||||
| (myoglobin tryptic digest) ALELFR | 15–35% | 2.5E5 | 30% | 3.0E5 |
| 748.6 (+1) → 435.3 (+1,y3) | ||||
|
| ||||
| (myoglobin tryptic digest) HGTVVLTALGGILK | 20–40% | 2.2E5 | 28% | 1.2E4 |
| 1378.8 (+1) → 1119.7 (+1,bl2) | ||||
|
| ||||
| (myoglobin tryptic digest) LFTGHPETLEK | 20–45% | 1.5E5 | 31% | 2.3E4 |
| 1271.7 (+1) → 716.5 (+1,y6) | ||||
|
| ||||
| (myoglobin tryptic digest) GLSDGEWQQVLNVWGK | 20–40% | 9.2E3 | 31% | 8.5E2 |
| 1815.9 (+1) → 1443.7 (+1,yl2) | ||||
|
| ||||
| (myoglobin tryptic digest) VEADIAGHGQEVLIR | 21–42% | 6.3E4 | 31% | 2.4E3 |
| 1606.9 (+1) → 1192.7 (+1,y11) | ||||
|
| ||||
| (β gal tryptic digest) IDPNAWVER | 15–45% | 1.2E6 | 28% | 4.6E5 |
| 550.3 (+2) → 589.5 (+1,y4) | ||||
|
| ||||
| (β gal tryptic digest) VDEDQPFPAVPK | 15–40% | 7.0E5 | 27% | 3.9E5 |
| 671.3 (+2) → 755.5 (+1,y7) | ||||
|
| ||||
| (β gal tryptic digest) APLDNDIGVSEATR | 15–40% | 7.2E5 | 29% | 2.2E5 |
| 729.4 (+2) → 719.5 (+1,y7) | ||||
|
| ||||
| (β gal tryptic digest) DVSLLHKPTTQISDFHVATR | 20–45% | 5.2E6 | 27% | 4.3E6 |
| 567.7 (+4) → 684.9 (+3, y18) | ||||
|
| ||||
| (β gal tryptic digest) DVSLLHKPTTQISDFHVATR | 10–45% | 3.1E6 | 25% | 2.9E6 |
| 454.5 (+5) → 513.8 (+4, y18) | ||||
|
| ||||
| HTVLYISPPPEDLLDNSR | 15–50% | 1.8E6 | 30% | 5.4E5 |
| 690.2 (+3) → 717.4 (+1,y6) | ||||
|
| ||||
| HTVLYISPPPEDLLDNS(phos)R | 15–45% | 3.6E5 | 31% | 7.5E4 |
| 716.9 (+3) → 358.3 (+1, y3 - H3PO4) | ||||
| FQS(phos)EEQQQTEDELQDK (β casein) | 20–40% | 9.1E4 | 30% | 8.7E3 |
| 1031.7 (+2) → 747.4 (+1,y6) | ||||
| HLADLS(phos)K | 15–30% | 9.5E5 | 29% | 7.6E5 |
| 432.2 (+2) → 437.3 (+1,M) | ||||
| VNQIGT(phos)LSESIK | 15–50% | 7.7E5 | 30% | 2.8E5 |
| 684.8 (+2) → 816.2 (+1, y8 - H3PO4) | ||||
| VNQIGTLS(phos)ES(phos)IK | 15–45% | 9.9E4 | 29% | 3.5E4 |
| 724.8 (+2) → 896.4 (+1, y8 - H3PO4) | ||||
| (b) transitions involving preferential neutral loss or cleavages N terminal to proline. | ||||
|---|---|---|---|---|
| Peptides | Optimal CE and associated TIC |
|||
| CID | TIC* | PQD# | TIC | |
| HTVLYISPPPEDLLDNSR | 15–50% | 1.8E6 | 25% | 1.3E6 |
| 690.2 (+3) → 627.2 (+2, y11) | ||||
|
| ||||
| NVPLY(phos)K | 15–50% | 2.7E5 | 26% | 2.4E5 |
| 407.2 (+2) → 600.4 (+1,y4) | ||||
|
| ||||
| FQS(phos)EEQQQTEDELQDK (β casein) | 20–40% | 9.1E4 | 26% | 1.3E4 |
| 1031.7(+2) → 982.6 (4–2, neutral loss of phos) | ||||
|
| ||||
| HLADLS(phos)K | 15–50% | 9.5E5 | 27% | 9.2E5 |
| 432.2 (42) → 383.3 (42, neutral loss of phos) | ||||
|
| ||||
| VNQIGT(phos)LSESIK | 15–45% | 7.7E5 | 25% | 7.7E5 |
| 684.8 (42) → 635.9 (42, neutral loss of phos) | ||||
|
| ||||
| VNQIGTLS(phos)ES(phos)IK | 15–40% | 9.9E4 | 25% | 9.4E4 |
| 724.8 (42) → 676.0 (42, neutral loss of phos) | ||||
TIC at CE of 35%.
default settings (activation Q of 0.7 and activation time of 0.1 ms).
A slight decrease in CEPQD (25–27%) was observed for peptides susceptible to neutral losses (e.g. p-peptides) or to facile backbone cleavage at N-terminal to P (Table 1b). Both HTVLYISPPPEDLLDNSR and NVPLY(phos)K contain no potential neutral loss modification at the transitions studied but have relatively low CEPQD. The two peptides likely can be preferentially fragmented at the N-terminal to P due to multiple P and an enhanced V–P cleavage [15], respectively. On average, the TICPQD was 49% of TICCID for ions resulted from peptide bond cleavage (the typical b or y ions); and 78% of TICCID for those due to neutral loss (e.g., loss of phosphoric acid) or bond cleavage at N terminal to P (Table 1b), respectively.
When TIC was plotted against precursor m/z (from Table 1), both CID and PQD show a trend of decreasing fragmentation efficacy as the precursor m/z becomes larger (Fig. 2), consistent with a previous report showing that collisional activation mechanism is less effective in dissociating high mass ions [3]. The m/z effect is more obvious with PQD, as reflected by < 100% TICPQD/TICCID ratios (Fig. 2, red circles). However, there are instances in which TICPQD is greater than (e.g. peptide ALELFR) or nearly equal to (e.g., peptide VNQIGT(phos)LSESIK) TICCID. For ALELFR, the higher TICPQD could be attributed to several low mass fragments (y1, b2, and immonium ions) that otherwise would not register in TICCID due to LMCO of m/z 205 (data not shown).
Figure 2.
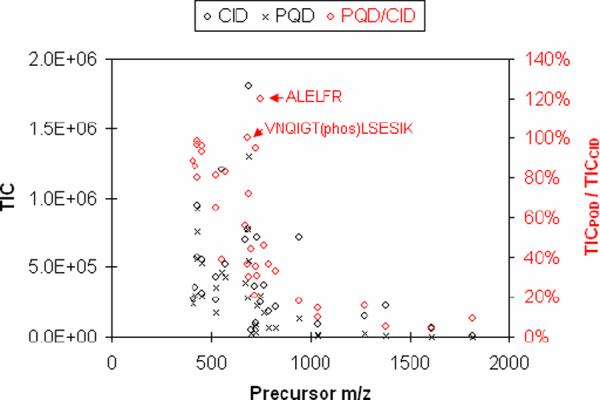
The levels of TIC of full-scan MSMS using CID (black diamond) or PQD (cross) at different precursor m/z (left y axis); and relative ratios of TICPQD/TICCID (red diamond), as indicated by the right y axis.
It had been noted that the fragment ion intensities using PQD were 2–4 fold lower than those using CID [4, 5, 8]. In our hands, reduction in fragmentation efficiency could be as high as 90%, i.e., TICCID/TICPQD=~10). The decrease in fragmentation efficiency with increasing precursor m/z (Fig. 2) suggests that trypsin is preferred over Arg-C or Lys-C for PQD, as it generates shorter peptides (smaller m/z). In addition, the upper mass limit in PQD methods could be set at 1,500 or less to confine the duty cycle within a mass range likely to yield higher fragment ions.
Application of PQD to peptide identification
The use of PQD enables detection of low m/z ions in the spectra, which are typically excluded from CID spectra due to LMCO. To assess the extent of better ion coverage by PQD (relative to CID), a C++ program (FragIonStat.cpp, see “Materials and Methods”) was written and used to count detectable fragment ions from peptides generated by in silico digestion of human RefSeq protein sequences (38,072 entries). A total of 432,805 unique peptides were generated. The numbers of b or y ions detectable under PQD and CID are 14,156,991 and 12,944,609 respectively, suggesting that nearly 10% of b or y ions are lost upon CID due to LMCO.
We tested two alternate CID/PQD fragmentation methods, CID/PQDdefault and CID/PQDmodified using a 6-protein mixture. Supplement Tables 1 & 2 list peptides identified and their associated database search results. For comparison, we also show Xcorr scores using CID or PQD alone. Table 2 summarizes the number of peptides identified for each protein. PQDmodified settings are reported to increase iTRAQ reporter ion intensities and to improve reliability in quantification [5], but effect on protein identification has not been described. From the greater number of peptide identified (Table 2), PQDmodified appears to improve protein identification. However, we found >75% and ~70% of peptides identified using PQDdefault and PQDmodified, respectively, have XCorr scores less than the same peptides identified with CID (Suppl. Fig. 2). Thus, despite the improved coverage of sequencing ions, no apparent improvement in peptide identification (i.e., XCorr) occurs by the use of PQD. The higher fragment ion intensity of CID probably outweighs the improved sequencing ion coverage of PQD.
Table 2.
The number of peptides identified with PQDdefault or PQDmodified settings from the trptic digest of a six-protein mixture.
| ALBU | TRFE | BGAL | LACB | LALBA | LYSC | |
|---|---|---|---|---|---|---|
| # of peptide ID in PQDdefault | 142 | 104 | 38 | 126 | 38 | 170 |
| # of peptide ID in PQDmodified | 159 | 120 | 52 | 162 | 51 | 192 |
Abbreviations: bovine serum albumin (ALBU), apotransferrin (TRFE), β-galactosidase (BGAL), βlactoglobulin (LACB), βlactalbumin (LALBA), lysozyme (LYSC).
Kjeldsen et al reported that inclusion of 0.1% m-nitrobenzyl alcohol (m-NBA) in the mobile phases significantly improves peptide sequencing by electron transfer dissociation (ETD) [16]. The benefit was ascribed to the shifting to higher charge states of tryptic peptides, without an appreciable effect on chromatography [16]. Since the fragmentation efficiency of PQD declines more rapidly than CID with increasing m/z (Fig. 2), we hypothesize that by promoting a peptide to higher charge states (e.g. +2 → +3, thus deceasing m/z) under PQD fragmentation, one might achieve better protein identification. We thus added 0.1% m-NBA in the mobile phase buffers (both A and B) and analyzed the 6-protien digest using the alternate CID/PQDmodified method. The Xcorr scores and XcorrPQD/XcorrCID ratios of peptides, obtained by database searching, are shown in Suppl. Table 3. The improvement in Xcorr scores by using m-NBA in the buffers is apparent from the scores presented by the box and whisker plot shown in Supplement Fig. 2 (from PQDmodified to PQDmodified using m-NBA, the mean score improved from 0.90 to 0.98 and the p-value from a 2-sample t-Test was 1.02E-14). Such improvement in Xcorr scores, together with the benefit of overcoming the LMCO effect, should expand the utility of PQD in applications where detection of small ion fragments is desirable. For example, despite not being weighted in the algorithm of Sequest-based searching engines such as BioWorks [17], immonium ions or small N- or C-terminal fragments (e.g. y1, etc.) in a spectrum may assist in manual peptide identification, especially for those with borderline scores. In general, b1 ions are not stable enough to be observed during the fragmentation of underivatized peptides [18]. However, derivatization at the N-terminus with iTRAQ promotes the formation of b1 ions [19], which are readily observable under the PQD mode.
Higher energy fragmentation pathway of PQD and application to p-peptide identification
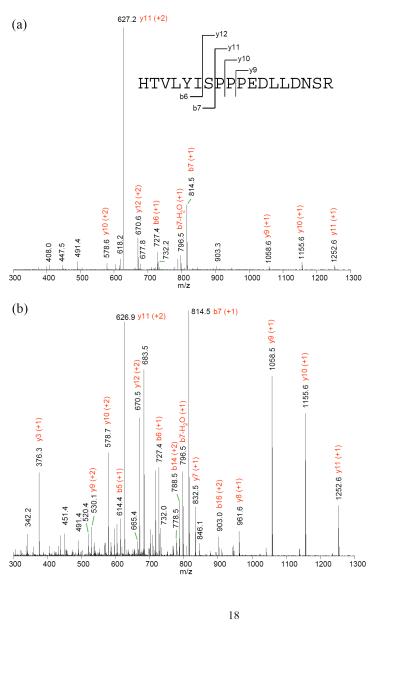
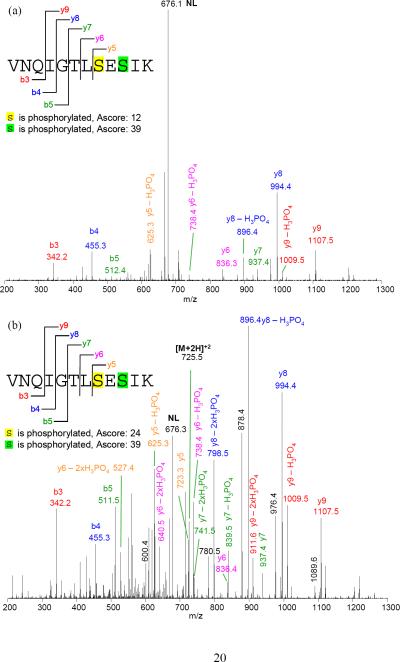
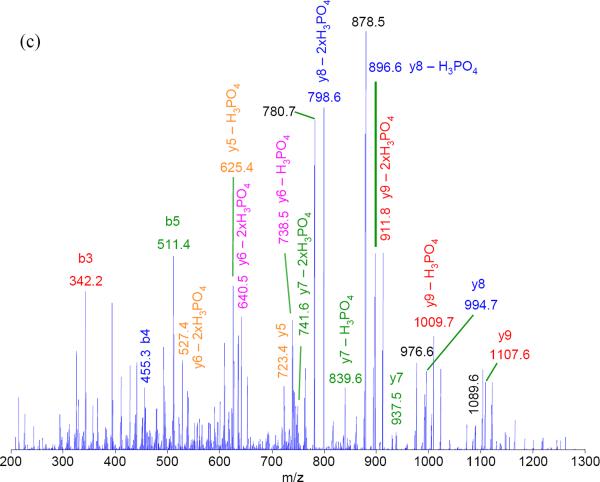
The spectra from PQD resemble those of a triple quadrupole mass spectrometer (QqQ). Fig. 3 illustrates such resemblance by comparing the spectra of a peptide HTVLYISPPPEDLLDNSR (+3) using PQD or CID on an LTQ or beam-type fragmentation method on a QqQ (ABI Qtrap 4000). The prevalence of y ions cleaved at N-terminal to P under CID could be explained from the “mobile proton” model of peptide fragmentation [20] and the “proline” effect (due to its high gas phase basicity [15]). In contrast, breaks that are more even at peptide bonds are seen with PQD, presumably due to more energetic collisions of the precursor ion with the bath gas via higher energy fragmentation pathways. Similar to the HASTE approach, more internal energy is deposited to the precursor ion under PQD [13]. The higher energy fragmentation pathway likely promotes delocalizing protons from sequestered sites to generate more even cleavage across the peptide backbone (Fig. 3b). Thus, a PQD spectrum (Fig. 3b) bears resemblance to that of QqQ (Fig. 3c). The preferential fragmentation at the N-terminal to P in CID has been well noted [15, 20], although difference in mass spectral features between CID and PQD is not always as marked as seen with the peptide HTVLYISPPPEDLLDNSR (e.g., see CID and PQD of angiotensin I, DRVYIHPFHL, in Suppl. Fig. 3). However the prevalence of y ions cleaved at N-terminal to P in CID, if observed, well resembles the neutral loss ions from p-peptides. A well-recognized drawback using ion-trap CID on Ser- or Thr-containing p-peptides is the formation of “neutral loss” ions due to inefficient peptide-bond cleavages. While CID works by resonance excitation of a precursor ion with defined supplementary voltage, the derived “neutral loss' ion [e.g., loss 98 Da (-H3PO4) from a p-peptide] is no longer in resonance with the applied voltage. Hence, no additional kinetic energy is gained and the ion is cooled down by the bath gas [13]. In contrast, QqQ MS uses beam-type CID to cleave the backbone of a peptide en route to Q3 whether it is a precursor or a product, thus generating richer sequence information [21]. Figures 4a–c demonstrate the tandem mass spectra of the peptide VNQIGTLS(phos)ES(phos)IK using CID, PQD, and QqQ-type collision. The facile neutral loss cleavage seen with CID (Fig. 4a) is not as prominent with PQD (Fig. 4b), while the PQD spectrum resembles that of QqQ-type collision (Fig. 4c). Similar observation was noted with a mono-phosphorylated peptide FQS(phos)EEQQQTEDELQDK (Suppl. Fig. 4).
Figure 3.
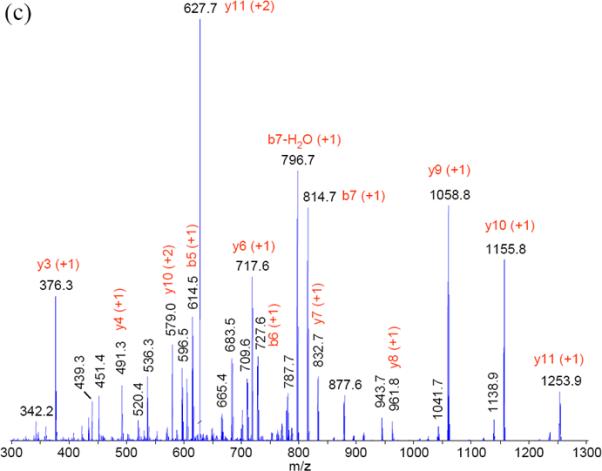
(a) CID and (b) PQD mass spectra of triply charged HTVLYISPPPEDLLDNSR (from ToneBP protein) acquired at collision energy of 35% on an LTQ. (c) mass spectrum acquired with triple quadrupole-type collision at CE 33 on a QTrap 4000 MS.
Figure 4.
Tandem mass spectra of (a) conventional CID, (b) PQD, and (c) triple quadrupole-type collision, respectively, of VNQIGTLS(phos)ES(phos)IK. Some fragment ions are labeled. The collision energy were 35%, 28%, and 41 for CID, PQD, and QqQ (based on rolling collision energy of Qtrap 4000), respectively.
To evaluate whether such direct bond cleavage can aid in p-peptide identification in a complex proteome, we analyze a tryptic digest of IMAC-enriched p-proteins from S49 cell lysates. We used the alternate CID and PQD method akin to that described above for the 6-protein mixture. We identified 124 and 126 proteins using the CID/PQDdefault and CID/PQDmodified settings, respectively (see Suppl. Tables 4 and 5). At least one p-peptide was identified for 66 proteins (53%) detected from CID/PQDdefault and 75 proteins (60%) with CID/PQDmodified. Fig. 5 shows the ratios of XCorr scores (XcorrPQD/XcorrCID) for p-proteins using the alternate CID/PQDdefault or CID/PQDmodified (from Suppl. Tables 4 and 5). Most ppeptides identified with PQDdefault have lower XCorr scores relative to the counterparts identified with CID but p-peptides identified with PQDmodified have XCorr scores comparable to those obtained using CID. Given that PQDmodified obviates the LMCO effect without compromising XCorr scores, it may potentially serve as an alternative method to CID for p-peptide analysis.
Figure 5.
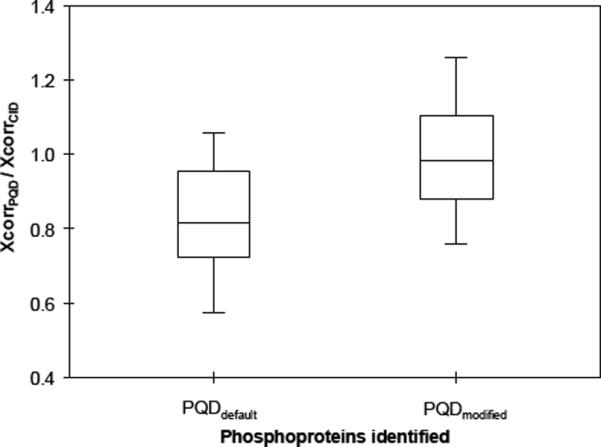
Box and whisker plot of relative Xcorr scores (XcorrPQD/XcorrCID), using PQDdefault and PQDmodified settings, for the phosphoproteins identified with at least two distinct p-peptides.
To assess the precision of assigning sites of phosphorylation, we used the Ascore program which measures the probability of a correct phosphorylation site based on the presence and intensity of site-determining ions in an MS/MS spectrum [22]. The Ascore for the S8 phosphorylation on a short p-peptide VNQIGTLS(phos)ES(phos)IK (m/z: 724.8) from CID was considered “insignificant” (Ascore < 19, Fig. 4a), yet 99% confident (Ascore >19, Fig. 4b) from PQD. Such improvement was lost for a longer p-peptide (e.g., FQS(phos)EEQQQTEDELQDK, precursor m/z: 1031.7, Suppl. Fig. 4a and 4b), which is likely attributable to the reduced fragmentation efficiency of PQD for higher m/z ions (Fig. 2). We found that the MS2 ion intensity of FQS(phos)EEQQQTEDELQDK under PQD decreases nearly an order of magnitude from that of CID, while that of VNQIGTLS(phos)ES(phos)IK decreases only 1/3 (Table 1a). The nearly one-order decrease in MS2 ion intensity could adversely affect its Ascore, while a one-third drop in MS2 intensity might have been compensated by the richness of MS2 information needed for the Ascore calculation. Fig. 6 shows that Ascores of p-peptides from the IMAC-enriched p-proteins of S49 cells largely decrease (expressed as AscorePQD/AscoreCID) with increasing m/z.
Figure 6.
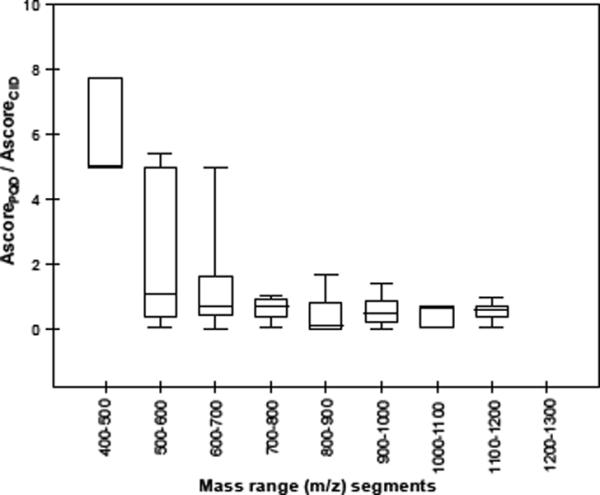
Box and whisker plot of the ratios of Ascores (PQDmodified/CID) of phosphopeptides having increasing m/z. Phosphopeptides were identified from wild-type S49 cell lysate.
For phosphotyrosine containing p-peptides, the loss of phosphoric acid (-98 Da) upon CID is caused by gas-phase phosphate group rearrangement during the relatively long (millisecond) activation time in an ion trap [23, 24]. Such a rearrangement is absent in a QqQ-type MS which operates at microsecond activation time scale [25]. We evaluated the effects of short (0.1 ms) PQD activation on pY-containing peptides. Suppl. Fig. 5a and 5b show the loss of H3PO4 and HPO3 upon CID (default 30 ms activation time) or PQD (0.1 ms) on TRDIY(phos)ETDYYRK. The patterns are similar, except that PQD yielded relatively lower intensities of the “neutral loss” peaks. By contrast, only a trace amount of “neutral loss” ions was observed on a QqQ MS instrument (Suppl. Fig. 5c). These results suggest that rearrangement of the phosphate group could be inherent to the resonance activation process in an ion trap, regardless of the activation time scale. Such notion, however, requires further validation with more pY-containing peptides.
Supplementary Material
ACKNOWLEDGEMENT
This research was supported by the Intramural Research Programs of National Institute on Aging and National Heart, Lung, and Blood Institute, National Institutes of Health (NIH). The authors would like to acknowledge the following for technical advice: Dr. Howard Jaffe, NINDS, NIH; Drs. Jae C. Schwartz, Mike W. Senko, and John E.P. Syka of ThermoFisher Scientific Inc.
References
- 1.Louris JN, Cooks RG, Syka JEP, Kelley PE, Stafford GC, Todd JFJ. Instrumentation, Applications, and Energy Deposition in Quadrupole Ion-Trap Tandem Mass-Spectrometry. Anal. Chem. 1987;59:1677–1685. [Google Scholar]
- 2.Schwartz JC, Syka JEP, Quarmby ST. Improving the fundamentals of MSn on 2D linear ion traps: new ion activation and isolation techniques. The 53rd ASMS Conference on Mass Spectrometry and Allied Topic; San Antonio, TX. June 5–9. (2005). [Google Scholar]
- 3.McLuckey SA. Principles of Collisional Activation in Analytical Mass-Spectrometry. J. Am. Soc. Mass Spectrom. 1992;3:599–614. doi: 10.1016/1044-0305(92)85001-Z. [DOI] [PubMed] [Google Scholar]
- 4.Guo T, Gan CS, Zhang H, Zhu Y, Kon OL, Sze SK. Hybridization of Pulsed-Q Dissociation and Collision-Activated Dissociation in Linear Ion Trap Mass Spectrometer for iTRAQ Quantitation. J. Proteome Res. 2008;7:4831–4840. doi: 10.1021/pr800403z. [DOI] [PubMed] [Google Scholar]
- 5.Bantscheff M, Boesche M, Eberhard D, Matthieson T, Sweetman G, Kuster B. Robust and Sensitive iTRAQ Quantification on an LTQ Orbitrap Mass Spectrometer. Mol. Cell Proteomics. 2008;7:1702–1713. doi: 10.1074/mcp.M800029-MCP200. [DOI] [PMC free article] [PubMed] [Google Scholar]
- 6.Griffin TJ, Xie H, Bandhakavi S, Popko J, Mohan A, Carlis JV, Higgins L. iTRAQ reagent-based quantitative proteomic analysis on a linear ion trap mass spectrometer. J. Proteome Res. 2007;6:4200–4209. doi: 10.1021/pr070291b. [DOI] [PMC free article] [PubMed] [Google Scholar]
- 7.Armenta JM, Hoeschele I, Lazar IM. Differential Protein Expression Analysis Using Stable Isotope Labeling and PQD Linear Ion Trap MS Technology. J. Am. Soc. Mass Spectrom. 2009;20:1287–1302. doi: 10.1016/j.jasms.2009.02.029. [DOI] [PubMed] [Google Scholar]
- 8.Yang F, Wu S, Stenoien DL, Zhao R, Monroe ME, Gritsenko MA, Purvine SO, Polpitiya AD, Tolic N, Zhang Q, Norbeck AD, Orton DJ, Moore RJ, Tang K, Anderson GA, Pasa-Tolic L, Camp DG, Smith RD. Combined Pulsed-Q Dissociation and Electron Transfer Dissociation for Identification and Quantification of iTRAQ-Labeled Phosphopeptides. Anal. Chem. 2009;81:4137–4143. doi: 10.1021/ac802605m. [DOI] [PMC free article] [PubMed] [Google Scholar]
- 9.Kocher T, Pichler P, Schutzbier M, Stingl C, Kaul A, Teucher N, Hasenfuss G, Penninger JM, Mechtler K. High precision quantitative proteomics using iTRAQ on an LTQ Orbitrap: a new mass spectrometric method combining the benefits of all. J. Proteome. Res. 2009;8:4743–4752. doi: 10.1021/pr900451u. [DOI] [PubMed] [Google Scholar]
- 10.Savitski MM, Fischer F, Mathieson T, Sweetman G, Lang M, Bantscheff M. Targeted Data Acquisition for Improved Reproducibility and Robustness of Proteomic Mass Spectrometry Assays. J. Am. Soc. Mass Spectrom. 2010;21:1668–1679. doi: 10.1016/j.jasms.2010.01.012. [DOI] [PubMed] [Google Scholar]
- 11.Wu WW, Wang G, Yu MJ, Knepper MA, Shen RF. Identification and quantification of basic and acidic proteins using solution-based two-dimensional protein fractionation and label-free or 18O-labeling mass spectrometry. J. Proteome. Res. 2007;6:2447–2459. doi: 10.1021/pr060621c. [DOI] [PubMed] [Google Scholar]
- 12.Charles MJ, McLuckey SA, Glish GL. Competition Between Resonance Ejection and Ion Dissociation During Resonant Excitation in A Quadrupole Ion-Trap. J. Am. Soc. Mass Spectrom. 1994;5:1031–1041. doi: 10.1016/1044-0305(94)85065-8. [DOI] [PubMed] [Google Scholar]
- 13.Cunningham C, Jr., Glish GL, Burinsky DJ. High amplitude short time excitation: a method to form and detect low mass product ions in a quadrupole ion trap mass spectrometer. J. Am. Soc. Mass Spectrom. 2006;17:81–84. doi: 10.1016/j.jasms.2005.09.007. [DOI] [PubMed] [Google Scholar]
- 14.Lopez LL, Tiller PR, Senko MW, Schwartz JC. Automated strategies for obtaining standardized collisionally induced dissociation spectra on a benchtop ion trap mass spectrometer. Rapid Commun. Mass Spectrom. 1999;13:663–668. [Google Scholar]
- 15.Breci LA, Tabb DL, Yates JR, III, Wysocki VH. Cleavage N-terminal to proline: analysis of a database of peptide tandem mass spectra. Anal. Chem. 2003;75:1963–1971. doi: 10.1021/ac026359i. [DOI] [PubMed] [Google Scholar]
- 16.Kjeldsen F, Giessing AM, Ingrell CR, Jensen ON. Peptide sequencing and characterization of post-translational modifications by enhanced ion-charging and liquid chromatography electron-transfer dissociation tandem mass spectrometry. Anal. Chem. 2007;79:9243–9252. doi: 10.1021/ac701700g. [DOI] [PubMed] [Google Scholar]
- 17.Hohmann LJ, Eng JK, Gemmill A, Klimek J, Vitek O, Reid GE, Martin DB. Quantification of the compositional information provided by immonium ions on a quadrupole-time-of-flight mass spectrometer. Anal. Chem. 2008;80:5596–5606. doi: 10.1021/ac8006076. [DOI] [PMC free article] [PubMed] [Google Scholar]
- 18.Summerfield SG, Bolgar MS, Gaskell SJ. Promotion and stabilization of b(1) ions in peptide phenylthiocarbamoyl derivatives: Analogies with condensed-phase chemistry. J. Mass Spectrom. 1997;32:225–231. [Google Scholar]
- 19.Wiese S, Reidegeld KA, Meyer HE, Warscheid B. Protein labeling by iTRAQ: a new tool for quantitative mass spectrometry in proteome research. Proteomics. 2007;7:340–350. doi: 10.1002/pmic.200600422. [DOI] [PubMed] [Google Scholar]
- 20.Wysocki VH, Tsaprailis G, Smith LL, Breci LA. Mobile and localized protons: a framework for understanding peptide dissociation. J. Mass Spectrom. 2000;35:1399–1406. doi: 10.1002/1096-9888(200012)35:12<1399::AID-JMS86>3.0.CO;2-R. [DOI] [PubMed] [Google Scholar]
- 21.Xia Y, Liang X, McLuckey SA. Ion trap versus low-energy beam-type collision-induced dissociation of protonated ubiquitin ions. Anal. Chem. 2006;78:1218–1227. doi: 10.1021/ac051622b. [DOI] [PubMed] [Google Scholar]
- 22.Beausoleil SA, Villen J, Gerber SA, Rush J, Gygi SP. A probability-based approach for high-throughput protein phosphorylation analysis and site localization. Nat. Biotechnol. 2006;24:1285–1292. doi: 10.1038/nbt1240. [DOI] [PubMed] [Google Scholar]
- 23.DeGnore JP, Qin J. Fragmentation of phosphopeptides in an ion trap mass spectrometer. J. Am. Soc. Mass Spectrom. 1998;9:1175–1188. doi: 10.1016/S1044-0305(98)00088-9. [DOI] [PubMed] [Google Scholar]
- 24.Moyer SC, Cotter RJ, Woods AS. Fragmentation of phosphopeptides by atmospheric pressure MALDI and ESI/Ion trap mass spectrometry. J. Am. Soc. Mass Spectrom. 2002;13:274–283. doi: 10.1016/S1044-0305(01)00361-0. [DOI] [PubMed] [Google Scholar]
- 25.Palumbo AM, Reid GE. Evaluation of Gas-Phase Rearrangement and Competing Fragmentation Reactions on Protein Phosphorylation Site Assignment Using Collision Induced Dissociation-MS/MS and MS(3) Anal. Chem. 2008;80:9735–9747. doi: 10.1021/ac801768s. [DOI] [PubMed] [Google Scholar]
Associated Data
This section collects any data citations, data availability statements, or supplementary materials included in this article.


