During the 1st week after reperfusion for acute myocardial infarction, extent of myocardial edema and of late gadolinium enhancement decrease significantly, with significant improvement in left ventricular ejection fraction over the same interval.
Abstract
Purpose:
To define the evolution of infarct characteristics with cardiovascular magnetic resonance (MR) imaging and to assess which of the cardiovascular MR data acquired at day 2 or at 1 week after acute myocardial infarction (AMI), is the stronger predictor of infarct size and left ventricular (LV) function measured at 3 months.
Materials and Methods:
The study protocol was reviewed and approved by the local research ethics committee, and written informed consent was obtained. Forty-eight patients with reperfused AMI underwent cine, T2-weighted, and late gadolinium enhancement cardiovascular MR imaging at days 2, 7, 30, and 90 after index presentation. Continuous data between times were compared by using paired t tests or one-way analysis of variance. Multiple linear regression analyses were used to predict linear end points.
Results:
Infarct size and extent of myocardial edema decreased significantly between day 2 and 1 week: Mean scar as a percentage of LV mass and standard deviation (SD), respectively, were 27.2 and 13.9 versus 21.6 and 14.1 (P < .001), and myocardial edema as a percentage of LV mass and SD, respectively, were 37.9 and 15.2 versus 32.3 and 14.3 (P = .003). These changes were accompanied by a significant improvement in LV ejection fraction (LVEF): Mean percentage of LVEF and SD, respectively, were 41.7 and 9.6 versus 44.6 and 10.1 (P < .001). When comparing data acquired at day 2 and 1 week, only cardiovascular MR data acquired at 1 week were independent predictors of LVEF and infarct size at 3 months.
Conclusion:
LVEF, infarct size, and extent of myocardial edema changed significantly during the 1st week after AMI. Overall, cardiovascular MR measurements acquired after 1 week have greater predictive value for infarct size and LV function at 3 months than data acquired at day 2.
© RSNA, 2011
Introduction
Primary percutaneous coronary intervention is the optimal reperfusion strategy to treat patients with acute ST-segment elevation myocardial infarction (1). However, despite reestablishing normal blood flow in the culprit epicardial coronary artery, ST-segment elevation myocardial infarction usually results in a degree of reversible, as well as permanent, myocardial damage. Cardiovascular magnetic resonance (MR) imaging has emerged as a useful technique to comprehensively evaluate the pathophysiologic changes that occur following acute myocardial infarction (AMI).
With contrast material–enhanced cardiovascular MR studies, researchers have demonstrated that infarct size is an important predictor of adverse left ventricular (LV) remodeling (2) and clinical outcome following ST-segment elevation myocardial infarction (3). Similarly, the presence of microvascular obstruction (MVO), as determined with cardiovascular MR, has been associated with poor functional recovery and worse clinical outcome (4,5). The use of T2-weighted cardiovascular MR imaging has enabled the assessment of infarct-related myocardial edema (6). This method has been validated against single photon emission computed tomography (SPECT) to accurately depict the myocardial area at risk (AAR), which defines the hypoperfused myocardium threatened by coronary artery occlusion (7). Carlsson et al (7) demonstrated that T2-weighted cardiovascular MR performed at day 1 or at 1 week after reperfusion can accurately help to determine myocardium at risk. By accurately evaluating the AAR with T2-weighted imaging and infarct size with late gadolinium enhancement (LGE), cardiovascular MR can help to quantify the amount of salvaged myocardium (subtracting infarct size from AAR), which is a useful measure of the effectiveness of reperfusion therapy and may carry prognostic significance (8). The paramagnetic effects of the breakdown products of hemoglobin also can be detected with T2-weighted cardiovascular MR, and, therefore, this technique can be used to identify hemorrhagic infarction, which has been shown to help predict adverse LV remodeling (9).
Cardiovascular MR is the most accurate and reproducible noninvasive method to assess ventricular function (10), and it is also capable of depicting subendocardial infarction more accurately than SPECT (11) and positron emission tomography (12). In addition, cardiovascular MR does not use ionizing radiation and is therefore ideally suited to serial monitoring of patients. Researchers in most cardiovascular MR studies who have investigated patients following AMI have chosen to image patients early any time between day 1 and day 7 after first presentation (3,8,13–15). However, clinical studies with serial cardiovascular MR imaging have shown that infarct size and LV function and volumes change significantly during the 1st week after AMI (16,17). Also, in the canine model, it has been shown that the extent of MVO and infarct size increase significantly over the first 48 hours after AMI (18) but that the extent of MVO is unchanged between 2 and 9 days after reperfusion (19). There is, however, a paucity of clinical data in regard to the natural time course of myocardial edema and MVO in the early acute stages after reperfused myocardial infarction. Given the increasing use of cardiovascular MR–derived surrogate outcome measures in clinical trials of AMI, it is important to determine the optimal time for imaging after myocardial infarction.
Therefore, the purpose of this study was to define the evolution of infarct characteristics with cardiovascular MR and to assess which of the cardiovascular MR data acquired at day 2 or at 1 week after AMI, is the stronger predictor of infarct size and LV function measured at 3 months.
Materials and Methods
Patient Population
The study was approved by the local research ethics committee and complied with the Declaration of Helsinki; written informed consent was obtained from all patients. We prospectively enrolled 57 patients hospitalized in our institution between August 2008 and October 2009. Inclusion criteria were first-presentation acute ST-segment elevation myocardial infarction and successful treatment with primary percutaneous coronary intervention within 12 hours of symptom onset. Successful treatment was defined as restoration of at least Thrombolysis In Myocardial Infarction flow grade 2 in the infarct-related artery. Exclusion criteria included a history of previous coronary revascularization (ie, percutaneous coronary intervention or coronary artery bypass surgery), previous myocardial infarction, renal failure (defined as estimated glomerular filtration rate of <30 mL/min/1.73 m2), age younger than 18 years or older than 79 years, pregnancy, or any contraindication to cardiovascular MR examination (eg, presence of a permanent pacemaker). Clinical data in regard to patient characteristics and procedural details were gathered from the medical notes by a clinician with more than 10 years of experience (A.N.M.).
Cardiovascular MR Protocol
All patients underwent cardiovascular MR imaging within 72 hours of presentation. Follow-up cardiovascular MR studies, with use of the identical imaging protocol, were performed at 1 week, 1 month, and 3 months. Patients were examined supine in a 1.5-T imaging unit (Philips Medical Systems, Best, the Netherlands) equipped with master gradients (30 mT/m peak gradients; 150 mT/m/msec slew rate) and a five-element cardiac phased-array receiver coil. Images were acquired with the use of electrocardiographic gating and expiratory breath holds. All data were acquired in the true LV short axis, with 10–12 contiguous sections as required to cover the entire LV.
Cine imaging was performed by using a steady-state free precession pulse sequence (repetition time msec/echo time msec, 2.8/1.4; flip angle, 55°; spatial resolution, 2 × 2 × 10 mm; 18 phases per cardiac cycle). Immediately after cine acquisition, T2-weighted cardiovascular MR was performed in the short-axis orientation by using a dark-blood T2-weighted short tau inversion-recovery fast spin-echo sequence (2 heartbeats/100; flip angle 90°; spatial resolution, 1.4 × 1.4 × 10 mm).
Immediately following T2-weighted image acquisition, a dose of 0.2 mmol per kilogram of body weight of gadopentetate dimeglumine (Magnevist; Bayer Schering Health Care, United Kingdom) was administered intravenously at a rate of 5 mL/sec with a power injector (Spectris Solaris; Medrad, Warrendale, Pa). Ten minutes after contrast agent injection, a Look-Locker sequence was performed to obtain the most appropriate inversion time to null the signal intensity of normal myocardium. This was immediately followed by acquisition of LGE images, with an inversion-recovery prepared T1-weighted gradient-echo sequence (4.9/1.9; flip angle, 15°; turbo field-echo factor, 30; spatial resolution, 1.35 × 1.35 × 10 mm).
Cardiovascular MR Analysis
The cardiovascular MR images were analyzed off-line by using commercial software (MASS 6.0; Medis, Leiden, the Netherlands) with consensus between two experienced observers who were blinded to all clinical details (A.N.M. and T.A.F., with each having more than 3 years of experience in clinical cardiovascular MR and having completed advanced training in cardiovascular MR). The images were analyzed at the end of the study to avoid issues such as learning bias.
For assessment of LV volumes and mass, the end-diastolic and end-systolic cine frames were identified, and the endocardial and epicardial borders were manually traced. End diastole and end systole were defined as the largest and smallest LV cavity, respectively, determined at the midventricular short-axis level. The end-diastolic and end-systolic volumes were then calculated by using the summation of discs method. LV mass (in grams) was calculated from the total volume of myocardium at end diastole multiplied by the myocardial density of 1.05 g/mL. LV volumes and mass were indexed to body surface area, as calculated with the method of Mosteller (20). Infarcted tissue was identified by using LGE images. The LV endocardial and epicardial borders on each section were traced manually. Infarcted tissue was defined as an area of gadolinium hyperenhancement in a subendocardial or transmural pattern and in the territory of a coronary artery. These regions were identified and then quantified by using a semiautomated algorithm. Areas of hyperenhancement were defined as myocardium with a signal intensity greater than 2 standard deviations (SDs) above the mean signal intensity of remote normal myocardium (21). The mass of infarcted myocardium was then automatically calculated (scar) and expressed as scar as a percentage of LV mass (%LV-scar). In cases where there was MVO in the infarcted area, manual contours were drawn around the highlighted myocardium (ie, myocardium with signal intensity >2 SDs above the signal intensity of remote normal myocardium), thereby including MVO in the total area of infarction (Fig 1).
Figure 1a:
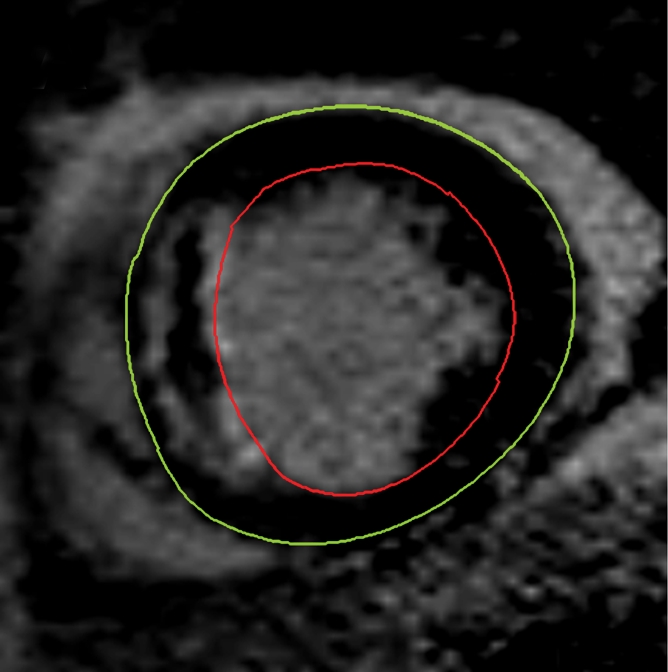
Cardiovascular MR images demonstrate identification and quantification of infarcted tissue and MVO with LGE. Green contours = LV epicardial border, red contours = LV endocardial border, orange contours = region of interest in the remote normal myocardium. (a) High signal intensity is seen in the interventricular septum, demonstrating infarcted myocardium. Area of hypointense signal in the infarct zone indicates MVO. (b) Highlighted tissue is defined as myocardium with a signal intensity greater than 2 SDs of remote normal myocardium (ie, infarcted myocardium). (c) Yellow contour defines the infarct zone and includes the area of MVO. (d) Yellow contour delineates the area of MVO.
Figure 1b:
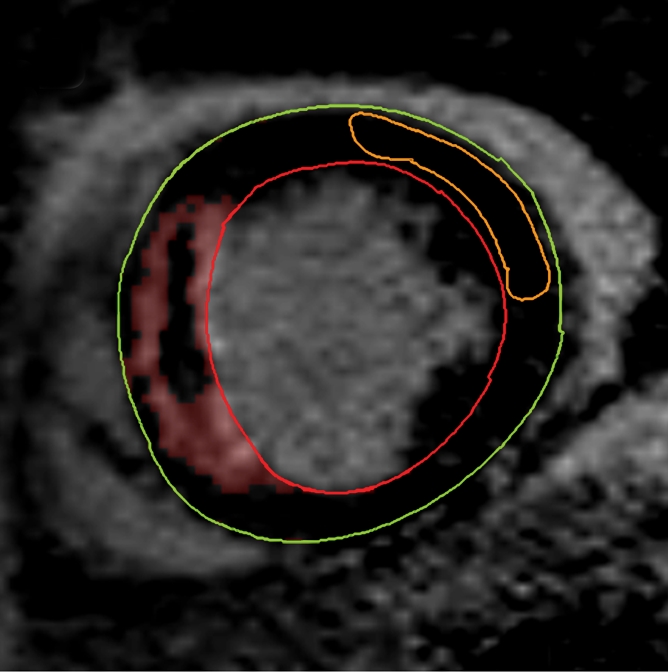
Cardiovascular MR images demonstrate identification and quantification of infarcted tissue and MVO with LGE. Green contours = LV epicardial border, red contours = LV endocardial border, orange contours = region of interest in the remote normal myocardium. (a) High signal intensity is seen in the interventricular septum, demonstrating infarcted myocardium. Area of hypointense signal in the infarct zone indicates MVO. (b) Highlighted tissue is defined as myocardium with a signal intensity greater than 2 SDs of remote normal myocardium (ie, infarcted myocardium). (c) Yellow contour defines the infarct zone and includes the area of MVO. (d) Yellow contour delineates the area of MVO.
Figure 1c:
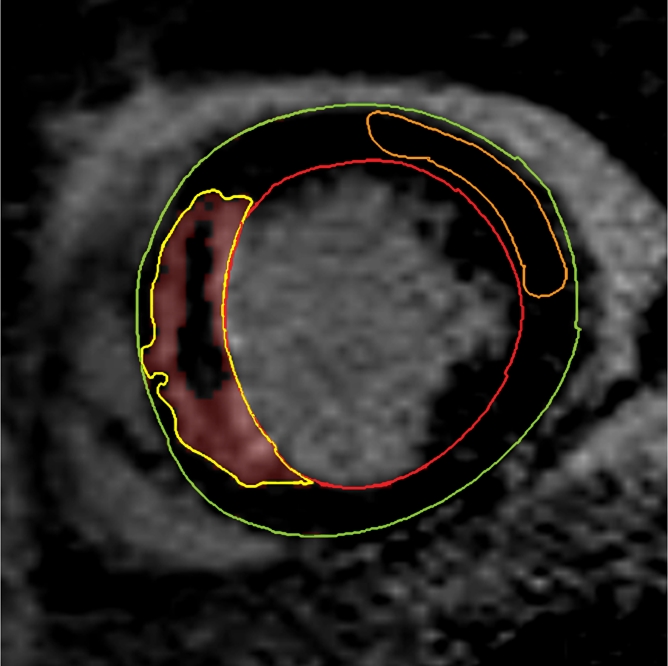
Cardiovascular MR images demonstrate identification and quantification of infarcted tissue and MVO with LGE. Green contours = LV epicardial border, red contours = LV endocardial border, orange contours = region of interest in the remote normal myocardium. (a) High signal intensity is seen in the interventricular septum, demonstrating infarcted myocardium. Area of hypointense signal in the infarct zone indicates MVO. (b) Highlighted tissue is defined as myocardium with a signal intensity greater than 2 SDs of remote normal myocardium (ie, infarcted myocardium). (c) Yellow contour defines the infarct zone and includes the area of MVO. (d) Yellow contour delineates the area of MVO.
Figure 1d:
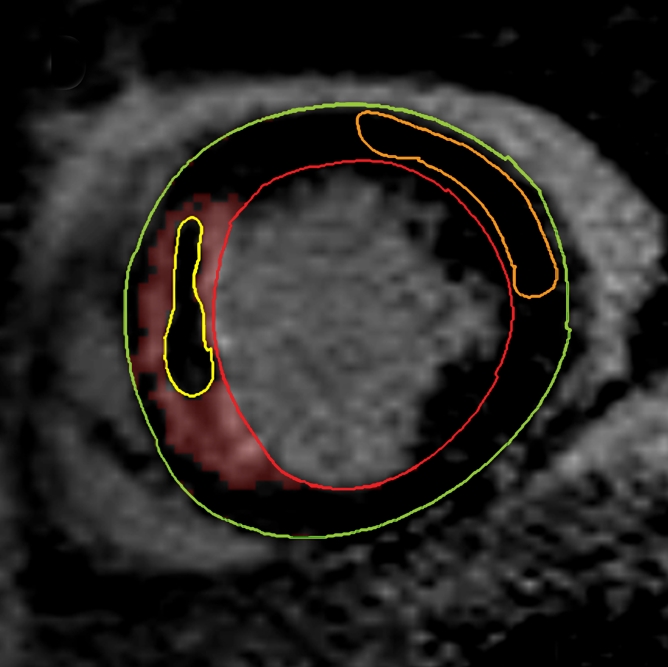
Cardiovascular MR images demonstrate identification and quantification of infarcted tissue and MVO with LGE. Green contours = LV epicardial border, red contours = LV endocardial border, orange contours = region of interest in the remote normal myocardium. (a) High signal intensity is seen in the interventricular septum, demonstrating infarcted myocardium. Area of hypointense signal in the infarct zone indicates MVO. (b) Highlighted tissue is defined as myocardium with a signal intensity greater than 2 SDs of remote normal myocardium (ie, infarcted myocardium). (c) Yellow contour defines the infarct zone and includes the area of MVO. (d) Yellow contour delineates the area of MVO.
MVO was also measured by using LGE images. For each section, the region of hypoenhancement within the infarct zone was defined visually and then planimetered manually (22). The volume of MVO was converted to a mass and then represented as MVO as a percentage of LV mass (%LV-MVO).
The AAR was quantified on T2-weighted images by using a similar semiautomated algorithm, as above. Myocardium with a signal intensity greater than 2 SDs above the mean signal intensity of remote normal myocardium was considered to be edematous (23). We avoided drawing regions of interest in remote myocardium in the posterolateral LV wall, given the recognized signal intensity loss in that territory with T2-weighted imaging. Increased signal intensity caused by slow flow from the blood pool adjacent to the endocardium was excluded. The mass of edematous myocardium was then automatically calculated (AAR) and expressed as AAR as a percentage of LV mass (%LV-AAR). In cases where there was hemorrhage in the edematous area, manual contours were drawn around the highlighted myocardium (ie, myocardium with signal intensity >2 SDs above the signal intensity of remote normal myocardium), thereby including hemorrhage in the total area of edema (Fig 2). All T2-weighted images were assessed by two experienced observers, and areas of myocardium with increased T2 signal intensity were agreed in consensus. The image quality for all cases was acceptable. The mass of salvaged myocardium was derived by subtracting the mass of infarcted tissue from the mass of AAR. This was then represented as myocardial salvage index (MSI) (ie, the volume of the salvaged myocardium as a percentage of the volume of AAR).
Figure 2a:
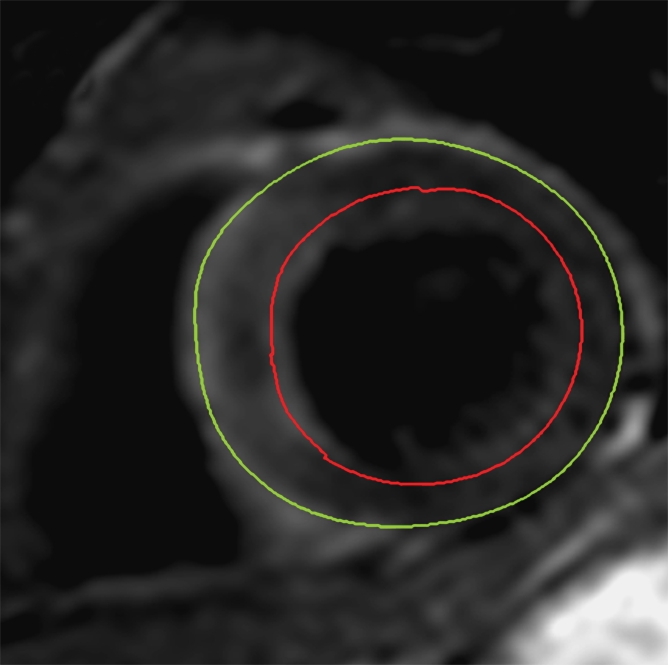
Cardiovascular MR images demonstrate identification and quantification of myocardial edema and hemorrhage with T2-weighted imaging. Green contours = LV epicardial border, red contours = LV endocardial border, orange contours = region of interest in the remote normal myocardium. (a) High signal intensity in the interventricular septum indicates myocardial edema. Area of hypointense signal in the edematous zone indicates hemorrhage. (b) Highlighted tissue is defined as myocardium with a signal intensity greater than 2 SDs of remote normal myocardium (ie, myocardial edema). (c) Yellow contour defines the edematous zone and includes the area of hemorrhage. (d) Yellow contour delineates the area of hemorrhage.
Figure 2b:
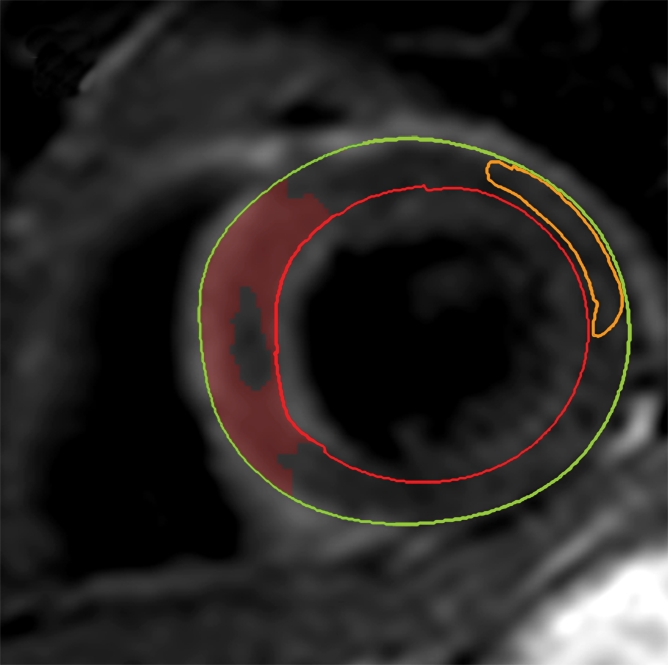
Cardiovascular MR images demonstrate identification and quantification of myocardial edema and hemorrhage with T2-weighted imaging. Green contours = LV epicardial border, red contours = LV endocardial border, orange contours = region of interest in the remote normal myocardium. (a) High signal intensity in the interventricular septum indicates myocardial edema. Area of hypointense signal in the edematous zone indicates hemorrhage. (b) Highlighted tissue is defined as myocardium with a signal intensity greater than 2 SDs of remote normal myocardium (ie, myocardial edema). (c) Yellow contour defines the edematous zone and includes the area of hemorrhage. (d) Yellow contour delineates the area of hemorrhage.
Figure 2c:
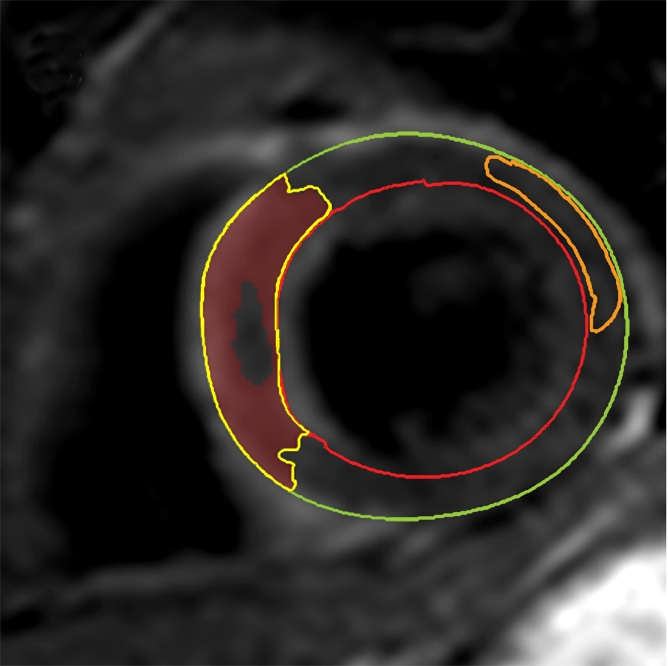
Cardiovascular MR images demonstrate identification and quantification of myocardial edema and hemorrhage with T2-weighted imaging. Green contours = LV epicardial border, red contours = LV endocardial border, orange contours = region of interest in the remote normal myocardium. (a) High signal intensity in the interventricular septum indicates myocardial edema. Area of hypointense signal in the edematous zone indicates hemorrhage. (b) Highlighted tissue is defined as myocardium with a signal intensity greater than 2 SDs of remote normal myocardium (ie, myocardial edema). (c) Yellow contour defines the edematous zone and includes the area of hemorrhage. (d) Yellow contour delineates the area of hemorrhage.
Figure 2d:
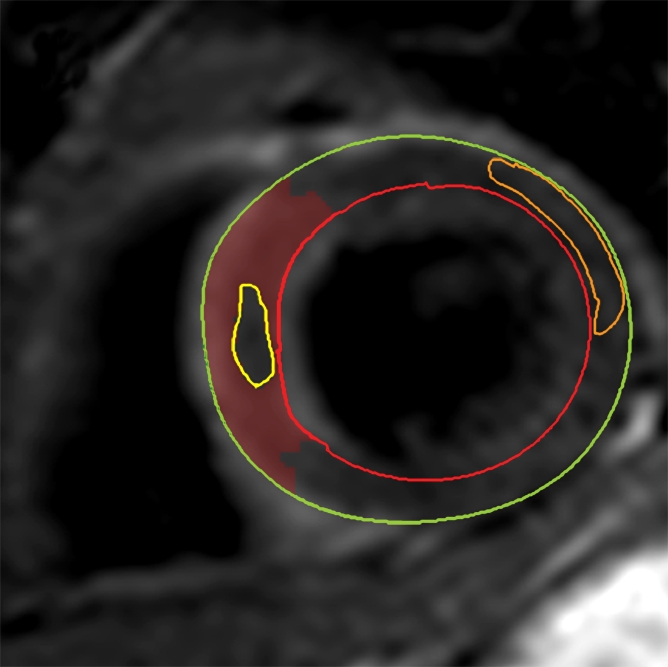
Cardiovascular MR images demonstrate identification and quantification of myocardial edema and hemorrhage with T2-weighted imaging. Green contours = LV epicardial border, red contours = LV endocardial border, orange contours = region of interest in the remote normal myocardium. (a) High signal intensity in the interventricular septum indicates myocardial edema. Area of hypointense signal in the edematous zone indicates hemorrhage. (b) Highlighted tissue is defined as myocardium with a signal intensity greater than 2 SDs of remote normal myocardium (ie, myocardial edema). (c) Yellow contour defines the edematous zone and includes the area of hemorrhage. (d) Yellow contour delineates the area of hemorrhage.
The presence and extent of myocardial hemorrhage was also assessed by using T2-weighted cardiovascular MR. Areas of hypointense signal within the AAR (myocardium with mean signal intensity <2 SDs below that of the periphery of the AAR), were considered to be hemorrhage (9). These areas were planimetered manually on each section. The volume of hemorrhagic myocardium was converted to a mass and then expressed as hemorrhage as a percentage of LV mass (%LV-hemorrhage).
Statistical Analysis
Statistical analysis was performed by using software (SPSS, version 16.0; SPSS, Chicago, Ill). Two-sided P values ≤ .05 were considered to indicate a significant difference. Continuous cardiovascular MR data are summarized as means and SDs, and categorical data are summarized as numbers and percentages. Continuous data between times were compared by using paired t tests or one-way analysis of variance tests, with Bonferroni correction. Multiple linear regression analyses were used to predict linear end points.
Results
Study Population
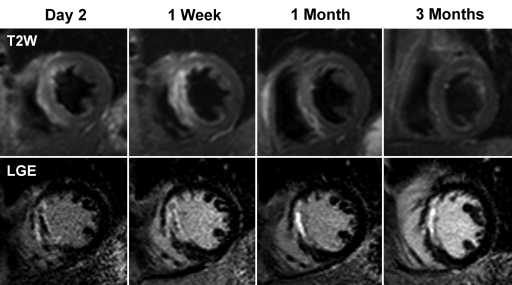
Fifty-seven patients were recruited. Four patients were unable to complete the first cardiovascular MR examination because of claustrophobia, and a further four patients refused to attend follow-up. One patient died of an intracranial hemorrhage before final follow-up. Therefore, 48 patients completed baseline and all follow-up cardiovascular MR examinations. Baseline cardiovascular MR studies were conducted at a median of 2 days (range, 1–5 days) (day 2) from the time of presentation. The second cardiovascular MR examination was performed at a median of 7 days (range, 3–14 days) (1 week), the third examination at a median of 30 days (range, 21–39 days) (1 month), and the final cardiovascular MR examination occurred at a median of 92 days (range, 71–127 days) (3 months). Figure 3 demonstrates typical cardiovascular MR images from the study.
Figure 3:
Short-axis cardiovascular MR images from a 63-year-old man who had anterior ST-segment elevation myocardial infarction at presentation. Early after reperfusion, T2-weighted (T2W) images demonstrated increased signal intensity (myocardial edema) in the interventricular septum. Extent of edema gradually decreased and by 3 months was undetectable. LGE images from the same patient demonstrated almost transmural infarction in the septum. MVO is present at day 2 and 1 week after reperfusion (dark core in the infarct zone) but is undetectable at 1 month. Infarct size decreased during the 1st month after reperfusion.
The baseline characteristics of the study population are summarized in Table 1. The mean age of the population was 57 years (range, 35–73 years). Most of the cohort subjects were male (43 of 48), were current smokers, and had a history of hypercholesterolemia. The mean age of the men was 57 years (range, 35–73 years), and the mean age of the women was 59 years (range, 58–63 years). The independent-samples t test did not demonstrate any difference in age between men and women (P = .51). Only 8% of patients had a diagnosis of diabetes mellitus prior to admission. Successful reperfusion was achieved in all patients, and Thrombolysis In Myocardial Infarction flow grade 3 was restored in 90% of cases. All patients were receiving optimal medical therapy (defined as aspirin, clopidogrel, a beta-blocker, an angiotensin-converting enzyme inhibitor, and a statin) at discharge and at 3 months of follow-up.
Table 1.
Summary of Baseline Characteristics of Study Population (n = 48)
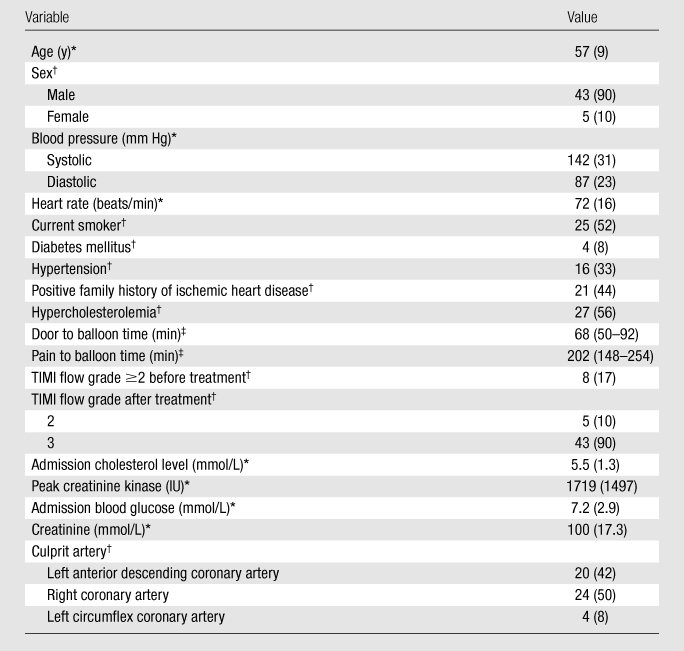
Note.—TIMI = Thrombolysis In Myocardial Infarction.
Data are the means, and numbers in parentheses are SDs.
Data are numbers, and numbers in parentheses are percentages.
Data are medians, and numbers in parentheses are interquartile ranges. Door to balloon time refers to time patient enters hospital to time balloon is inflated in the coronary artery. Pain to balloon time refers to time of onset of pain to time balloon is inflated in the coronary artery.
Infarct Size and MVO
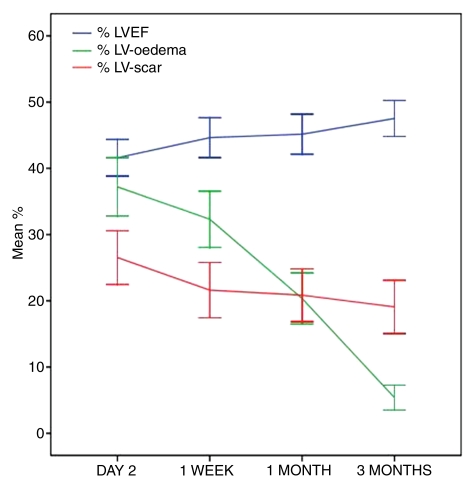
The extent of LGE diminished significantly between day 2 and 1 week (mean %LV-scar and SD were 27.2 and 13.9 vs 21.6 and 14.1 [P < .001], respectively). The %LV-scar decreased in 40 of 48 (83%) patients during the 1st week. The extent of LGE did not change significantly between 1 week and 1 month (mean %LV-scar and SD, 21.6 and 14.1 vs 21.1 and 13.7 [P = .58], respectively) and between 1 month and 3 months (mean %LV-scar and SD, 21.1 and 13.7 vs 19.0 and 13.9 [P = .15], respectively) (Table 2 and Fig 4).
Table 2.
Summary of the Cardiovascular MR Results at Each Time

Note.—Data are means, and numbers in parentheses are SDs, except where otherwise indicated. LVEDVI = LV end-diastolic volume index, LVEF = LV ejection fraction, LVESVI = LV end-systolic volume index.
For comparison of data for day 2 versus data for 1 week.
Figure 4:
Graph demonstrates changes in percentage of LVEF (% LVEF), extent of myocardial edema (myocardial edema as a percentage of LV mass [%LV–myocardial edema]), and infarct size (%LV-scar) over time following reperfused AMI. Lines = mean percentage values at each time, error bars = 95% confidence intervals, %LV-oedema = %LV–myocardial edema.
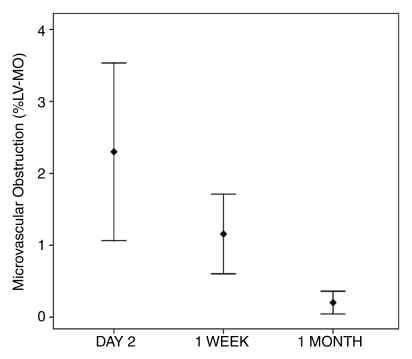
Twenty-nine patients (60%) had evidence of MVO at LGE imaging on day 2. The same patients also had evidence of MVO at 1 week. The extent of MVO, however, diminished significantly between day 2 and 1 week (mean %LV-MVO and SD, 2.3 and 4.1 vs 1.2 and 1.8, respectively, with P = .009 [n = 29]). At 1 month, only 11 patients demonstrated MVO (mean %LV-MVO and SD, 0.17 and 0.4 [n = 11], respectively), and by 3 months, there were no cases identified. The extent of MVO reduced significantly between each time (Fig 5).
Figure 5a:
Error plots show changes in (a) extent of MVO and (b) extent of myocardial hemorrhage after reperfusion therapy. %LV-MO = %LV-MVO. Error bars = 95% confidence intervals around the mean.
Figure 5b:
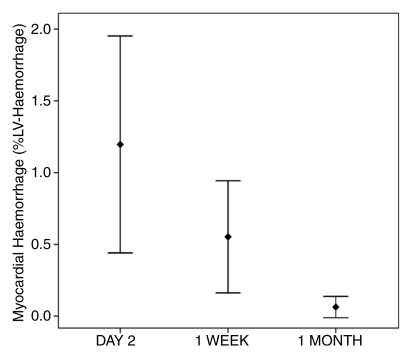
Error plots show changes in (a) extent of MVO and (b) extent of myocardial hemorrhage after reperfusion therapy. %LV-MO = %LV-MVO. Error bars = 95% confidence intervals around the mean.
Myocardial Edema
Myocardial edema was detected in all patients at day 2 and 1 week at T2-weighted cardiovascular MR (mean %LV-AAR and SD, 37.9 and 15.2 vs 32.3 and 14.3 [P = .003], respectively). The %LV–myocardial edema decreased in 40 of 48 (83%) patients during the 1st week. At 1 month (mean %LV–myocardial edema and SD, 20.8 and 13.3, respectively), there was no evidence of edema in two patients, and by 3 months (mean %LV–myocardial edema and SD, 5.3 and 3.5, respectively), 13 of 48 (27%) patients had no evidence of edema. The extent of myocardial edema diminished significantly between each interval, although the percentage reduction was least during the 1st week (15% reduction) and greatest between 1 month and 3 months (75% reduction), when all patients demonstrated a reduction in %LV–myocardial edema (Fig 4).
Myocardial Salvage Index
The MSI, defined as (AAR − Sinf)/AAR, where Sinf is size of the infarct, did not change significantly between day 2 and 1 week (mean MSI and SD, 27.6 and 23 versus 28.9 and 23.8 [P = .85], respectively). This reflects the fact that the extents of both myocardial edema and LGE diminished proportionally during the 1st week after AMI, and, therefore, the ratio remained unchanged.
Myocardial Hemorrhage
Sixteen patients had evidence of myocardial hemorrhage at T2-weighted cardiovascular MR at day 2. By 1 week, only 11 of these patients had evidence of hemorrhage. The extent of hemorrhage diminished during the 1st week, but the differences were not significant (mean %LV-hemorrhage and SD, 1.2 and 2.3 vs 0.6 and 1.3, with P = .07 [n = 16], respectively). Hemorrhage was detected in three patients at 1 month, but there were no cases identified at 3 months (Fig 5).
LV Function and Volumes
There was a significant improvement in LVEF during the 1st week after AMI (mean percentage of LVEF and SD, 41.7 and 9.7 vs 44.6 and 10.1 [P < .001], respectively). Percentage of LVEF increased in 39 of 48 (81%) patients during the 1st week. LVEF did not change between 1 week and 1 month (mean percentage of LVEF and SD, 44.6 and 10.1 vs 45.4 and 10.4 [P = .45], respectively). However, there was another significant increase between 1 month and 3 months (mean percentage of LVEF and SD, 45.4 and 10.4 vs 47.6 and 9.4 [P = .003], respectively) when 40 of 48 patients (83%) demonstrated an improvement in LVEF (Fig 4).
Overall there was no significant change in LV end-diastolic volume index among the four times (mean LV end-diastolic volume index and SD, 91.5 and 17.8 vs 93.4 and 21 vs 95.3 and 22.6 vs 92.8 and 23.2 [P = .66], respectively). LV end-systolic volume index, however, remained stable for the 1st month after AMI (mean LV end-systolic volume index and SD, 54.4 and 17.6 vs 53.2 and 20.4 vs 54.4 and 22.4 [P = .94], respectively) but then reduced significantly between 1 month and 3 months (mean LV end-systolic volume index and SD, 54.4 and 22.4 vs 50.1 and 20.5 [P < .001], respectively). This significant reduction in LV end-systolic volume index corresponded to the largest reduction in myocardial edema and a significant increase in LVEF.
Predictors of Infarct Size and LV Function
The %LV-scar, LVEF, presence of MVO, presence of hemorrhage, %LV-AAR, and MSI at day 2 and 1 week were all univariate predictors of %LV-scar and LVEF at 3 months. However, multivariate linear regression analysis of all these variables revealed that only %LV-scar at 1 week was an independent predictor of infarct size at 3 months (β = .46, standard error = 0.19, P = .017) and that only LVEF at 1 week was an independent predictor of LVEF at 3 months (β = .63, standard error = 0.14, P < .001). These findings suggest that data acquired at 1 week have greater predictive value than information collected 2 days after AMI.
Discussion
In this study, we used a comprehensive cardiovascular MR protocol to serially image patients following successful reperfusion for AMI. The results of this investigation, therefore, describe the evolution of many of the pathophysiologic changes that occur in the acute phase after AMI. The principal findings were that the extents of LGE and myocardial edema, as depicted with T2-weighted cardiovascular MR, diminish significantly during the 1st week after coronary reperfusion. Multivariate linear regression analysis demonstrated that LVEF at 1 week was the only independent predictor of LVEF at 3 months, when adjusted for all univariate cardiovascular MR predictors at day 2 and 1 week.
Evolution of Myocardial Edema
Coronary artery occlusion leads to myocardial ischemia and, if prolonged, myocyte necrosis (infarction). Ischemia triggers an inflammatory cascade, which results in the formation of myocardial edema. Endothelial injury increases the permeability of the myocardial microvasculature, thus allowing the accumulation of osmotically active substances and the influx of water. Consequently, myocardial water content increases, and this increase has been demonstrated in several animal studies of coronary occlusion and reperfusion (24–26). Bragadeesh et al (26) postulated that myofibrillar edema results in reduced contractile function, a condition known as myocardial stunning. They demonstrated in pigs that improvements in postischemic regional myocardial dysfunction were related to the reduction in myofibrillar edema over the 1st 5 days after reperfusion. Our clinical data support this theory. We showed a significant decrease in myocardial edema in the 1st week after reperfusion, which was associated with a significant reduction in infarct size and a significant increase in LVEF. Similarly, the largest reduction in the extent of edema occurred between 1 month and 3 months, which was also associated with a further significant improvement in LVEF.
We cannot define the ultimate duration of postinfarction myocardial edema from the results of this study, as most of our patients still had evidence of edema at 3 months. Nilsson et al (27) performed serial cardiovascular MR imaging in 10 patients treated with thrombolysis for AMI. They reported the presence of edema in three patients at 12 months after infarction, although the median duration was 6 months. More recently, Ripa et al (28) examined 55 patients treated with primary percutaneous coronary intervention for AMI. All patients underwent serial cardiovascular MR imaging at 1 week, 1 month, and 6 months after reperfusion. They reported that the amount of edema decreased significantly over time but that 94% of patients still had evidence of edema at 6 months. Future studies with longer term follow-up will be needed to investigate the duration of postinfarct edema and its effects on ventricular remodeling and clinical outcomes.
Evolution of Infarct Size and Microvascular Damage
LGE cardiovascular MR is a well-validated method for the detection of infarcted myocardium. The technique relies on the principle that the volume of distribution of gadolinium-based contrast agents increases in AMI because of an increase in interstitial space caused by cell membrane rupture in necrotic tissue and by the development of myocardial edema. Delayed contrast agent washout from areas of necrosis also leads to hyperenhancement. In canine studies (19), researchers have demonstrated that the extent of infarcted tissue and MVO increase in the first 48 hours after reperfusion (18) and that the extent of MVO then remains stable between 2 and 9 days. Ibrahim et al (17) investigated 17 patients with reperfused AMI and found that infarct size determined with LGE cardiovascular MR diminished during the 1st week after infarction. Our findings are consistent with the findings in the clinical study by Ibrahim et al and suggest that the most significant reduction in the extent of LGE occurs in the 1st week after reperfusion. However, we also performed T2-weighted cardiovascular MR and therefore provide data that suggest that this reduction may be related to a significant decrease in myocardial edema during the same period, although not tested against untreated patients with infarcts. Therefore, the results of the present study suggest that LGE imaging in the very early days after infarction overestimates the true extent of irreversibly injured myocardium, possibly because of myocardial edema. The decrease in the extent of LGE between 1 week and 3 months was less marked in the current study, and these findings are consistent with findings in other published reports (17).
Our findings also indicate that the extent of MVO actually decreases between 2 and 7 days after reperfusion, in contrast to data in animals from Wu et al (19). The present results are confirmed by other clinical data, which demonstrated that the extent of MVO decreased between 2 and 7 days after infarction and was absent at 2 months (16).
There are no clinical reports in the literature documenting the time course of myocardial hemorrhage following reperfusion for AMI. The current results suggest that the extent of hemorrhagic infarction decreases significantly over the 1st week and month following reperfusion. Hemorrhage was not detectable in any patients at 3 months after infarction. This trend is very similar to that of MVO and adds further evidence that these two features of reperfusion injury are closely related.
Optimal Timing of Acute Imaging after Myocardial Infarction
The aim of reperfusion therapy is to maximize the amount of salvaged myocardium and minimize infarct size. Salvaged myocardium is calculated as the difference between the amount of myocardium at risk and the final infarct size. However, the extent of these parameters changes over time and therefore, the optimal imaging interval after reperfusion has yet to be established. The use of T2-weighted cardiovascular MR to retrospectively determine the AAR has recently been validated against SPECT in a clinical study of 16 patients (7). Carlsson et al (7) found that the AAR (ie, extent of myocardial edema) did not change significantly between day 1 and 1 week but was reduced significantly by 6 weeks. They, therefore, concluded that T2-weighted cardiovascular MR performed up to 1 week after reperfusion can accurately help determine AAR. This finding differs from experimental data and data from the current study, which suggest a significant reduction in myocardial edema in the 1st week. However, Carlsson et al did not perform LGE at baseline, and therefore, we cannot compare the evolution of infarct size over this time. Our results demonstrate that infarct size and myocardial edema regress significantly between 2 and 7 days after infarction but that the rates of decline are proportional so that the percentage MSI was not significantly different between day 2 and 1 week. Our data would thus support the notion that T2-weighted and LGE cardiovascular MR performed up to 1 week after reperfusion can accurately help determine the extent of myocardial salvage. Delaying imaging until 1 week after AMI also has predictive benefit, as infarct size at 1 week and LVEF at 1 week were the only independent predictors of infarct size and LVEF at 3 months, respectively.
The present findings suggest that infarct characteristics evolve over the 1st week after reperfusion. It is therefore important to be aware of these changes when comparing data acquired at different times, particularly in the context of clinical trials in which cardiovascular MR surrogate end points are used. From the current findings, we would advise that cardiovascular MR studies should be performed within a narrow window during the 1st week after reperfusion, as otherwise the baseline data will not necessarily be comparable.
In the clinical setting, performing cardiovascular MR imaging within the first couple of days after an AMI has significant resource implications and presents logistic challenges. It may be that imaging patients early as outpatients may be more practical, but this factor would depend on the work flows in individual institutions.
Limitations
Although the study sample size was small, we were able to demonstrate significant differences between interval scans that are consistent with previous experimental and clinical trials. In addition, the sample size was similar to that in previous studies in which researchers have investigated AMI with cardiovascular MR.
We examined only patients with first-presentation AMI who were treated successfully with primary percutaneous coronary intervention within 12 hours of symptom onset. All patients had restoration of at least Thrombolysis In Myocardial Infarction flow grade 2 in the culprit coronary artery. Therefore, we cannot extrapolate these results to patients with failed reperfusion, patients treated with thrombolysis, patients with previous myocardial infarction or delayed presentation. Furthermore, 90% of the population was male, and only four patients had diabetes mellitus; therefore, more data in regard to female patients and patients with diabetes mellitus are required.
The four times used for cardiovascularMR imaging were chosen to obtain important information about the changes that occur early after reperfusion, as well as to collect data in regard to LV remodeling. However, the intervals do not allow firm conclusions to be drawn in regard to the precise timing of changes. Also, we cannot comment whether further changes occur after 3 months.
T2-weighted cardiovascular MR has several limitations. The long echo times that are necessary in T2-weighted imaging reduce the signal-to-noise ratio. The properties of the surface coil hardware used in cardiovascular MR imaging also pose potential problems. The signal intensity gradient profile of many surface coils results in a progressive loss of signal moving away from the coil. Therefore, this finding can lead to significant loss of signal in the posterior and lateral myocardial territories. We, therefore, avoided these areas when drawing regions of interest for the analysis of T2-weighted images. The signal from slow-flowing blood close to the subendocardial border is difficult to suppress and can result in areas of high signal intensity, making determination of myocardial edema difficult. In this study, we confirmed the endocardial borders on the cine images. Signal loss and motion artifact can also occur if data are acquired during rapid cardiac motion. Therefore, we acquired data in mid diastole to avoid the rapid cardiac motion of systolic contraction and the early filling phase of diastole (29).
The lack of inter- and intraobserver variability is an issue when considering the effect of these data. However, the trends that we have demonstrated in this study are consistent with published clinical and preclinical data. We highlighted that many of the pathophysiologic manifestations of AMI can be identified and measured with cardiovascular MR and that the extents of these characteristics change significantly during the 1st week after reperfusion. These findings may not have immediate clinical implications but may provide useful data in regard to the optimal timing of cardiovascular MR studies, particularly in clinical trials.
Conclusions
The extent of myocardial edema and LGE decrease significantly during the 1st week after reperfusion for AMI, and these changes are associated with a significant improvement in LVEF over the same interval. Cardiovascular MR data acquired at 1 week were independent predictors of infarct size and LVEF at 3 months. Therefore, overall, it might be that the most appropriate time to image patients after reperfusion therapy for AMI is at 1 week.
Advances in Knowledge.
The volumes of myocardial edema and infarct size, as determined with cardiovascular MR imaging, diminish significantly during the 1st week after acute myocardial infarction (AMI).
The myocardial salvage index, as determined with T2-weighted and late gadolinium enhancement cardiovascular MR, does not change significantly between days 2 and 7 after AMI.
Cardiovascular MR data acquired 1 week after AMI aid prediction of infarct size and ventricular function, as measured with cardiovascular MR at 3 months, better than data acquired 2 days after AMI.
Implications for Patient Care.
Cardiovascular MR in patients with AMI has better predictive value for the estimation of final infarct size and ventricular function when performed at 1 week rather than at day 2.
Cardiovascular MR performed up to 1 week after AMI can accurately help assess the effectiveness of reperfusion therapy.
The timing of imaging is important in the interpretation of results from trials of reperfusion therapies in which cardiovascular MR parameters are used as surrogate end points.
Disclosures of Potential Conflicts of Interest: A.N.M. Financial activities related to the present article: institution received grant from Heart Research UK. Financial activities not related to the present article: none to disclose. Other relationships: none to disclose. T.A.F. No potential conflicts of interest to disclose. N.J.A. No potential conflicts of interest to disclose. J.P.G. Financial activities related to the present article: institution received grant from Heart Research UK. Financial activities not related to the present article: received payment for lectures including service on speakers bureaus from Abbott Vascular, received payment for travel expenses to AHA 2010 from Astra Zenica and for travel to EuroPCR 2011 from Abbott Vascular. Other relationships: none to disclose. S.P. Financial activities related to the present article: institution received grant from Heart Research UK. Financial activities not related to the present article: institution received several research grants and royalties for books. Other relationships: none to disclose.
Received February 1, 2011; revision requested March 31; final revision received May 30; accepted June 9; final version accepted June 10.
Funding: This research was supported by a Wellcome Trust Fellowship (WT078288).
Supported by a project grant from Heart Research UK.
Abbreviations:
- AAR
- area at risk
- AMI
- acute myocardial infarction
- LGE
- late gadolinium enhancement
- LV
- left ventricle
- LVEF
- LV ejection fraction
- MSI
- myocardial salvage index
- MVO
- microvascular obstruction
- %LV-AAR
- AAR as a percentage of LV mass
- %LV-hemorrhage
- hemorrhage as a percentage of LV mass
- %LV-MVO
- MVO as a percentage of LV mass
- %LV–myocardial edema
- myocardial edema as a percentage of LV mass
- %LV-scar
- scar as a percentage of LV mass
- SD
- standard deviation
References
- 1.Van de Werf F, Bax J, Betriu A, et al. Management of acute myocardial infarction in patients presenting with persistent ST-segment elevation: the Task Force on the Management of ST-Segment Elevation Acute Myocardial Infarction of the European Society of Cardiology. Eur Heart J 2008;29(23):2909–2945 [DOI] [PubMed] [Google Scholar]
- 2.Orn S, Manhenke C, Anand IS, et al. Effect of left ventricular scar size, location, and transmurality on left ventricular remodeling with healed myocardial infarction. Am J Cardiol 2007;99(8):1109–1114 [DOI] [PubMed] [Google Scholar]
- 3.Wu E, Ortiz JT, Tejedor P, et al. Infarct size by contrast enhanced cardiac magnetic resonance is a stronger predictor of outcomes than left ventricular ejection fraction or end-systolic volume index: prospective cohort study. Heart 2008;94(6):730–736 [DOI] [PubMed] [Google Scholar]
- 4.Wu KC, Zerhouni EA, Judd RM, et al. Prognostic significance of microvascular obstruction by magnetic resonance imaging in patients with acute myocardial infarction. Circulation 1998;97(8):765–772 [DOI] [PubMed] [Google Scholar]
- 5.Hombach V, Grebe O, Merkle N, et al. Sequelae of acute myocardial infarction regarding cardiac structure and function and their prognostic significance as assessed by magnetic resonance imaging. Eur Heart J 2005;26(6):549–557 [DOI] [PubMed] [Google Scholar]
- 6.Abdel-Aty H, Zagrosek A, Schulz-Menger J, et al. Delayed enhancement and T2-weighted cardiovascular magnetic resonance imaging differentiate acute from chronic myocardial infarction. Circulation 2004;109(20):2411–2416 [DOI] [PubMed] [Google Scholar]
- 7.Carlsson M, Ubachs JF, Hedström E, Heiberg E, Jovinge S, Arheden H. Myocardium at risk after acute infarction in humans on cardiac magnetic resonance: quantitative assessment during follow-up and validation with single-photon emission computed tomography. JACC Cardiovasc Imaging 2009;2(5):569–576 [DOI] [PubMed] [Google Scholar]
- 8.Eitel I, Desch S, Fuernau G, et al. Prognostic significance and determinants of myocardial salvage assessed by cardiovascular magnetic resonance in acute reperfused myocardial infarction. J Am Coll Cardiol 2010;55(22):2470–2479 [DOI] [PubMed] [Google Scholar]
- 9.Ganame J, Messalli G, Dymarkowski S, et al. Impact of myocardial haemorrhage on left ventricular function and remodelling in patients with reperfused acute myocardial infarction. Eur Heart J 2009;30(12):1440–1449 [DOI] [PubMed] [Google Scholar]
- 10.Bellenger NG, Grothues F, Smith GC, Pennell DJ. Quantification of right and left ventricular function by cardiovascular magnetic resonance. Herz 2000;25(4):392–399 [DOI] [PubMed] [Google Scholar]
- 11.Wagner A, Mahrholdt H, Holly TA, et al. Contrast-enhanced MRI and routine single photon emission computed tomography (SPECT) perfusion imaging for detection of subendocardial myocardial infarcts: an imaging study. Lancet 2003;361(9355):374–379 [DOI] [PubMed] [Google Scholar]
- 12.Klein C, Nekolla SG, Bengel FM, et al. Assessment of myocardial viability with contrast-enhanced magnetic resonance imaging: comparison with positron emission tomography. Circulation 2002;105(2):162–167 [DOI] [PubMed] [Google Scholar]
- 13.Nijveldt R, Beek AM, Hirsch A, et al. Functional recovery after acute myocardial infarction: comparison between angiography, electrocardiography, and cardiovascular magnetic resonance measures of microvascular injury. J Am Coll Cardiol 2008;52(3):181–189 [DOI] [PubMed] [Google Scholar]
- 14.Francone M, Bucciarelli-Ducci C, Carbone I, et al. Impact of primary coronary angioplasty delay on myocardial salvage, infarct size, and microvascular damage in patients with ST-segment elevation myocardial infarction: insight from cardiovascular magnetic resonance. J Am Coll Cardiol 2009;54(23):2145–2153 [DOI] [PubMed] [Google Scholar]
- 15.Nijveldt R, Hofman MB, Hirsch A, et al. Assessment of microvascular obstruction and prediction of short-term remodeling after acute myocardial infarction: cardiac MR imaging study. Radiology 2009;250(2):363–370 [DOI] [PubMed] [Google Scholar]
- 16.Ørn S, Manhenke C, Greve OJ, et al. Microvascular obstruction is a major determinant of infarct healing and subsequent left ventricular remodelling following primary percutaneous coronary intervention. Eur Heart J 2009;30(16):1978–1985 [DOI] [PubMed] [Google Scholar]
- 17.Ibrahim T, Hackl T, Nekolla SG, et al. Acute myocardial infarction: serial cardiac MR imaging shows a decrease in delayed enhancement of the myocardium during the 1st week after reperfusion. Radiology 2010;254(1):88–97 [DOI] [PubMed] [Google Scholar]
- 18.Rochitte CE, Lima JA, Bluemke DA, et al. Magnitude and time course of microvascular obstruction and tissue injury after acute myocardial infarction. Circulation 1998;98(10):1006–1014 [DOI] [PubMed] [Google Scholar]
- 19.Wu KC, Kim RJ, Bluemke DA, et al. Quantification and time course of microvascular obstruction by contrast-enhanced echocardiography and magnetic resonance imaging following acute myocardial infarction and reperfusion. J Am Coll Cardiol 1998;32(6):1756–1764 [DOI] [PubMed] [Google Scholar]
- 20.Mosteller RD. Simplified calculation of body-surface area. N Engl J Med 1987;317(17):1098. [DOI] [PubMed] [Google Scholar]
- 21.Kim RJ, Fieno DS, Parrish TB, et al. Relationship of MRI delayed contrast enhancement to irreversible injury, infarct age, and contractile function. Circulation 1999;100(19):1992–2002 [DOI] [PubMed] [Google Scholar]
- 22.de Waha S, Desch S, Eitel I, et al. Impact of early vs. late microvascular obstruction assessed by magnetic resonance imaging on long-term outcome after ST-elevation myocardial infarction: a comparison with traditional prognostic markers. Eur Heart J 2010;31(21):2660–2668 [DOI] [PubMed] [Google Scholar]
- 23.Friedrich MG, Abdel-Aty H, Taylor A, Schulz-Menger J, Messroghli D, Dietz R. The salvaged area at risk in reperfused acute myocardial infarction as visualized by cardiovascular magnetic resonance. J Am Coll Cardiol 2008;51(16):1581–1587 [DOI] [PubMed] [Google Scholar]
- 24.Garcia-Dorado D, Théroux P, Munoz R, et al. Favorable effects of hyperosmotic reperfusion on myocardial edema and infarct size. Am J Physiol 1992;262(1 pt 2):H17–H22 [DOI] [PubMed] [Google Scholar]
- 25.García-Dorado D, Oliveras J, Gili J, et al. Analysis of myocardial oedema by magnetic resonance imaging early after coronary artery occlusion with or without reperfusion. Cardiovasc Res 1993;27(8):1462–1469 [DOI] [PubMed] [Google Scholar]
- 26.Bragadeesh T, Jayaweera AR, Pascotto M, et al. Post-ischaemic myocardial dysfunction (stunning) results from myofibrillar oedema. Heart 2008;94(2):166–171 [DOI] [PubMed] [Google Scholar]
- 27.Nilsson JC, Nielsen G, Groenning BA, et al. Sustained postinfarction myocardial oedema in humans visualised by magnetic resonance imaging. Heart 2001;85(6):639–642 [DOI] [PMC free article] [PubMed] [Google Scholar]
- 28.Ripa RS, Nilsson JC, Wang Y, Søndergaard L, Jørgensen E, Kastrup J. Short- and long-term changes in myocardial function, morphology, edema, and infarct mass after ST-segment elevation myocardial infarction evaluated by serial magnetic resonance imaging. Am Heart J 2007;154(5):929–936 [DOI] [PubMed] [Google Scholar]
- 29.Abdel-Aty H, Simonetti O, Friedrich MG. T2-weighted cardiovascular magnetic resonance imaging. J Magn Reson Imaging 2007;26(3):452–459 [DOI] [PubMed] [Google Scholar]


