Abstract
We present a method to make phantoms of coronary arteries for intravascular optical coherence tomography (IV-OCT). The phantoms provide a calibrated OCT response similar to the layered structure of arteries. The optical properties of each layer are achieved with specific concentrations of alumina and carbon black in a silicone matrix. This composition insures high durability and also approximates the elastic properties of arteries. The phantoms are fabricated in a tubular shape by the successive deposition and curing of liquid silicone mixtures on a lathe setup.
OCIS Codes: (110.4500) Optical coherence tomography, (170.6935) Tissue characterization
1. Introduction
Now that intravascular optical coherence tomography (IV-OCT) is accepted for clinical use in the United States, Europe and Japan, it is quickly evolving toward widespread utilization and commercialization. Further progression of the technology would be facilitated by its standardization and validation [1]. In that standardization and validation process, phantoms would play an important role.
The characteristics of phantoms needed in the standardization and validation of a technology are often more complex than those needed at earlier stages of development. Initial testing of an optical system such as an OCT system can be performed on simple scattering slabs. However, the validation of a clinical system requires phantoms that closely mimic actual tissues [2]. The optical properties of the phantoms must be predictable and adjustable to represent different states of tissue. The standardization also requires phantoms that are durable, so they can serve as a reference to compare systems over time.
In addition to standardization and validation, durable phantoms that closely mimic tissues can find uses as targets for training new users, for demonstrations, and for the development of new hardware or new applications.
Various types of phantoms have previously been presented [3]. For OCT, phantoms have been developed to perform image analysis [4], to test magnetomotive [5] and elastographic [6] contrasts, to characterize the resolution of systems [7,8], and to mimic tissue optical properties with biological contrast agents [9]. A fabrication technique has also recently been presented to mimic complex structures in flat tissues [10].
However, IV-OCT is used to image arteries. Arteries have a tubular geometry and a multilayer composition. To our knowledge, no fabrication technique has been reported to fabricate such phantoms. Furthermore, no phantom designed for OCT has, to our knowledge, mimicked the optical properties of specific tissues.
In this paper, we introduce a method to fabricate multilayer phantoms in a tubular geometry. The method is used to fabricate phantoms of healthy coronary arteries. The phantoms give an OCT signal calibrated to mimic that of porcine coronary arteries. They are durable and also have elastic properties similar to arteries.
First, we describe the design of our phantoms and the method developed for their fabrication. Second, we describe and demonstrate how we determine the phantom composition to mimic the optical properties of coronary arteries. Third, we validate our choice of components by demonstrating the durability and homogeneity of the phantoms, which are very important properties for utilization of phantoms in a validation and standardization process. Finally, we illustrate the use of our fabrication technique by presenting an OCT image of a phantom mimicking the OCT response of a specific artery. Elements of discussion are presented throughout the paper, as the results highlight the advantages and the limitations of our method.
2. Design and fabrication method
In this section, we describe both the design and the fabrication of artery phantoms. First, the design subsection presents the general strategy underlying our proposed fabrication method. Then, the fabrication subsection describes the different constituents used and how they are put together to fabricate artery phantoms.
2.1. Design
Healthy coronary arteries are composed of three tissue layers: the intima, the media, and the adventitia. The innermost layer is the intima, a very thin layer of endothelial cells; the middle layer is the media, a thicker layer composed primarily of smooth muscle cells; the outer layer is the adventitia, a layer mostly composed of collagen and connective tissue. Figure 1 shows an OCT image of a porcine coronary artery acquired in a beating heart model [11]. All three layers are distinctively observed because of their characteristic OCT signal: the intima shows as a fine band of high signal near the lumen; the media shows as a thick band of low signal; and the adventitia shows as another band of high signal.
Fig. 1.
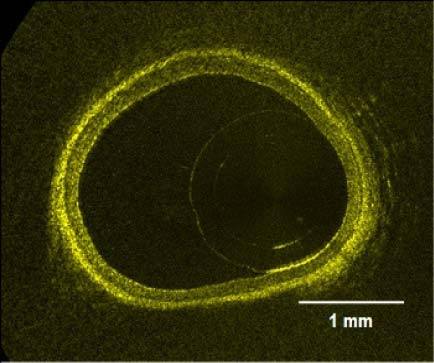
OCT image of a healthy porcine coronary artery acquired in a beating heart model.
In a homogeneous scattering medium, the amplitude of the OCT signal is related to the backscattering of the medium, and decays in depth with its total attenuation coefficient (µtot) [12]. We choose to make phantoms specifically for OCT by only replicating this subset of the optical properties of tissues. Throughout this paper, the term optical properties will then relate to this subset: the backscattering and the total attenuation of tissues. Replicating the backscattering and the total attenuation of specific tissues is achieved by mixing scattering particles and an absorbent in a transparent medium. To make phantoms of arteries, each artery layer is approximated as a homogeneous scattering medium, and a mixture is prepared with different concentrations of the scattering and absorbing ingredients. The concentrations in each mixture are determined through a calibration process, which includes two steps. The first step is the characterization of the optical properties of the phantoms with the concentration of each constituent. The second step is the determination of target values for each layer through measurements of arteries. Once the concentrations needed to mimic each layer are known, the phantoms are constructed in the form of a multilayer tube, with layer thicknesses varying between 20 to 300 µm.
Coronary arteries are also elastic soft tissues. Mimicking their mechanical behavior in addition to their optical properties widens the range of applications for the phantoms. Examples of applications like monitoring angioplasty procedures, OCT elastography, etc. would not be possible with hard phantoms. In our method, elastic phantoms are obtained through the choice of an elastic transparent medium to mix the particles in. In this paper, we approximate that all three artery layers have the same behavior and choose a material that mimics the elasticity of the whole artery. Nevertheless, our proposed method can be used to fabricate more complex phantoms with different mechanical properties for each layer.
2.2. Fabrication
The support material of our phantoms is a mixture of a commercially available silicone (Sylgard 184, Dow Corning) with pure poly(dimethyl siloxane) (PDMS) (Fluid 200, 50 cst, Dow Corning). Sylgard 184 is sold as a two part kit (resin:reactive) to be mixed in a 10:1 proportion. It cures in 48 hours at room temperature. Increasing the resin:reactive ratio of Sylgard 184 softens the resulting silicone to some extent [13]. Adding PDMS further softens the silicone [5], but these formulations would require weeks to cure if not heated. Different formulations of silicone were characterized by tensile tests to compare their elasticity with that of a porcine coronary artery. The results are presented in Fig. 2 . Each curve is identified by the PDMS:resin:reactive ratio of the sample. The formulation that better matches the elasticity of the artery for low deformations has a 22.5:15:1 ratio. However, the resulting silicone remains sticky. Typically, we use a ratio of 15:15:1. This formulation is much less sticky, but still approximates the elasticity of arteries much better than the standard formulation of Sylgard 184. The 15:15:1 formulation cures in about 1 hour at 50°C, or faster at higher temperatures.
Fig. 2.
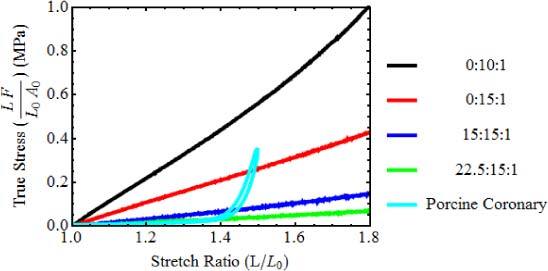
Results of tensile tests for different silicone formulations and for a porcine coronary artery. Curves are identified by the PDMS:resin:reactive ratio. (L length, L0 length before stretch, F force, A0 cross section area before stretch).
Alumina powder (Al2O3) provides the main contribution to the backscattering in the phantoms. A sample of 1 µm (nominal) deagglomerated alpha alumina polishing powder was kindly provided by Struers (Ballerup, Denmark). The specific gravity of alumina is 3.89 g/cm3 and its refractive index is approximately 1.73. The powder was observed under scanning electron microscopy (SEM) to assess the shape and size of the particles. The particles have a somewhat spherical shape and a diameter of approximately 300 nm. Due to scattering, the alumina also causes significant attenuation.
Further attenuation, when needed, is provided by carbon black. A free sample of Monarch 700 was kindly provided by Cabot (Boston, Massachusetts). Its specific gravity is 1.7–1.9 g/cm3. SEM imaging showed approximately spherical particles that are 50 nm in diameter.
Mixtures are prepared by weighing the particles and adding the PDMS and Sylgard resin, without the reactive. The mixtures are sonicated for at least 5 hours to obtain uniform dispersions with a minimum of aggregates, before adding the reactive.
Once the concentrations needed to mimic the optical properties of the three artery layers are obtained through a calibration process described in Section 3, the artery phantoms are constructed with a method specifically developed to fabricate multilayer tubes. The method consists in the successive deposition and curing of the layers on a lathe setup. Figure 3 presents a schematic of the lathe setup. The setup is built around a rotating shaft. Close to the shaft is a blade mounted on precision rotation and translation stages. The distance and angle of the blade relative to the shaft determine the layer thickness on the full length of the phantom. The liquid mixture of a layer is deposited with a syringe while the shaft rotates. A heating element is located close to the setup to heat the mixture for polymerization. Once a layer is cured, the blade is retracted to the desired thickness for the next layer, and a different mixture is applied. The process is repeated until the required number of layers is obtained. Finally, the phantom is removed from the shaft very carefully, to avoid tearing.
Fig. 3.
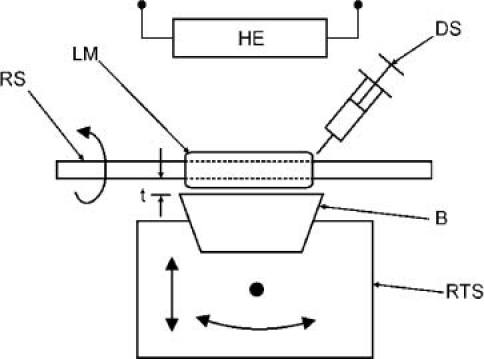
Lathe setup for artery phantom fabrication. (RS rotating shaft, LM layer mixture, DS deposition syringe, (B) blade, RTS rotation and translation stage, HE heating element, t thickness)
3. Optical calibration
The calibration process consists in the determination of the concentrations of alumina and carbon black required to mimic the optical properties of each artery layer. It involves the characterization of the backscattered amplitude and the total attenuation coefficient for various concentrations of both alumina and carbon black. It also involves the characterization of typical values from coronary arteries. In both cases, values are obtained from OCT measurements. In this section, we describe the method used to extract values of the backscattered amplitude and the total attenuation coefficient from OCT measurements. Then, we present the results obtained from the characterization of phantoms with various concentrations; and finally, we present the values obtained from the characterization of coronary arteries.
3.1. Determination of optical properties through OCT measurements
The OCT measurements are performed with a custom-built time domain OCT (TD-OCT) system built around an optical delay line based on rotating rhombic prisms [14] commercialized by Novacam Technologies (Pointe-Claire, Canada). The light source is a superluminescent light-emitting diode (Denselight, Singapore) centered at 1.3 µm with a bandwidth of 70 nm to provide a theoretical OCT resolution of about 11 µm. The beam in the sample arm of the interferometer is focused to a 42 µm diameter spot with a 2.1 mm depth of field measured in air. This long depth of field minimizes the influence of the focusing optics on the extraction of the optical properties.
To insure repeatable measurements of the amplitude of the OCT signal, a reference setup was created. The reference setup consists in a sample window, a reference window, and an attenuator mounted together. The sample window is used to fix the sample position relative to the focal point of the incident beam. Its bottom surface is placed at the focal position of the beam and samples are slightly pressed against this surface. The window has an anti-reflective coating and a 2° inclination perpendicular to the incident beam to avoid saturation of its reflection. The reference window is placed in the vicinity of the sample window. Its upper surface is at focus and is perpendicular to the beam to insure a reflection with stable amplitude. An attenuator of optical density 3.0 (OD) is located above the reference window with a 3° inclination to avoid saturation of reflections from both the reference window and the attenuator. Each measurement of a sample is followed by a measurement of the reference window, and the signal is normalized by dividing its values by the peak value of the reference reflection. This setup accounts for variations of the system parameters like source power, gain, polarization, etc.
Values for the backscattered amplitude and total attenuation coefficient are obtained from OCT images by first selecting regions of interest (ROIs). The selection criteria are discussed later, since they differ when calibration samples or arteries are measured. Second, the ROIs are averaged along the lateral direction to smooth speckle, giving the average OCT profile. Third, the average OCT profiles are normalized to the amplitude of the reference reflection. Fourth, the noise level is subtracted and the result is corrected for amplitude variations of the axial point spread function due to beam propagation. That correction has little effect considering the depth of field of the beam used. Fifth, the normalized profiles are converted into their logarithm form. Finally, they are fitted with a linear model based on single scattering:
| (1) |
where is the averaged OCT profile, A is the backscattered amplitude of signal, µtot is the total attenuation coefficient of the sample, z is the optical depth in the image, z0 is the position of the surface or the beginning of a layer in the sample, and n is the refractive index of the phantom or artery. We follow the usual convention of defining µtot for the intensity. Therefore, the factor 2 that takes into account the roundtrip passage in an interferometer is cancelled by the fact that the OCT signal is proportional to the electric field backscattered by the sample. Calculations and fits are performed with Mathematica 7.0 (Wolfram Research, Champaign, USA).
3.2. Properties of phantoms
The backscattered amplitude (A) and the total attenuation coefficient (µtot) are expected to vary differently with the concentration of particles in the phantoms. Considering one kind of particles, the mathematical derivation presented in Appendix 1 shows that the backscattered amplitude is proportional to the square root of their concentration [4]. This relation is obtained by considering speckle statistics. For the total attenuation coefficient, a relation proportional to the concentration of particles can be derived based on single scattering and Mie theory [15].
When mixing several kinds of particles with different scattering properties, Appendix 1 shows that the total backscattered amplitude takes the form:
| (2) |
where Ci is the concentration of a specific kind of particles, and ai is a parameter defining the contribution of these particles to the backscattered amplitude. For the total attenuation coefficient, the relation remains linear:
| (3) |
where bi is a parameter defining the contribution of these particles to the total attenuation.
The concentration dependencies specific to the addition of alumina and carbon black in silicone are measured from calibration phantoms. Calibration phantoms are made from mixtures prepared with the same process described in Section 2.2 using the 15:15:1 silicone formulation. However, instead of using the lathe setup, the mixtures are cast in flat moulds and cured in a laboratory oven at 50°C during one hour.
In total, 64 slab shaped calibration samples were fabricated with concentration ranging from 0 to 60 mg/ml of alumina, and 0 to 1.6 mg/ml of carbon black in various combinations. The specimens were divided into 7 batches where the concentration of one additive was varied, while the other was kept constant. All specimens were measured from their top and bottom surfaces using TD-OCT with the reference setup described in Section 3.1. ROI were selected where there is good contact between the sample and the window it was pressed against. The signal was averaged and the fit was performed over the portion contained between 125 µm and 500 µm in depth. Figure 4 illustrates the fit process from two calibrations phantoms both with 0.3 mg/ml of carbon black and with 12 and 36 mg/ml of alumina.
Fig. 4.
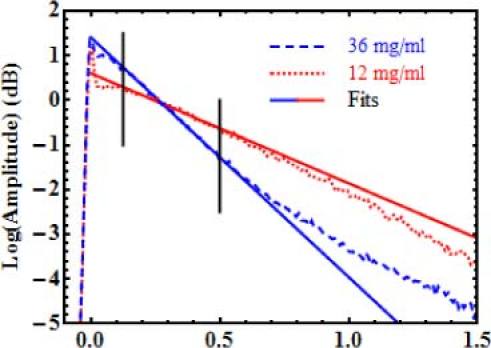
Examples of averaged OCT profiles and their fits. Samples have 0.3 mg/ml of carbon black. Alumina concentrations are 12 and 36 mg/ml. Only data between the vertical lines is considered in the fit.
The data deeper than 500 µm deviates from the single scattering model. For the high concentration sample, this deviation is a known effect resulting from multiple scattering. For the low concentration sample, the cause of the deviation needs further investigation. However, since artery layers are typically thin (20–300 µm), their average OCT profiles should not be affected by these deviations. Therefore, we choose to drop the data deeper than 500 µm.
Just after the surface reflection at depth zero, another deviation from the single scattering model appears. Measurements performed from the top, the bottom and the middle of cut cross sections of calibration samples all showed the same effect. Therefore, the hypothesis of non-uniformity in concentration at the surface of samples was ruled out. A similar deviation has previously been noted in Monte Carlo simulations by Wang et al. [16]. In their paper, they classify the photons detected by OCT in two categories: the least scattered photons (LSP), and the multiple scattered photons (MSP). The LSP include photons that undergo single backscattering events, but also photons that undergo a few very small-angle forward scattering events before being backscattered. This last portion of the LSP causes an increase of signal right after the surface, because a small depth is necessary for the forward scattering events to occur before they are backscattered and contribute to the OCT signal. Nevertheless, Wang et al. show that after that deviation, the signal from the all the LSP has the form of an exponential decay like the single scattering model. Therefore, in our paper, we chose to neglect this effect and start the fit at 125 µm deep, dropping this deviation. The value of the backscattered amplitude, however, is still the value of the fit extrapolated to depth zero. The impact of this extrapolation on the values extracted is not significant, since the calibration process is a comparison of values between calibration samples and arteries. Therefore, the backscattered amplitudes can still be compared, as long as the same extrapolation is performed on fits from arteries as well.
After fitting all samples, the concentration dependencies are obtained by plotting the resulting optical properties with respect to the varying concentrations in each batch of phantoms. Then another fit is performed on these curves with the models of Eq. (2) for the backscattered amplitude and Eq. (3) for the total attenuation coefficients. This process is illustrated in Fig. 5 for a batch of 8 calibration samples having concentrations from 0 to 42 mg/ml of alumina and a fixed concentration of 0.3 mg/ml of carbon black. Values of the optical properties are presented for measurements performed from both the top (blue circles) and the bottom (green squares) surfaces of samples, along with the fitted concentration dependencies (red line). The agreement between the optical properties measured from the top and the bottom of the calibration samples also indicates a very good homogeneity.
Fig. 5.
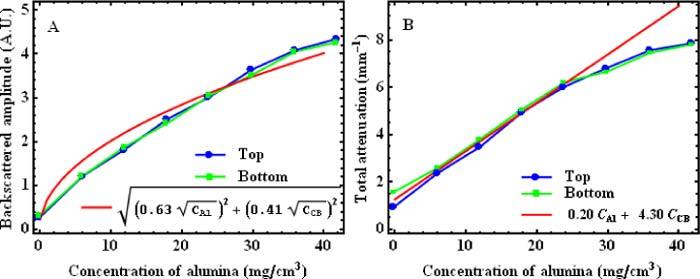
Plots of backscattered amplitude (A) and total attenuation coefficient (B) for a batch of 8 calibration samples having concentrations from 0 to 42 mg/ml of alumina and a fixed concentration of 0.3 mg/ml of carbon black. Each plot shows values obtained from OCT measurements performed on the top (blue circles) and the bottom (green squares) of calibration phantoms; and the fitted concentration dependencies (red lines) (CAlu: concentration of alumina; CCB: concentration of carbon black; A. U.: Arbitrary units)
In both Fig. 5A and Fig. 5B, the agreement between the expected concentration dependencies (Eq. (2) and Eq. (3)) and the data is quite good, but there are slight discrepancies. In Fig. 5B, the linear relation is well matched for the low concentrations; but at higher concentrations, the attenuation measured is less than expected. It is likely that the higher concentrations are affected by multiple scattering, which decreases the attenuation expected from the single scattering model. Because of the slight discrepancies, experimental calibration curves are considered more accurate than the fitted concentration dependencies to choose the concentrations required to mimic specific tissues. We illustrate the use of the calibration curves for the choice of concentrations in Section 3.4. Nevertheless, the fits with Eq. (2) and Eq. (3) still provide a good approximation, and they give insight on the overall behavior of the optical properties with the variation of composition of the phantoms.
The fitted concentration dependencies obtained for the 7 batches of calibration are summarized in Table 1 . These concentration dependencies provide the fitted parameters ai, from Eq. (2), and bi, from Eq. (3), for each batch. Ideally, the values should be the same for all batches. They represent the contribution of particles i to the OCT signal, and that contribution is expected to be independent of other particles. For the alumina, the aAlu values range between 0.48 and 0.69, and the bAlu values range between 0.16 and 0.22. These ranges are quite small, considering that the data already shows some discrepancies with the expected forms of Eq. (2) and Eq. (3). This indicates good predictability of the optical properties with respect to the concentration of alumina. In the case of carbon black, aCB values range from 0.41 to 2.58. This variation is very large, but since the contribution of carbon black to the backscattered amplitude is negligible compared to the contribution of alumina, the aCB values are very imprecise. For the total attenuation coefficient, bCB values range mainly from 4.30 to 5.90 except for one case, with a value of 2.92. A larger variation for carbon black than for alumina is to be expected because very small quantities of carbon black were weighted in the mixture preparation of these samples. Those quantities range from 10 to 50 mg and even though the balance used has a precision down to 0.1 mg, a precision of approximately 10 mg is more realistic due to the challenges of weighing nanopowders. Making larger batches could improve this control. Overall, Table 1 gives a good overview of how well the optical properties of the phantoms can be predicted with our method.
Table 1. Fitted calibration relations for 7 batches of calibration samples.
| Samples | Concentration of alumina (mg/ml) | Concentration of carbon black (mg/ml) | Fitted concentration dependencies for backscattered amplitude. | Fitted concentration dependencies for total attenuation |
|---|---|---|---|---|
| 01 to 16 | 1.0 to 60.0 | 0 | ||
| 17 to 24 | 0 to 41.9 | 0.3 | ||
| 25 to 32 | 0 to 42.5 | 0.6 | ||
| 33 to 40 | 0 | 0.2 to 1.6 | ||
| 41 to 48 | 10.3 | 0 to 0.8 | ||
| 49 to 56 | 20.3 | 0 to 0.8 | ||
| 57 to 64 | 30.2 | 0 to 0.8 |
3.3. Properties of arteries
Target values of the backscattered amplitude and the total attenuation coefficient for artery layers are also needed. To validate our fabrication process, we choose to use optical properties from porcine coronary arteries, since they are easily available. However, porcine arteries usually do not show atherosclerosis, and their intima is a very thin single layer of cells (approx. 10 µm). The signal from the intima layer is often undistinguishable from the reflection of the window upon which the sample is pressed (see description of reference setup in Section 3.1). Therefore, target optical properties are only measured for the media and the adventitia.
Porcine hearts were acquired from a slaughterhouse and kept at −80°C until 2 to 3 days before measurement. They were thawed in a refrigerator at 8°C. The left anterior descending artery (LAD) and the right coronary artery (RCA) were extracted, and cut open into segments. The segments were imaged using TD-OCT with the reference setup. To obtain a flat interface, the artery segments were slightly pressed against the sample window. In the images acquired, we selected regions of interest (ROI) where there was good contact between the intima and the sample window, and where the media-adventitia interface was parallel to the window-intima interface. In total, 248 ROI of width ranging from 0.8 to 5.5 mm were obtained from 7 arteries of 4 different hearts. The averaged OCT profile of each ROI was computed. It was normalized with the reference reflection and corrected for noise and PSF variations, before it was fitted with Eq. (1), as described in Section 3.1. Values of A and µt were obtained for both the media and the adventitia. For the adventitia, A was corrected for the attenuation through the media. Figure 6 shows an example of fit of an artery average OCT profile. Many profiles measured in arteries showed a deviation from the single scattering model right after the reflection from the interface. This kind of deviation was previously observed in the calibration phantoms (Fig. 4). Observing this deviation in tissues further supports the hypothesis that the deviation observed in Fig. 4 is due to an optical effect, and not to inhomogeneities in the phantoms. Like for the profiles of calibration samples, the deviation was not used in the fit of artery profiles. Histogram representations of the backscattered amplitude and the total attenuation coefficient measured for both layers in all the profiles are presented in Fig. 7 . The results of Fig. 7 show a lot of variability in both properties of both layers. With such variability, there is a wide range of target values that can be used to obtain representative phantoms.
Fig. 6.
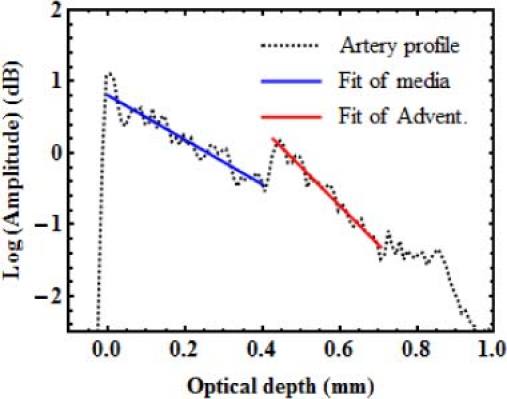
Example of the fit of an averaged OCT profile measured on a porcine coronary artery.
Fig. 7.
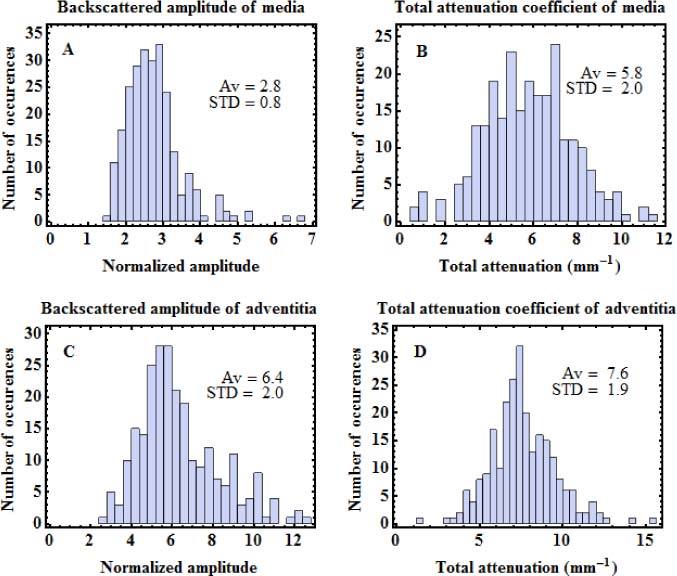
Statistical distributions of optical properties of porcine coronary arteries measured by OCT. A. Backscattering amplitude of media, B. Attenuation of media. C. Backscattering amplitude of adventitia. D. Attenuation of adventitia. Average (Av) and standard deviation (STD) of each distribution are indicated on the graphs.
3.4. Optical validation
We illustrate the calibration process and demonstrate the adjustability of the optical properties by mimicking the averaged OCT profile from a specific artery image acquired for the characterization of Section 3.3. The optical properties extracted from that particular profile are given in Table 2 . The four values are less than one standard deviation away from the average of the distributions presented in Fig. 7.
Table 2. Optical properties measured on the artery and the two-layer phantoms presented in Fig. 8. The optical properties of single-layer phantoms made with the mixtures used for each layer are also presented.
| Sample | Media |
Adventitia |
|||
|---|---|---|---|---|---|
| Backscattered amplitude | Total attenuation (mm−1) | Backscattered amplitude | Total attenuation (mm−1) | ||
| Artery | 2.2 | 4.2 | 4.6 | 7.3 | |
| Media layer of phantoms 1 and 2 | 2.2 | 4.3 | — | — | |
| Adventitia layer of phantom 1 | — | — | 4.6 | 7.2 | |
| Phantom 1 | 2.0 | 3.9 | 3.9 | 6.3 | |
| Adventitia layer of phantom 2 | — | — | 5.8 | 8.2 | |
| Phantom 2 | 2.2 | 4.4 | 4.7 | 7.1 | |
From the calibration curves, we find the concentrations required to mimic the optical properties of that artery. We note again that experimental results directly from the calibration samples are considered over the fitted concentration dependencies of Table 1. The data of samples 1 to 16 of Table 1 (various alumina concentrations, no carbon black), is used at first to find preliminary concentrations of alumina that provide the required backscattered amplitudes for each layer. The data also gives the total attenuation corresponding to these concentrations. If additional attenuation is required, preliminary concentrations of carbon black are obtained from the data of samples 17 to 24 (various carbon black concentrations, no alumina). The preliminary concentrations are adjusted, if necessary, based on the data obtained from samples 25 to 64 where samples combining similar concentrations of both alumina and carbon black have been characterized. Following that process, we obtain concentrations of 14 mg/ml of alumina and 0.5 mg/ml of carbon black for the media layer; and 50 mg/ml of alumina, no carbon black, for the adventitia.
With mixtures prepared with these concentrations, we cast two single-layer phantoms, flat-shaped like calibration phantom. The two mixtures were also successively cast and cured to make a flat two-layer phantom (phantom 1), using predefined volumes to adjust layer thickness. These samples were measured with TD-OCT using the reference setup and their optical properties were extracted with the same process as for calibration phantoms or for artery segments. Figure 8A shows the averaged OCT profile of phantom 1 plotted over the artery profile. The agreement between both profiles is very good.
Fig. 8.
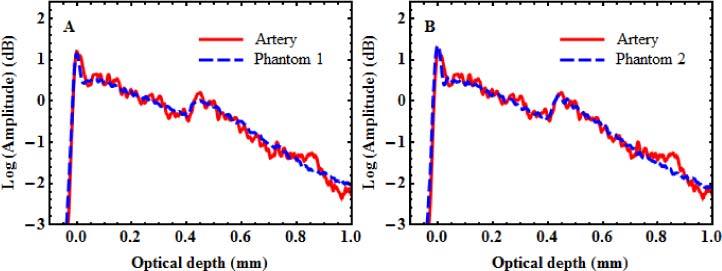
Averaged OCT profiles of two-layer phantoms plotted with corresponding artery profile. (A) Phantom based on calibration samples (B) Improved phantom fabricated with further refinement of the alumina concentration in the adventitia layer.
The optical properties measured for phantom 1 and the single-layer phantoms corresponding to its media and its adventitia layers are also presented in Table 2. The values obtained for the single-layer phantoms correspond very well with the target values of the artery. It confirms that despite some uncertainties in the measurements and some deviations from the models, the calibration curves are very efficient in predicting the concentrations needed to mimic specific optical properties. The measured properties of the adventitia layer of phantom 1, however, slightly differ from the properties measured from the corresponding single-layer phantom, most likely due to the passage through the media layer of phantom 1. The effect of that difference on the agreement between the profiles in Fig. 8A is very small.
Nevertheless, based on the results of phantom 1, a small empirical correction in the composition of the adventitia layer can be made to obtain an even better agreement. Increasing the concentration to 60 mg/ml of alumina, a new single-layer and a new two-layer phantom (phantom 2) were fabricated and measured. The profile of phantom 2, also plotted over the artery profile, is presented in Fig. 8B. The optical properties obtained for phantom 2 and the single-layer phantom with 60 mg/ml of alumina are given in Table 2. Only with that small adjustment, the agreement between the artery and phantom 2 becomes excellent for both the profiles and the measured optical properties of the layers.
4. Phantom durability and homogeneity
For many applications, and especially for a standardization and validation process, the durability of phantoms is a highly valued characteristic. To assess the durability of our phantoms, two series of OCT measurements on calibration phantoms were performed thirteen months apart. The second series of measurements was also designed to assess the homogeneity of the phantoms.
The whole experiment was performed on a batch of calibration samples containing 10 mg/ml of alumina, and 0 to 0.8 mg/ml of carbon black (samples 37 to 44 of Table 1). The measurements were performed with the TD-OCT system with the reference setup; and the optical properties were extracted with the method described in Section 3.1. For the two series of measurements, the dependencies of the backscattered amplitude and the total attenuation coefficient upon the carbon black concentration are presented in Fig. 9A and Fig. 9B, respectively. In November 2009 (green dots), single images were analyzed for each phantom. In December 2010 (blue dots), nine images from different locations were analyzed for each phantom.
Fig. 9.
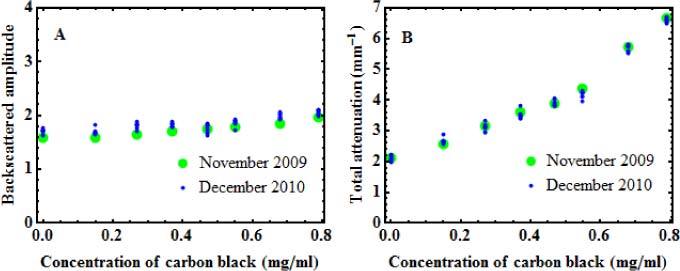
Backscattered amplitudes (A) and total attenuation (B) measured 13 months apart on a batch of calibration phantoms with increasing concentration of carbon black and fixed concentration of alumina (10 mg/ml). For the November 2009 series, measurements performed in a single region are shown (green dots), while for the December 2010 series, measurements performed in 9 different regions are shown (blue dots).
The consistency of the results is very good, with standard deviations of less than 5% between all the values obtained from each sample. No evolution of the properties is observed between the values of 2009 and the values of 2010, which demonstrates the durability of the phantoms over time. Although proof of durability is made for a period of one year, we believe that the shelf life of the phantoms is much longer. That consistency also shows that the reference setup is efficient in compensating for variations in the measurement system.
The very small variations observed in the values obtained from nine different locations in the December 2010 series also demonstrate the homogeneity of the phantoms. Homogeneity is another important property for phantoms to be used in a standardization and validation process.
5. Artery phantom imaging
We have demonstrated that our method allows mimicking specific optical properties and that the resulting phantoms are durable. We now demonstrate the fabrication of a multilayer tubular phantom with the method described in Section 2.2 and based on the lathe setup of Fig. 3.
For that demonstration, we fabricated an artery phantom to mimic the optical properties of the same artery as that considered in Section 3.4. The mixtures used in the fabrication of that phantom were 14 mg/ml of alumina and 0.5 mg/ml of carbon black for the media, and 60 mg/ml of alumina, no carbon black, for the adventitia. Since the intima is too thin, no target optical properties were obtained through the characterization of porcine arteries, as mentioned in Section 3.3. Qualitatively, the intima provides a higher OCT signal than the media, but a lower OCT signal than the adventitia. Based on these characteristics, a concentration of 20 mg/ml of alumina was chosen from our calibration curves to provide such a signature.
The phantom was fabricated by successively depositing and curing the three mixtures on the lathe setup, starting with the intima. After the phantom was removed from the shaft, it was imaged with our proprietary IV-OCT system based on swept-source technology. This IV-OCT system, including a custom-built catheter probe, was described in a recent publication [11]. It uses a Santec source (Aichi, Japan| sweeping over 108 nm around the 1.33 µm wavelength, at a rate of 30 kHz. An OCT image of the phantom is presented in Fig. 10 . The three layers of the phantom are well contrasted. Figure 10 also demonstrates that our technique allows the fabrication of layers as thin as 10-20 µm. Such a thin layer would be very difficult to obtain with a molding technique.
Fig. 10.
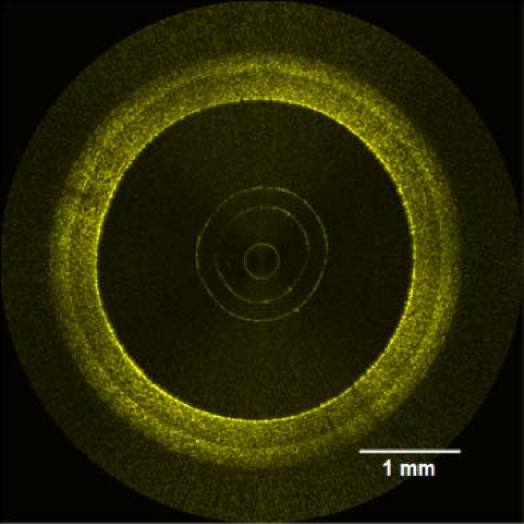
IV-OCT image of a coronary artery phantom.
6. Conclusion
We have presented a new method to fabricate phantoms of healthy coronary arteries. Each layer is made from a homogeneous mixture of alumina and carbon black in silicone. The silicone used in the phantom fabrication has elasticity similar to soft tissue for low deformations. By thoroughly characterizing the properties obtained from the various combinations of constituents, we are able to mimic the OCT signal from coronary arteries both in amplitude and in total attenuation. The polymerized mixtures of alumina and carbon black in silicone proved to maintain their optical properties over several months. We are confident that this period could be extended to several years.
The fabrication of the coronary artery phantoms is based on the successive deposition and curing of different mixtures on a lathe. Although coronary arteries are our preferred application, the method is well suited to other tubular tissues. There are several applications where OCT is used for imaging within tubular organs. In the field of endoscopic OCT, side imaging probes are used in the whole vascular system, the gastrointestinal tract, the breast duct and the urinary tract [17]. Following adequate characterization of the averaged OCT profile of these structures, it should be possible to make durable phantoms for these applications using our technique.
The development of this method to fabricate healthy artery phantoms is also a first step toward the fabrication of phantoms that can mimic arteries with various conditions related to atherosclerosis. Such phantoms would provide enhanced tools for the standardization and validation of IV-OCT.
Acknowledgments
The authors would like to thank Geneviève Gariépy for her work on the reference setup and on sample fabrication. The authors acknowledge the financial support provided by the National Research Council Canada through the Genomics and Health Initiative.
Appendix A
In this Appendix, we provide an approximate model for the dependency of the amplitude of the OCT signal upon the concentration of scatterers.
In time-domain OCT, imaging is usually obtained from the amplitude of the complex OCT signal . The complex OCT signal results from the interference between the electric field from the reference arm and the electric field from the sample arm of the interferometer. The complex OCT signal for a given optical depth z can be expressed in the simplified form
| (A1) |
where is a parameter related to the amplitude of backscattering provided by the nth scatterer located at optical depth, is the amplitude of the point-spread function, is a phase factor, and j is used for the unitary imaginary number. For a given optical depth z, only the scatterers contained within the probed volume defined by the width of contribute to the OCT signal. For a biological tissue, a large number of scatterers are usually contained within this probed volume. For each scatterer, the phase factor varies rapidly with the location of the scatterer. Therefore, the phase factor is uniformly distributed over the range . As a result, the complex OCT signal at a given optical depth z is a circular complex variable. This translates into the speckled nature of OCT images. The amplitude of the complex OCT signal is provided by [18]
| (A2) |
where denotes averaging. As a first approximation, the backscattering parameter takes the constant value a for all scatterers. Evaluating results in a constant term and the summation in Eq. (A2) becomes proportional to the concentration C of scatterers providing
| (A3) |
Generalizing Eqs. (A2) and (A3) to a mixture of different scatterers leads to
| (A4) |
where the summation runs over all i types of scatterers, each type being characterized by a concentration and a backscattering parameter .
The above result was obtained for time-domain OCT but applies equally well to Fourier-domain OCT.
References and links
- 1.The International Working Group For Intracoronary OCT Standardization and Validation (2009), http://www.octstandardization.org/site/
- 2.Nordstrom R. J., “The need for validation standards in medical imaging,” Proc. SPIE 7567, 756702 (2010). 10.1117/12.845508 [DOI] [Google Scholar]
- 3.Pogue B. W., Patterson M. S., “Review of tissue simulating phantoms for optical spectroscopy, imaging and dosimetry,” J. Biomed. Opt. 11(4), 041102 (2006). 10.1117/1.2335429 [DOI] [PubMed] [Google Scholar]
- 4.Bisaillon C.-E., Lamouche G., Maciejko R., Dufour M., Monchalin J.-P., “Deformable and durable phantoms with controlled density of scatterers,” Phys. Med. Biol. 53(13), N237–N247 (2008). 10.1088/0031-9155/53/13/N01 [DOI] [PubMed] [Google Scholar]
- 5.Oldenburg A. L., Toublan F. J.-J., Suslick K. S., Wei A., Boppart S. A., “Magnetomotive contrast for in vivo optical coherence tomography,” Opt. Express 13(17), 6597–6614 (2005). 10.1364/OPEX.13.006597 [DOI] [PubMed] [Google Scholar]
- 6.Grimwood A., Garcia L., Bamber J., Holmes J., Woolliams P., Tomlins P., Pankhurst Q. A., “Elastographic contrast generation in optical coherence tomography from a localized shear stress,” Phys. Med. Biol. 55(18), 5515–5528 (2010). 10.1088/0031-9155/55/18/016 [DOI] [PubMed] [Google Scholar]
- 7.Woolliams P. D., Ferguson R. A., Hart C., Grimwood A., Tomlins P. H., “Spatially deconvolved optical coherence tomography,” Appl. Opt. 49(11), 2014–2021 (2010). 10.1364/AO.49.002014 [DOI] [PubMed] [Google Scholar]
- 8.Agrawal A., Pfefer T. J., Gilani N., Drezek R., “Three-dimensional characterization of optical coherence tomography point spread functions with a nanoparticle-embedded phantom,” Opt. Lett. 35(13), 2269–2271 (2010). 10.1364/OL.35.002269 [DOI] [PubMed] [Google Scholar]
- 9.Kennedy B. F., Loitsch S., McLaughlin R. A., Scolaro L., Rigby P., Sampson D. D., “Fibrin phantom for use in optical coherence tomography,” J. Biomed. Opt. 15(3), 030507 (2010). 10.1117/1.3427249 [DOI] [PubMed] [Google Scholar]
- 10.de Bruin D. M., Bremmer R. H., Kodach V. M., de Kinkelder R., van Marle J., van Leeuwen T. G., Faber D. J., “Optical phantoms of varying geometry based on thin building blocks with controlled optical properties,” J. Biomed. Opt. 15(2), 025001 (2010). 10.1117/1.3369003 [DOI] [PubMed] [Google Scholar]
- 11.Lamouche G., Dufour M., Hewko M., Vergnole S., Gauthier B., Bisaillon C.-E., Monchalin J.-P., Sowa M. G., “Intravascular optical coherence tomography on a beating heart model,” J. Biomed. Opt. 15(4), 046023 (2010). 10.1117/1.3475960 [DOI] [PubMed] [Google Scholar]
- 12.Schmitt J. M., Knüttel A., Bonner R. F., “Measurement of optical properties of biological tissues by low-coherence reflectometry,” Appl. Opt. 32(30), 6032–6042 (1993). 10.1364/AO.32.006032 [DOI] [PubMed] [Google Scholar]
- 13.Jiang S., Pogue B. W., McBride T. O., Doyley M. M., Poplack S. P., Paulsen K. D., “Near-infrared breast tomography calibration with optoelastic tissue simulating phantoms,” J. Electron. Imaging 12(4), 613–620 (2003). 10.1117/1.1587153 [DOI] [Google Scholar]
- 14.Lamouche G., Dufour M., Gauthier B., Bartulovic V., Hewko M., Monchalin J. P., “Optical delay line using rotating rhombic prisms,” Proc. SPIE 6429, 64292G (2007). 10.1117/12.701047 [DOI] [Google Scholar]
- 15.V. V. Tuchin, “Tissue phantoms,” in Tissue Optics: Light scattering Methods And Instruments for Medical Diagnosis (SPIE, Bellingham, WA, 2000), pp. 98–108. [Google Scholar]
- 16.Wang R. K., “Signal degradation by multiple scattering in optical coherence tomography of dense tissue: a Monte Carlo study towards optical clearing of biotissues,” Phys. Med. Biol. 47(13), 2281–2299 (2002). 10.1088/0031-9155/47/13/307 [DOI] [PubMed] [Google Scholar]
- 17.Yaqoob Z., Wu J., McDowell E. J., Heng X., Yang C., “Methods and application areas of endoscopic optical coherence tomography,” J. Biomed. Opt. 11(6), 063001 (2006). 10.1117/1.2400214 [DOI] [PubMed] [Google Scholar]
- 18.J. W. Goodman, Speckle phenomena in optics—Theory and applications (Roberts & Company, Englewood, 2007). [Google Scholar]


