Abstract
Near infrared diffuse optical spectroscopy and diffuse optical imaging are promising methods that eventually may enhance or replace existing technologies for breast cancer screening and diagnosis. These techniques are based on highly sensitive, quantitative measurements of optical and functional contrast between healthy and diseased tissue. In this study, we examine whether changes in breast physiology caused by exogenous hormones, aging, and fluctuations during the menstrual cycle result in significant alterations in breast tissue optical contrast. A noninvasive quantitative diffuse optical spectroscopy technique, frequency-domain photon migration, was used. Measurements were performed on 14 volunteer subjects by using a hand-held probe. Intrinsic tissue absorption and reduced scattering parameters were calculated from frequency-domain photon migration data. Wavelength-dependent absorption (at 674, 803, 849, and 956 nm) was used to determine tissue concentration of oxyhemoglobin, deoxyhemoglobin, total hemoglobin, tissue hemoglobin oxygen saturation, and bulk water content. Results show significant and dramatic differences in optical properties between menopausal states. Average premenopausal intrinsic tissue absorption and reduced scattering values at each wavelength are 2.5- to 3-fold higher and 16–28% greater, respectively, than absorption and scattering for postmenopausal subjects. Absorption and scattering properties for women using hormone replacement therapy are intermediate between premenopausal and postmenopausal populations. Physiological properties show differences in mean total hemoglobin (7.0 μM, 11.8 μM, and 19.2 μM) and water concentration relative to pure water (10.9%, 15.3%, and 27.3%) for postmenopausal, hormone replacement therapy, and premenopausal subjects, respectively. Because of their unique, quantitative information content, diffuse optical methods may play an important role in breast diagnostics and improving our understanding of breast disease.
X-ray mammography is widely used for screening breast cancer, the most common form of cancer in women. Because of uncertainties associated with radiographic density, mammography has up to a 22% false-negative rate as well as a high false-positive rate (56.2% cumulative risk after 10 exams) in women under 50 years of age (1, 2). A recent study found that routine initial mammography was not clinically advantageous for women under 35 years of age (3). Furthermore, the use of hormone replacement therapy (HRT) in postmenopausal women is known to increase mammographic density (4) and has been shown recently to impede the efficacy of mammographic screening (5, 6). Techniques such as MRI and ultrasound (US) are used only as secondary procedures because of factors such as high cost and poor specificity (MRI) or low sensitivity (US).
Currently, invasive procedures such as fine-needle aspiration or surgical biopsy are implemented to provide a definitive diagnosis. Given the suboptimal performance of x-ray mammography in premenopausal and perimenopausal women, the majority of invasive follow-up procedures are performed on normal or benign tissue that present no malignant disease (7). As a result, the use of noninvasive, near-infrared (NIR) optical methods as a supplement to present techniques for diagnosing and detecting breast cancer has generated considerable interest.
Optical methods are advantageous, because they are noninvasive, quantitative, and relatively inexpensive; do not require compression; and pose no risk of ionizing radiation. A promising NIR optical technique currently under development is frequency domain photon migration (FDPM). FDPM methods have detected successfully the presence of small palpable breast lesions in vivo in women with previously diagnosed breast abnormalities (8–10).
FDPM employs intensity-modulated NIR light to characterize tissue quantitatively in terms of its optical parameters, i.e., the reduced-scattering coefficient (μs′) and the absorption coefficient (μa). The concentration of significant NIR absorbers [deoxyhemoglobin (Hb), oxyhemoglobin (HbO2), water, and adipose] can be calculated by using measured μa values (11, 12). Multiple scattering of light in breast tissue occurs as a consequence of spatial variations in refractive index, which are influenced by cellular and extracellular matrix density (13, 14). Both μa and μs′ provide an understanding of changes in tissue cellularity, metabolic activity, physiology, and host response to cancer. Detection of lesions is based on the functional contrast between normal and diseased tissue in the same patient. However, the physiology of healthy breast tissue is complex, influenced by multiple internal and external factors such as menstrual-cycle phase, menopausal status, exogenous hormones, lactation, and pregnancy. Consequently, to establish a better basis for optical detection and diagnosis based on differential functional contrast, the optical properties of normal breast tissue must be carefully examined and characterized.
There has been increasing attention paid to the study of normal breast tissue optical properties and changes that occur with age, menopausal status, and HRT (15–17). During the reproductive years, the breast is comprised mostly of glandular tissue. With menopause, there is a progressive atrophy of glandular tissue; mitotic activity slows down; and vascular requirements decrease. Some of these changes have been monitored qualitatively by mammography and MRI (3, 18–20). Involution of breast glandular tissue can be impeded by the use of exogenous hormones, such as estrogen and progesterone (21). Presently, up to 20% of U.S. women use HRT to alleviate symptoms of menopause. However, long-term use has been linked with increased risk for breast cancer (22). MRI studies further suggest that fluctuations in endogenous hormones may alter menstrual- cycle patterns and impact breast cancer risk (23–26). In addition, the phase of the menstrual cycle has been shown to influence mammographic accuracy and survival rates after tumor resection (27, 28).
In this article, we provide initial results examining differences in both optical and physiological properties of healthy breast tissue of 14 women. Our results show that the population studied can be well differentiated on the basis of quantitative NIR spectroscopic measurements. Optical contrast is based on physiological changes accompanying menstrual cycle variations, exogenous hormone levels, and menopausal status. We believe this study is particularly important, because standard-of-care screening with x-ray mammography has diminished efficacy in two of the populations we examine, i.e., premenopausal and HRT subjects. The sensitivity of our technique to known biological processes suggests our methods may provide important information complementary to conventional diagnostic techniques, particularly in the case of radiographically dense breast tissue. Ultimately, this technique may enhance our understanding of pathophysiological changes that accompany malignant transformation and provide insight into processes associated with increased disease risk.
Materials and Methods
FDPM Instrument.
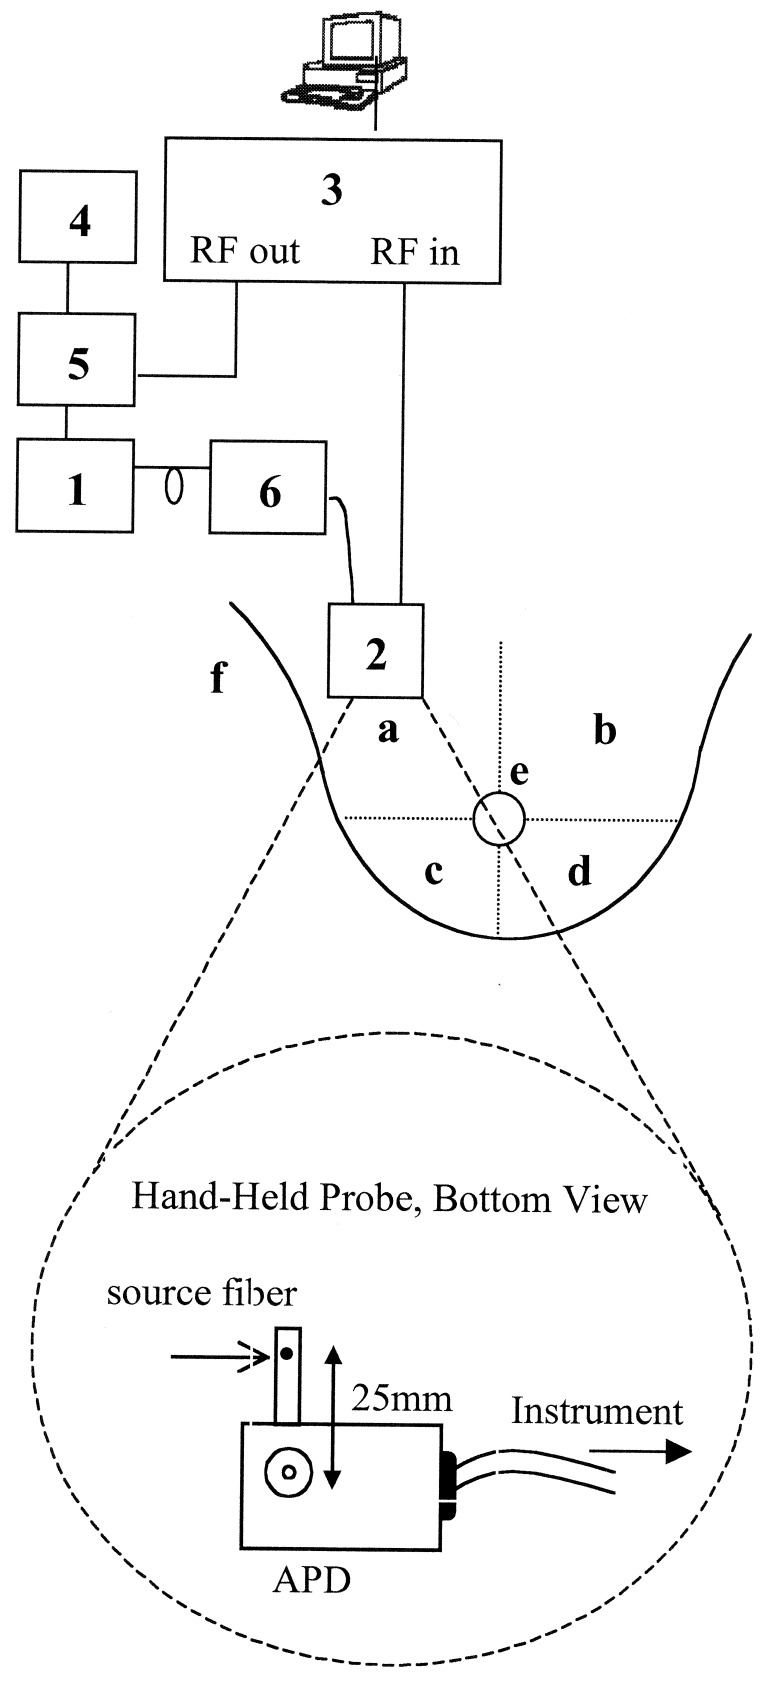
A portable, multiwavelength, high-bandwidth FDPM instrument has been designed and optimized for clinical optical property studies (Fig. 1, quadrant a). The instrument employs multiple diode lasers (box 1) to provide visible and NIR light at six wavelengths (674, 803, 849, 894, 947, and 956 or 980 nm). The FDPM instrument is described in detail by Tromberg et al. (10) and Pham et al. (29). A hand-held probe has been designed to house an avalanche photodiode (APD) that records the diffuse light signals after propagation through the tissue (box 2). This probe has multiple grooves on the casing to position source optical fibers a fixed distance from the APD. A 100-μm-diameter graded index optical fiber positioned 25 mm from the APD detector delivers the diode laser output to the tissue surface. The network analyzer (box 3) measures the phase and amplitude of the electronic signal. A dc source (box 4) is mixed with rf power provided by the network analyzer in a bias network (box 5), which distributes power to each laser diode and produces amplitude modulated light. An optical switch (box 6) delivers light serially from each diode to the tissue. The optical power launched into the subject ranged from 10 to 20 MW for each wavelength.
Figure 1.
Schematic drawing of FDPM instrument, hand-held probe, and measurement map of healthy subjects. The components of the instrument are: diode lasers (box 1), avalanche photodiode (box 2), network analyzer (box 3), DC current source (box 4), bias T (box 5), and optical switch (box 6). See text for detailed description. The breast is divided into four quadrants: upper outer (a), upper inner (b), lower outer (c), and lower inner (d). FDPM measurements are made in each quadrant, on the areolar border (e), and on the glandular tail (f) that extends into the axilla.
Measurement Technique.
Subjects were measured in the supine position. Measurements were made in reflectance geometry by placing the hand-held probe on the skin surface with light pressure. The phase shift and amplitude of the photon density wave was measured at each wavelength for 201 modulation frequencies between 50 MHz and 1,000 MHz at a source-detector separation of 25 mm. The range of modulation frequencies was swept repetitively such that each amplitude and phase value represents up to 12 measurements. Four to six wavelengths were used for the measurements.
Subjects.
A total of 14 subjects was studied: Pre subjects (Pre, premenopausal) 1–6 were premenopausal subjects aged 18 to 33 years. Pre subject 4 (29 years old) was measured during the proliferative phase of her menstrual cycle; Pre subject 1 (27 years old) was measured around ovulation; and Pre subjects 2, 3, and 5 (aged 22, 26, and 32 years, respectively) were measured during the secretory phase. Pre subject 6 (18 years old) was studied at two different points in her menstrual cycle. One measurement was performed near ovulation (day 14) of the subject's regular 28-day cycle, and another measurement was performed during the luteal phase (day 25) of the menstrual cycle. Post subjects (Post, postmenopausal) 1–3 were postmenopausal women aged 57 to 67 years. The remaining five subjects were postmenopausal women 51–60 years of age who were using HRT. HRT subjects 1 and 5 were on combination HRT (progesterone and estrogen), and HRT subjects 2–4 were taking estrogen-only HRT. All HRT subjects have been taking exogenous hormone for at least 2 years. Experiments were conducted in adherence to University of California, Irvine, Institutional Review Board-approved protocols 95-563 and 99-2183. The subjects were healthy with no known breast diseases. After providing informed consent, subjects filled out a brief questionnaire that surveyed pertinent medical history.
When using four wavelengths, the time required for a single measurement was approximately 90 seconds. A total of 12 sites, six per breast, for each subject was measured during subject visits. The measurement map is shown in Fig. 1. Measurements were made in each of the four quadrants, approximately halfway from the center of the breast to the edge of the breast, laterally (a–d). Additional measurements were made on the superior areolar border (e) and the axillary tail (f). Calibration measurements were made approximately every 10 minutes on a tissue phantom of known optical properties.
Model.
The P1 approximation to the Boltzmann transport equation (30) was used to analyze the frequency-domain data and is valid when probing homogeneous turbid media at source-detector separations greater than 1 cm and modulation frequencies less than a few GHz. The model uses an extrapolated boundary condition for a semiinfinite geometry (31). The solution to the P1 approximation relates the frequency-dependent phase and amplitude to the μa and μs′ coefficients (32). To determine the optical properties from a given set of frequency-dependent data, a Marquardt–Levenburg χ2 minimization algorithm was used to fit simultaneously the amplitude A(ω) and phase Φ(ω) by minimizing the difference between the measured values and those predicted by the P1 approximation.
Physiological properties were calculated from the determined μa values assuming principal chromophores in breast tissue for the NIR wavelengths used are Hb, HbO2, and water. The concentrations in tissue of the three components were calculated by using μa at four wavelengths: 674, 803, 849, and 956 or 980 nm. The contribution of each component to the total μa at a given wavelength is represented by the equation 2.303(ɛici) = μai, where ɛi is the extinction coefficient in units of cm2/mol of a particular chromophore at a given wavelength (λ) and ci is the concentration of the chromophore. The total absorption at a given wavelength from the tissue chromophores is
 |
1 |
where the brackets ([ ]) indicate concentration. The matrix representation of the four equations is (11)
 |
2 |
Given that there are more wavelengths than principle chromophores, we have four equations, and three unknowns, and no general solution for ci. The chromophore concentrations are determined by using a least-squares solution to Ec = μa. In matrix representation, the chromophore concentration is given by using c = (ET E)−1 ETμa, where ET and E−1 denote the transpose and inverse of the matrix E, respectively.
Calibration.
A measurement of the phase shift of intensity-modulated light at source wavelength λ propagating through a turbid medium at a given source-detector separation can be expressed as follows:
 |
3 |
To extract Φmedium from Φmeas at a single source-detector separation, Φinstrument must be explicitly evaluated (Eq. 3). Similar arguments can be made for amplitude data (A); however, Amedium is determined by evaluating measured- and instrument-response ratios. The instrument response was calculated by making a measurement on a homogenous phantom with known optical properties. A siloxane phantom cast from flexible silicone (RTV 615/700, General Electric) and titanium diode in a 400-ml mold was used to calibrate the instrument response in phase and amplitude measurements. Optical properties of the phantom were determined by the two-distance technique described by Fantini et al. (33). Reference measurements were made on the phantom at the given source-detector separation during the time of the subject measurement. Calibrations were made at approximately 10-min intervals to account for amplitude drift.
Results and Discussion
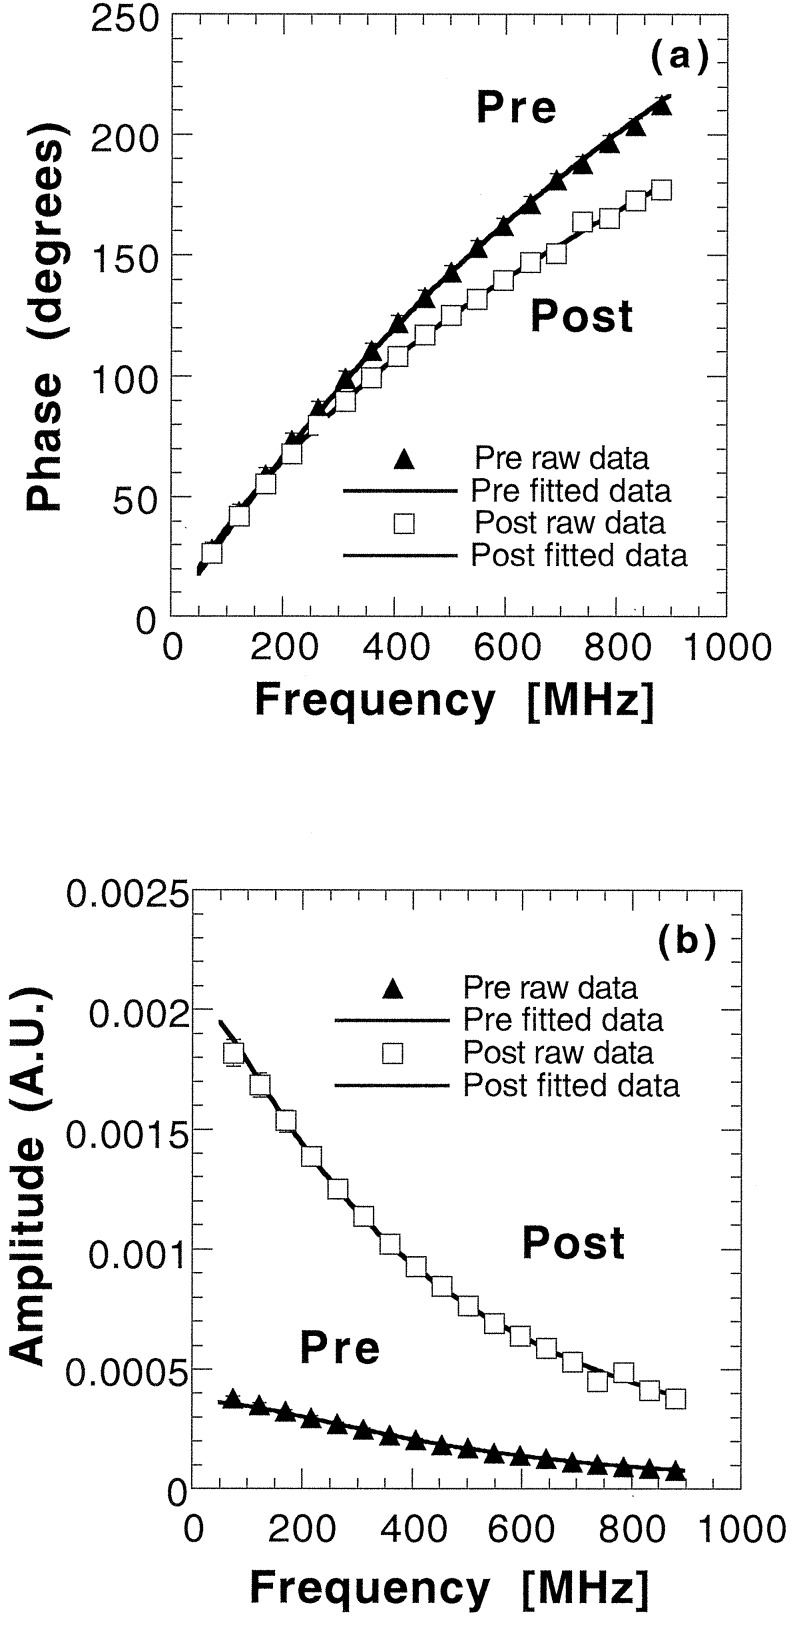
The results of raw data and simultaneous fits to the P1 approximation for Pre subject 1 and Post subject 1 are shown in Fig. 2. Clear differences are detected between the two subjects in both amplitude and phase data.
Figure 2.
FDPM measurements of phase lag (a) and amplitude vs. modulation frequency (b) for Pre 1 and Post 1. Source-detector separation, 2.5 cm; wavelength, 849 nm. Solid lines represent best diffusion-model function fits to phase and amplitude data for each subject. Error bars are on the order of the marker size.
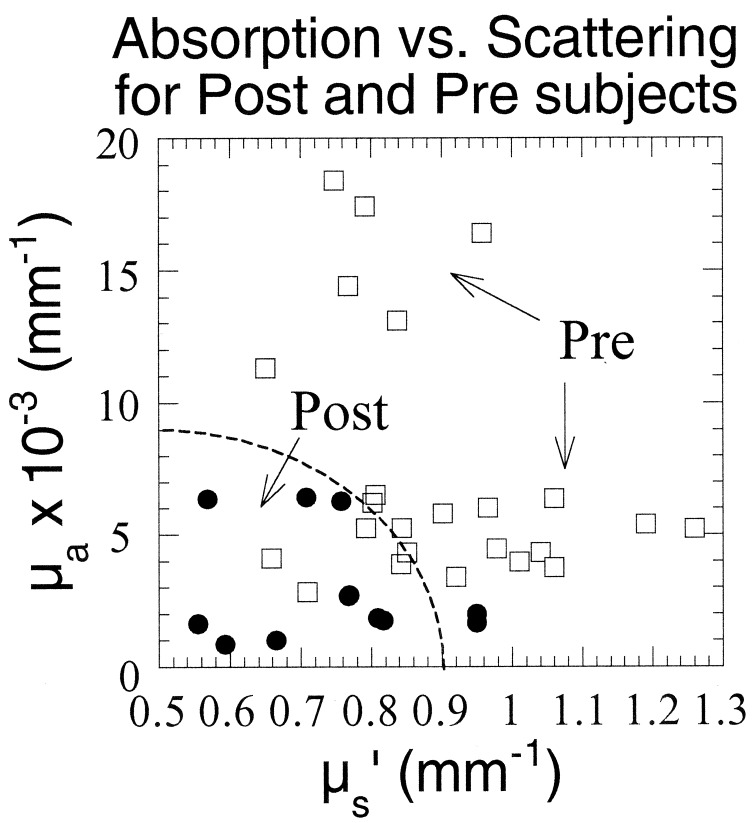
To establish the range of optical property values characteristic of normal menopausal states, we examined nine subjects (six premenopausal) not receiving exogenous hormone therapy. Fig. 3 shows a scatter plot of μa versus μs′ at all four wavelengths for each subject. For comparative purposes, data from the right upper-outer quadrant measurements are shown. Glandular tissue is concentrated in the upper-outer quadrant of the breast, and consequently, more lesions appear in this region than any other (34). Fig. 3 shows that, in general, postmenopausal women have substantially lower μa and μs′ values compared with premenopausal women. Average premenopausal μa values at each wavelength (0.0048–0.015 mm−1) are 2.3- to 3-fold higher than postmenopausal absorption (average μa = 0.0016–0.0064 mm−1). Furthermore, all postmenopausal μa values are less than 0.007 mm−1. Premenopausal women have 16–22% higher scattering values at each wavelength (average μs′ = 0.83–1.1 mm−1) than postmenopausal subjects (average μs′ = 0.67–0.86 mm−1). Because measurement uncertainties are less than 5% of the optical property value (29), these valves constitute significant and dramatic differences between menopausal states.
Figure 3.
μa vs. μs′ for six pre- and three postmenopausal subjects at all wavelengths. Values are calculated from best diffusion-model fits to phase and amplitude data
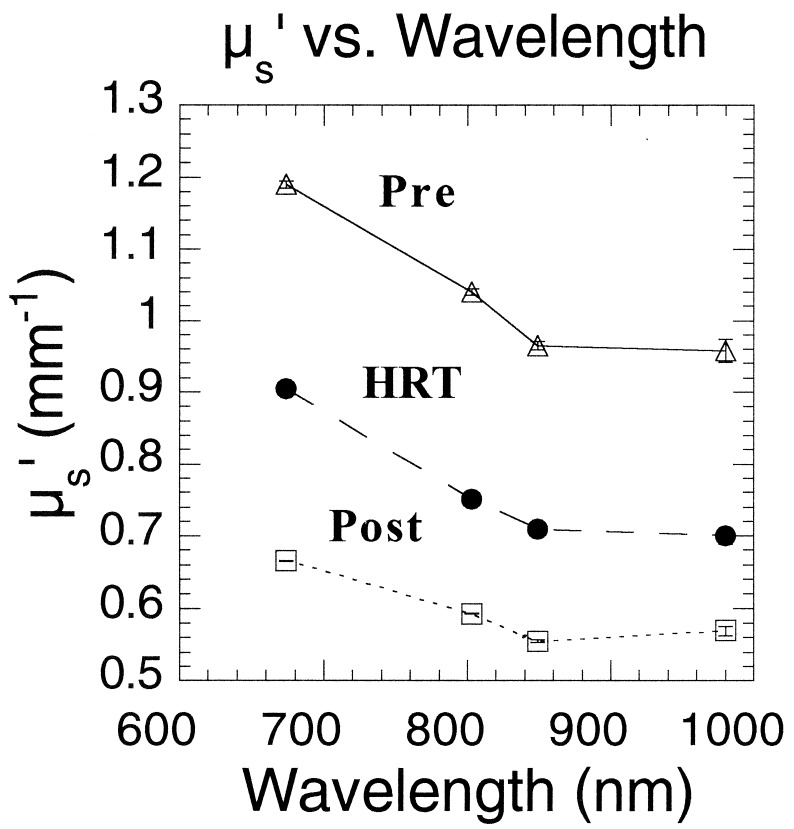
A deeper understanding of the underlying physiological reasons for optical property contrast can be obtained by examining μs′ spectra (i.e., μs′ vs. λ) for three individuals. Results shown in Fig. 4 highlight the impact of estrogen on breast structure. The 29-year-old premenopausal subject displays μs′ values that are consistently greater than the 67-year-old postmenopausal subject's values. Interestingly, μs′ values for the 52-year-old postmenopausal subject receiving estrogen-only HRT fall directly between premenopausal and postmenopausal data. The elevated HRT valves may be caused by the fact that estrogen increases the rate of mitosis within ductal tissue. Thus, optical property differences between HRT and postmenopausal subjects could be a consequence of epithelial tissue proliferation. Scattering contrast between premenopausal and postmenopausal subjects is probably caused by a combined effect of the loss of glandular epithelium as well as extracellular matrix remodeling. The more gradual μs′ vs. λ slope shown for the postmenopausal subjects reflects large particle scattering consistent with a high percentage of fatty parenchyma found in this age group. In younger women, the relatively steep μs′ vs. λ slope is likely to be influenced by the presence of extracellular collagen in addition to cellular/epithelial factors.
Figure 4.
μs′ vs. wavelength for three subjects of varied hormonal and menopausal status. Some values at 980 nm represent values extrapolated from Aλ−B linear regression analysis of the data.
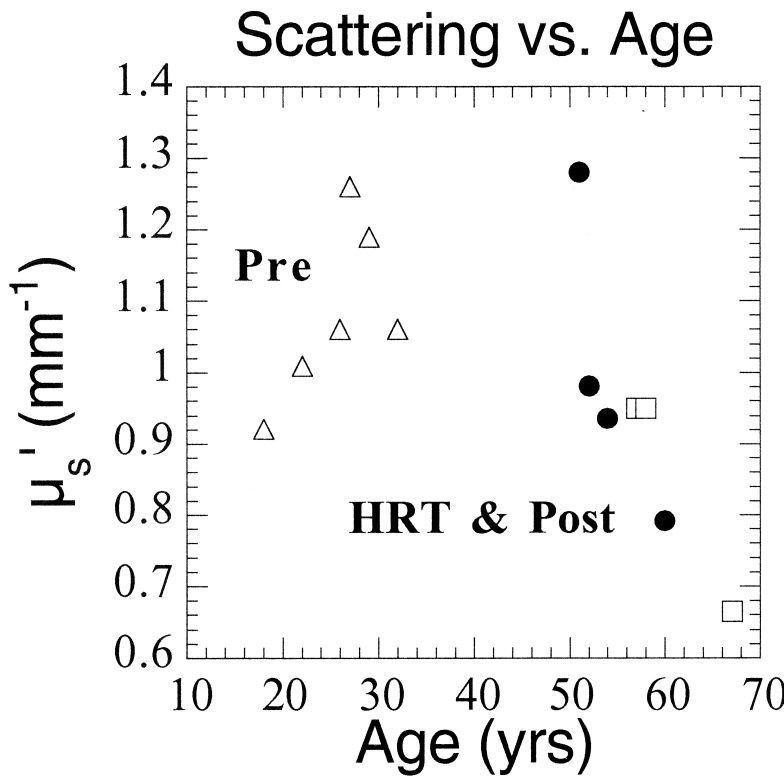
These concepts are substantiated further by Fig. 5, which illustrates an inverse correlation between μs′ and age for subjects over 50. Whether the trend indicating increased scattering for HRT women is caused by exogenous hormone use is not yet clear. Premenopausal μs′ values seem to be independent of age, most likely because of the timing of the measurements. The six premenopausal subjects were measured at different points of their menstrual cycles, which can significantly affect optical properties.
Figure 5.
μs′ at 674 nm vs. age for all subjects. Pre 6 (age 18) is represented as an average of two points corresponding to two separate measurement dates.
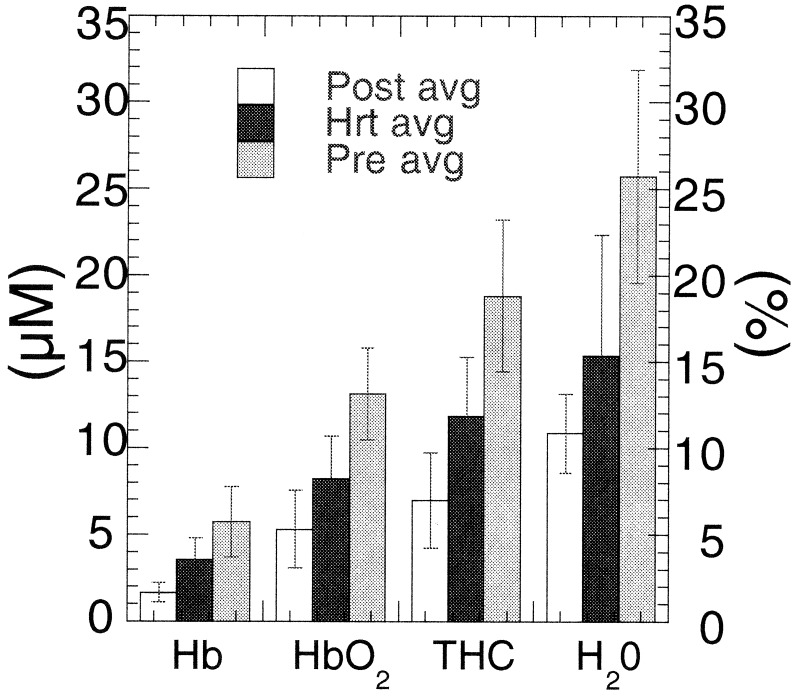
Average tissue hemoglobin concentrations (HbO2, deoxy, and total) and tissue water concentration are shown in Fig. 6. The concentration of blood vessels and blood flow, indicated by total hemoglobin concentration (THC) (THC = [Hb] + [HbO2]), is greatest in premenopausal breast because of the high vascular demands of the tissue. Blood vessel density and blood flow decrease as a result of menopausal involution of glandular tissue. This effect can be detected from the significant total hemoglobin concentration difference between premenopausal and postmenopausal subject groups.
Figure 6.
Mean Hb concentrations [μM, HbO2, deoxy, and total (THC)] and water (H2O) concentration relative to pure water (%) for each subject group. Values are determined from wavelength-dependent absorption values at 674, 803, 849, and 956 or 980 nm. Error bars represent the normalized standard deviation to the mean for six premenopausal, five HRT, and three postmenopausal subjects. Confidence values are ≈99% for Hb, HbO2, THC, and H2O.
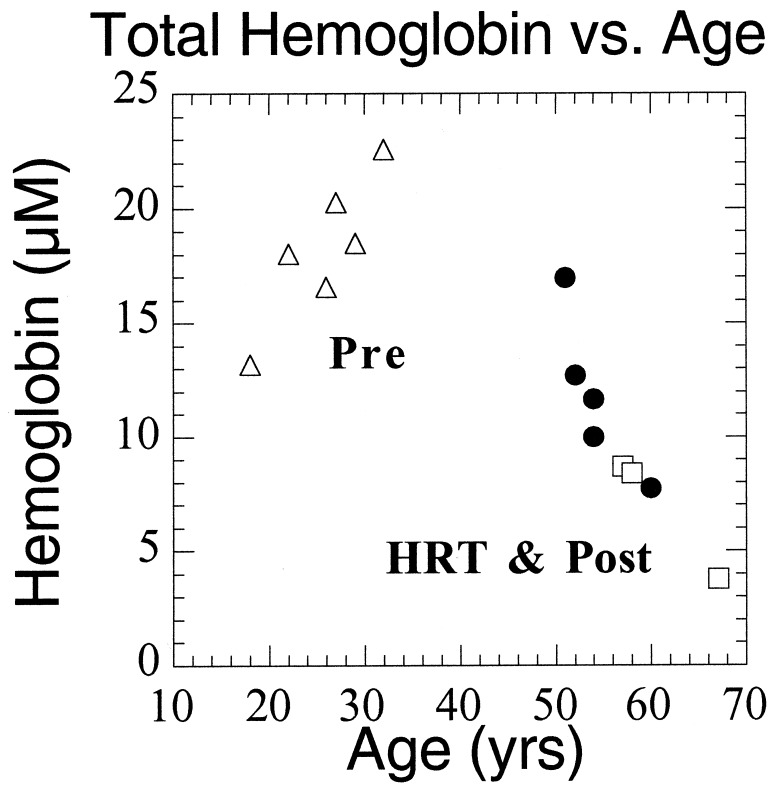
Women using HRT exhibit Hb concentration values that are intermediate between premenopausal and postmenopausal subjects. Thus, FDPM measurements may be sensitive to subtle HRT effects, including elevations in blood flow, fibroglandular volume, and epithelial cell proliferation (35–38). The general decrease in total Hb concentration with age after 50 (Fig. 7) suggests that it is difficult to determine from limited existing data whether the measured HRT Hb effect is real or simply a consequence of age-related optical property changes.
Figure 7.
Total Hb concentration vs. age for all subjects. Pre 6 (age 18) is represented as an average of two points corresponding to two separate measurement dates.
Fig. 6 data show that the average water concentration for premenopausal women (26 ± 6%) is more than a factor of two greater than the mean tissue water concentration for postmenopausal women (11 ± 2%). These differences reflect the high water content of epithelial connective-tissue compartments in premenopausal tissue, whereas the postmenopausal breast is dominated by low water-content adipose. Water concentration in HRT subjects is slightly greater than the postmenopausal group's concentration (15 ± 7%). Differences may be caused by hormone-induced accumulation of fluids, a commonly occurring side effect from HRT (38).
Investigating positional variations in optical properties between pre- (Pre 1) and postmenopausal (Post 1) subjects reveals a higher degree of variation in scattering for post- (≈8% for all wavelengths) vs. premenopausal women (≈4%). These values were calculated by normalizing the standard deviation of the values from measurements in each of the four quadrants (n = 4) to the mean (data not shown). This difference may represent the nonuniform glandular involution of breast tissue that accompanies menopause and results in palpable differences in density in the breast tissue of postmenopausal subjects (39). The positional variation in the μa is greater for wavelengths corresponding to hemoglobin absorption (674–849 nm) for the postmenopausal subjects (23–33% vs. 17–20% for Pre). However, wavelengths corresponding to fat and water concentrations (894, 947, and 956 nm) show a higher variability in premenopausal (13–16%) vs. only 7–8% in postmenopausal subjects.
Figs. 3–7 strongly suggest that physiological changes caused by hormonal fluctuations that occur over a period of many years can be detected and quantified. Previous studies (40) show these effects also are detectable within the menstrual cycle of premenopausal women. To test FDPM sensitivity to menstrual-cycle variations, we examined a premenopausal subject during ovulation and before the onset of menses. Table 1 data summarizing these results show that μa and μs′ are higher for the latter part of the cycle (Day 25) than in mid-cycle (Day 14). Absorption differences correspond to the calculated physiological properties. Our results show a 48.3% increase in Hb and 28.1% increase in water concentration during the luteal phase, changes that are consistent with the physiological effects caused by ovarian hormone fluctuations during the menstrual cycle. After ovulation, blood flow to the breast can increase by up to 50%; there is an increase in breast volume; and parenchymal water content changes by an average of 25% during the latter half cycle (24, 25). Changes in scattering were 3–5% and not statistically significant.
Table 1.
Variation in physiological properties during the menstrual cycle
| Parameter | Day 14 | Day 25 |
|---|---|---|
| Hb, μM | 3.07 ± 0.04 | 4.72 ± 0.05 |
| HbO2, μM | 7.56 ± 0.04 | 11.04 ± 0.06 |
| Total Hb, μM | 10.63 ± 0.05 | 15.76 ± 0.08 |
| StO2, % | 71.12 ± 0.53 | 70.06 ± 0.53 |
| Water, % | 16.49 ± 0.11 | 21.12 ± 0.15 |
Calculated physiological properties, Hb concentration (μM, HbO2, deoxy-, and total Hb), blood oxygen saturation (StO2), and water concentration relative to pure water (%) for a premenopausal subject at Days 14 and 25 of a 28-day menstrual cycle.
Conclusions
A hand-held photon migration probe has been developed that can detect significant differences in absorption and scattering properties occurring with changes in age and menstrual-cycle phase. The sensitivity of quantitative NIR spectroscopy to breast biology is unique among radiological methods. Consequently, optical techniques may eventually provide a practical, noninvasive means for enhancing the accuracy of tumor diagnostics in premenopausal and perimenopausal subjects and for increasing our understanding breast pathophysiology.
Acknowledgments
A.E.C., R.H., and C.E. acknowledge support from the U.S. Army Medical Research and Material Command (DAMD17-98-1-8186), the Swiss National Science Foundation, and the American Cancer Society, respectively. This work was supported by the National Institutes of Health Laser Microbeam and Medical Program (RR-01192), the National Institutes of Health (GM-50958), the Avon Foundation, the Chao Family Comprehensive Cancer Center (CA-62203), and the Department of Energy (DOE DE-FG03-91ER61227).
Abbreviations
- FDPM
frequency-domain photon migration
- HRT
hormone replacement therapy
- μa
absorption coefficient
- μs′
reduced scattering coefficient
- Hb
deoxyhemoglobin
- HbO2
oxyhemoglobin
- NIR
near infrared
- Pren
premenopausal subject n
- Postn
postmenopausal subject n
Footnotes
This paper was submitted directly (Track II) to the PNAS office.
References
- 1.Kerlikowske K, Barclay J. J Natl Cancer Inst Monogr. 1997;22:105–110. doi: 10.1093/jncimono/1997.22.105. [DOI] [PubMed] [Google Scholar]
- 2.Elmore J G, Barton M B, Moceri V M, Polk S, Arena P J, Fletcher S W. N Engl J Med. 1998;338:1089–1096. doi: 10.1056/NEJM199804163381601. [DOI] [PubMed] [Google Scholar]
- 3.Hindle W H, Davis L, Wright D. Am J Obstet Gynecol. 1999;180:1484–1490. doi: 10.1016/s0002-9378(99)70043-8. [DOI] [PubMed] [Google Scholar]
- 4.Baines C J, Dayan R. J Natl Cancer Inst. 1999;91:833–838. doi: 10.1093/jnci/91.10.833. [DOI] [PubMed] [Google Scholar]
- 5.Laya M B, Larson E B, Taplin S H, White E. J Natl Cancer Inst. 1996;88:643–649. doi: 10.1093/jnci/88.10.643. [DOI] [PubMed] [Google Scholar]
- 6.Litherland J C, Stallard S, Hole D, Cordiner C. Clin Radiol. 1999;54:285–288. doi: 10.1016/s0009-9260(99)90555-x. [DOI] [PubMed] [Google Scholar]
- 7.Fletcher S W. J Natl Cancer Inst Monogr. 1997;22:5–9. doi: 10.1093/jncimono/1997.22.5. [DOI] [PubMed] [Google Scholar]
- 8.Fantini S, Walker S A, Franceschini M A, Kaschke M, Sclag P M, Moesta T K. Appl Opt. 1998;37:1982–1989. doi: 10.1364/ao.37.001982. [DOI] [PubMed] [Google Scholar]
- 9.Franceschini M A, Moesta K T, Fantini S, Gaida G, Gratton E, Jess H, Mantulin W W, Seeber M, Schlag P M, Kaschke M. Proc Natl Acad Sci USA. 1997;94:6468–6473. doi: 10.1073/pnas.94.12.6468. [DOI] [PMC free article] [PubMed] [Google Scholar]
- 10.Tromberg B J, Coquoz O, Fishkin J B, Pham T, Anderson E R, Butler J, Cahn M, Gross J D, Venugopalan V, Pham D. Philos Trans R Soc London B. 1997;352:661–668. doi: 10.1098/rstb.1997.0047. [DOI] [PMC free article] [PubMed] [Google Scholar]
- 11.Cope M. Ph.D. thesis. University of London; 1991. [Google Scholar]
- 12.Sevick E, M, Chance B, Leigh J, Nioka S. Anal Biochem. 1991;195:330–351. doi: 10.1016/0003-2697(91)90339-u. [DOI] [PubMed] [Google Scholar]
- 13.Beauvoit B, Kitai T, Chance B. Biophys J. 1994;67:2501–2510. doi: 10.1016/S0006-3495(94)80740-4. [DOI] [PMC free article] [PubMed] [Google Scholar]
- 14.Thomsen S, Tatman D. Ann NY Acad Sci. 1998;838:171–193. doi: 10.1111/j.1749-6632.1998.tb08197.x. [DOI] [PubMed] [Google Scholar]
- 15.Suzuki K, Yamashita Y, Ohta K, Chance B. Invest Radiol. 1994;29:410–414. doi: 10.1097/00004424-199404000-00003. [DOI] [PubMed] [Google Scholar]
- 16.Suzuki K, Yamashita Y, Ohta K, Kaneko M, Yoshida M, Chance B. J Biomed Opt. 1996;1:330–334. doi: 10.1117/12.239902. [DOI] [PubMed] [Google Scholar]
- 17.Cubeddu R, Pifferi A, Taroni P, Toricelli A, Valentini G. Appl Phys Lett. 1999;74:874–876. [Google Scholar]
- 18.Brisson J, Morrison A S, Khalid N. J Natl Cancer Inst. 1998;80:1534–1540. doi: 10.1093/jnci/80.19.1534. [DOI] [PubMed] [Google Scholar]
- 19.Boyd N F, Greenberg C, Lockwood G, Little L, Martin L, Byng J, Yaffe M, Tritchler D. J Natl Cancer Inst. 1997;89:488–496. doi: 10.1093/jnci/89.7.488. [DOI] [PubMed] [Google Scholar]
- 20.Lee N A, Rusinek H, Weinreb J, Chandra R, Toth H, Singer C, Newstead G. Am J Roentgenol. 1997;168:501–506. doi: 10.2214/ajr.168.2.9016235. [DOI] [PubMed] [Google Scholar]
- 21.Kaufman Z, Garstin W I H, Hayes R, Michell M J. Clin Radiol. 1991;43:385–388. doi: 10.1016/s0009-9260(05)80565-3. [DOI] [PubMed] [Google Scholar]
- 22.Colditz G A. Ann NY Acad Sci. 1997;833:129–136. doi: 10.1111/j.1749-6632.1997.tb48598.x. [DOI] [PubMed] [Google Scholar]
- 23.Drife J O. Int J Gynecol Obstet Suppl. 1989;1:19–24. [PubMed] [Google Scholar]
- 24.Fowler P A, Casey C E, Cameron G G, Foster M A, Knight C H. Br J Obstet Gynaecol. 1990;97:595–602. doi: 10.1111/j.1471-0528.1990.tb02546.x. [DOI] [PubMed] [Google Scholar]
- 25.Graham S J, Stanchev P L, Lloydsmith J O A, Bronskill M J, Plewes D B. J Magn Reson. 1995;5:695–701. doi: 10.1002/jmri.1880050613. [DOI] [PubMed] [Google Scholar]
- 26.Whelan E A, Sandler D P, Root J L, Smith K R, Weinberg C R. Am J Epidemiol. 1994;140:1081–1090. doi: 10.1093/oxfordjournals.aje.a117208. [DOI] [PubMed] [Google Scholar]
- 27.White E, Velentgas P, Mandelson M T, Lehman C D. J Natl Cancer Inst. 1998;90:906–910. doi: 10.1093/jnci/90.12.906. [DOI] [PubMed] [Google Scholar]
- 28.Hrushesky W J M. J Surg Oncol. 1993;53:1–3. doi: 10.1002/jso.2930530103. [DOI] [PubMed] [Google Scholar]
- 29.Pham T H, Coquoz O, Fishkin J B, Anderson E, Tromberg B J. Rev Sci Instrum. 2000;71:2500–2513. [Google Scholar]
- 30.Fishkin J B, Fantini S, Vandeven M J, Gratton E. Phys Rev E Stat Phys Plasmas Fluids Relat Interdiscip Top. 1996;53:2307–2319. doi: 10.1103/physreve.53.2307. [DOI] [PubMed] [Google Scholar]
- 31.Haskell R C, Svaasand L O, Tsay T T, Feng T C, McAdams M S, Tromberg B J. J Opt Soc Am A. 1994;11:2727–2741. doi: 10.1364/josaa.11.002727. [DOI] [PubMed] [Google Scholar]
- 32.Fishkin J B, Gratton E. J Opt Soc Am A. 1993;10:127–140. doi: 10.1364/josaa.10.000127. [DOI] [PubMed] [Google Scholar]
- 33.Fantini S, Franceschini M A, Gratton E. J Opt Soc Am B. 1994;11:2128–2138. [Google Scholar]
- 34.Reichart C M, Moshiri S, Austin R M, Norris H J. In: Diagnosis and Management of Breast Cancer. Lippman M E, Lichter A S, Danforth D N Jr, editors. Philadelphia: Saunders; 1988. pp. 22–26. [Google Scholar]
- 35.Bourne T, Hillard T C, Whitehead M I, Crook D, Campbell S. Lancet. 1990;335:1470–1471. doi: 10.1016/0140-6736(90)91505-5. [DOI] [PubMed] [Google Scholar]
- 36.Pines A, Fisman E Z, Levo Y, Averbuch M, Lidor A, Drory Y, Finkelstein A, Hetman-Peri M, Moshkowitz M, Ben-Ari E, Ayalon D. Am J Obstet Gynecol. 1991;164:806–812. doi: 10.1016/0002-9378(91)90520-2. [DOI] [PubMed] [Google Scholar]
- 37.Berkowitz J E, Gatewood O M, Goldblum L E, Gayler B W. Radiology (Easton, Pa) 1990;174:199–201. doi: 10.1148/radiology.174.1.2152982. [DOI] [PubMed] [Google Scholar]
- 38.Key T J A. Mutat Res. 1995;333:59–67. doi: 10.1016/0027-5107(95)00132-8. [DOI] [PubMed] [Google Scholar]
- 39.Wren B G. Baillieres Clin Obstet Gynaecol. 1996;10:433–447. doi: 10.1016/s0950-3552(96)80024-1. [DOI] [PubMed] [Google Scholar]
- 40.Cubeddu R, D'Andreal C, Pifferi A, Taroni P, Torricelli A, Valentino G. Photochem Photobiol. 2000;72:383–391. [PubMed] [Google Scholar]


