Abstract
Obesity is a major risk factor for the development of insulin resistance and type 2 diabetes. Adipose tissue secretes various bioactive molecules, referred to as adipokines, whose dysregulation can mediate changes in glucose homeostasis and inflammatory responses. Here, we identify C1qdc2/CTRP12 as an insulin-sensitizing adipokine that is abundantly expressed by fat tissues and designate this adipokine as adipolin (adipose-derived insulin-sensitizing factor). Adipolin expression in adipose tissue and plasma was reduced in rodent models of obesity. Adipolin expression was also decreased in cultured 3T3-L1 adipocytes by treatment with inducers of endoplasmic reticulum stress and inflammation. Systemic administration of adipolin ameliorated glucose intolerance and insulin resistance in diet-induced obese mice. Adipolin administration also reduced macrophage accumulation and proinflammatory gene expression in the adipose tissue of obese mice. Conditioned medium from adipolin-expressing cells diminished the expression of proinflammatory cytokines in response to stimulation with LPS or TNFα in cultured macrophages. These data suggest that adipolin functions as an anti-inflammatory adipokine that exerts beneficial actions on glucose metabolism. Therefore, adipolin represents a new target molecule for the treatment of insulin resistance and diabetes.
Keywords: Adipokines, Adipose Tissue, Glucose Metabolism, Inflammation, Obesity, Adipolin
Introduction
Obesity is a major health problem that is causally linked to the development of chronic inflammation and various metabolic disorders, including insulin resistance and type 2 diabetes (1, 2). In addition to long-term fuel storage, adipose tissue functions as a secretory organ, producing a variety of bioactive substances that are referred to as adipokines (3–5). Most of these adipokines, including TNFα, MCP-1 (monocyte chemotactic protein 1), resistin, and leptin, are up-regulated in obese states, and these factors generally function to promote inflammation and metabolic dysfunction (3). On the other hand, there are a small number of adipokines that are anti-inflammatory and protective against the development of obesity-linked disorders (4). For example, we have shown that adiponectin is down-regulated in patients with obesity-linked metabolic and cardiovascular diseases and that adiponectin has anti-inflammatory properties that protect against insulin resistance and cardiovascular diseases (6–10). More recently, we have demonstrated that Sfrp5 functions as an anti-inflammatory adipokine that ameliorates obesity-induced metabolic dysfunction (11). Thus, it is conceivable that dysregulation of these adipokines, due to excess adiposity, contributes to the pathogenesis of various metabolic and cardiovascular complications that are associated with obesity.
We have sought to identify novel adipokines by microarray analysis of gene expression profiles of epididymal adipose tissues in lean versus diet-induced obese mice (11, 12). Transcripts down-regulated in fat tissues of obese mice were evaluated for the presence of a signal peptide and the absence of a transmembrane domain in their open reading frames (13). In this study, we focused on C1qdc2 (C1q domain-containing protein 2)/CTRP12 (C1q/TNF-related protein 12) as an adipokine candidate and designated this factor as adipolin (adipose-derived insulin-sensitizing factor) to indicate its apparent function. Although the adipolin/C1qdc2/CTRP12 cDNA has been reported in the GenBankTM Data Bank (accession number DQ002404) and it belongs to the CTRP family, nothing is known about the regulation or functional significance of this factor. Here, we show that adipolin is abundantly expressed in white adipose tissues and that this expression is down-regulated in the fat of obese animals. We also demonstrate that increasing adipolin expression ameliorates adipose tissue inflammation and promotes glucose clearance in obese mice.
EXPERIMENTAL PROCEDURES
Materials
Palmitic acid, tunicamycin, TNFα, and LPS were purchased from Sigma. The polyclonal antibody against mouse adipolin was generated by immunizing rabbits with two synthetic peptides conjugated to keyhole limpet hemocyanin through Cys (RQELKKSRQLFARVDSP (amino acid residues 22–38) and TSNREGFPGSVKPPEAS (amino acid residues 42–58); Medical & Biological Laboratories Co., Ltd.).
Cloning of Mouse Adipolin
Full-length mouse adipolin cDNA (GenBankTM accession number NM_026125.2) was obtained by PCR using cDNA produced from RNA that was isolated from mouse epididymal adipose tissue and then subcloned into the pShuttle mammalian cell expression vector (Qbiogene, Inc.), which expresses adipolin as a fusion with a FLAG epitope at the C terminus. The pShuttle vector expressing adipolin was transfected into COS-7 cells using Lipofectamine 2000 (Invitrogen). After cells were incubated for 48 h, the cell lysates and medium were collected. Cells transfected with empty vectors (mock) were used as a negative control.
Animal Model
Control (normal diet, CLEA CE-2, 4.8% fat, wild-type mice), high-fat diet (HFD)3-induced obese (DIO), and ob/ob mice in a C57BL6/J background were purchased from Charles River Laboratories. For HFD feeding (D12492, 60% fat; Research Diets, Inc.,), mice at 4 weeks of age were maintained on a HFD for the indicated length of weeks. Zucker diabetic fatty rats and their lean littermates were purchased from Charles River Laboratories. Study protocols were approved by the Institutional Animal Care and Use Committees at Boston University and Nagoya University.
Isolation of Mouse Adipocytes and Stromal Vascular Fractions
Epididymal fat tissues from male wild-type C57BL6/J mice fed a normal diet were excised and minced in PBS, followed by digestion with 1 mg/ml collagenase type 2 (Sigma) for 30 min (14). The digested fat tissue was filtered through a mesh and centrifuged at 1000 rpm for 5 min to separate floating adipocytes from the stromal vascular fraction pellet.
Cell Culture
Mouse 3T3-L1 cells (American Type Culture Collection) were maintained in DMEM with 10% FBS and differentiated into adipocytes by treatment with DMEM supplemented with 5 μg/ml insulin, 0.5 mm 1-methyl-3-isobutylxanthine, and 1 μm dexamethasone (15). At day 7 after differentiation, 3T3-L1 adipocytes were treated with palmitic acid, tunicamycin, TNFα, or vehicle for 24 h. Peritoneal macrophages from lean wild-type C57BL6/J mice were maintained in DMEM supplemented 10% FBS and incubated in conditioned medium from COS-7 cells transduced with adenoviral vectors for 18 h, followed by stimulation with LPS (100 ng/ml), TNFα (50 ng/ml), or vehicle for 6 h.
Western Blot Analysis
Cell and blood samples were prepared, and equal amounts of proteins or plasma (0.2 μl) were separated by denaturing SDS-PAGE. Following transfer to membranes, immunoblot analysis was performed with the indicated antibodies, followed by incubation with horseradish peroxidase-conjugated secondary antibody. An ECL Plus Western blotting detection kit (GE Healthcare) was used for detection. Relative protein levels were quantified using the Image J program.
Construction of Adenoviral Vectors
The adenoviral (Ad) vectors expressing β-galactosidase (Ad-β-gal) or FLAG-tagged adipolin (Ad-adipolin) were constructed under the control of the CMV promoter (13, 16). For in vivo gene transfer, Ad-adipolin or Ad-β-gal (5.0 × 10⁸ plaque-forming units, total) was injected into the jugular veins of the mice. For in vitro transduction, COS-7 cells were transduced with Ad-β-gal or Ad-adipolin at a multiplicity of infection of 100 for 24 h. The medium was then replaced with fresh DMEM, and cells were incubated for an additional 24 h. For addition of conditioned medium from COS-7 cells to macrophages, the media protein was concentrated 4-fold with a Microcon column.
Metabolic Measurements
Serum glucose, free fatty acid, and triglyceride levels were measured with enzymatic kits (Wako Chemicals). Glucose tolerance testing was performed on 16-h fasted mice injected intraperitoneally with d-glucose (1 g/kg of body weight) (11, 12). Blood glucose levels were determined immediately before and 30, 60, 90, and 120 min after injection using a Glutest glucose meter (Sanwa Kagaku Kenkyusho Co., Ltd.). Insulin tolerance testing was performed on 6-h fasted mice injected intraperitoneally with human insulin (Sigma) at 0.75 units/kg of body weight (11, 12). Blood glucose levels were determined immediately before and 15, 30, and 60 min after injection.
Histology
The sections of epididymal adipose tissue were fixed in 10% formalin, dehydrated, and embedded in paraffin. Adipose tissue sections were stained with hematoxylin and eosin to assess morphology and with anti-F4/80 antibody (Santa Cruz Biotechnology) to detect macrophages (11). The cross-sectional areas of adipocytes were determined in 200 cells per mouse using the Image J program. Macrophage accumulation was quantified by measuring the number of F4/80-positive cells/mm2 in 20 randomly chosen microscopic fields.
Quantification of mRNA Levels
Gene expression levels were quantified by real-time PCR. Total RNA was prepared using a Qiagen kit. cDNA was produced using a SuperScript RT-PCR system (Invitrogen). PCR was performed with a Bio-Rad real-time PCR detection system using SYBR Green I as a double-standard DNA-specific dye as described previously (17). The primers used were 5′-CGATTGTGGATTGAGGAA-3′ and 5′-GTTTGGAGTTCTTTATTGCTAT-3′ for mouse adipolin, 5′-CATCTTCTCAAAATTCGAGTGACAA-3′ and 5′-TGGGAGTAGACAAGGTACAACCC-3′ for mouse TNFα, 5′-CCACTCACCTGCTGCTACTCAT-3′ and 5′-TGGTGATCCTCTTGTAGCTCTCC-3′ for mouse MCP-1, 5′-AAACGGTTTGTCTTCAAC-3′ and 5′-ATGGTGAAGTCAATTATGTC-3′ for mouse IL-1β, 5′-GCTCCAAGCAGATGCAGCA-3′ and 5′-CCGGATGTGAGGCAGCAG-3′ for mouse 36B4, 5′-AATCAAGAACGAAAGTCGGAGG-3′ and 5′-GCGGGTCATGGGAATAACG-3′ for 18S rRNA, and 5′-GGGTCTTCACCGTGCAGGTT-3′ and 5′-CGGAGAAGCTGGAGCCGTTC-3′ for rat adipolin.
Statistical Analysis
All data are expressed as means ± S.E. Differences were analyzed by Student's unpaired t test, one-way analysis of variance, or two-way repeated measures analysis of variance. A p value of <0.05 was accepted as statistically significant.
RESULTS
Expression of the Secreted Protein Adipolin Is Reduced in Obese States
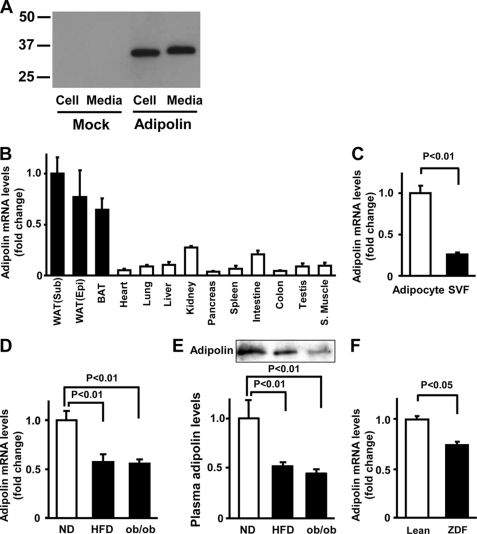
To examine whether adipolin is secreted from cultured cells, COS-7 cells were transfected with pShuttle vectors expressing mouse adipolin or mock-transfected, and Western blot analysis was performed with an anti-adipolin antibody. Adipolin protein was detected in both the cell lysate and medium from the cells expressing mouse adipolin (Fig. 1A), indicating that adipolin can be secreted from cells.
FIGURE 1.
Expression of adipolin in white adipose tissue in vivo. A, expression of adipolin in the medium and cell lysates from COS-7 cells. COS-7 cells were transfected with vectors expressing FLAG-tagged adipolin cDNA or mock-transfected, followed by incubation in serum-free medium. Adipolin protein levels in the medium and cell pellets were determined by Western blot analysis. B, tissue distribution of adipolin mRNA in wild-type mice fed a normal diet. Adipolin mRNA levels were determined by quantitative real-time PCR and are expressed relative to 36B4 levels (mean ± S.E., n = 3). WAT, white adipose tissue; Sub, subcutaneous; Epi, epididymal; BAT, brown adipose tissue; S. Muscle, skeletal muscle. C, adipolin transcript levels in adipocytes and stromal vascular fractions (SVF) isolated from white adipose tissues of lean wild-type mice fed a normal diet. Adipolin transcript levels were determined by quantitative real-time PCR analysis and are expressed relative to 36B4 levels (mean ± S.E., n = 3). D and E, adipolin levels in epididymal fat tissue (D) and plasma (E) in lean and obese mice. Wild-type mice at 4 weeks of age were maintained on a normal diet (ND) or a HFD for 10 weeks. We measured adipose adipolin levels in wild-type mice fed a normal diet or a HFD and age-matched ob/ob mice by quantitative real-time PCR analysis and expressed them relative to 36B4 levels. Plasma adipolin levels (0.2 μl) were determined by Western blot analysis. Results are expressed relative to the values compared with the normal diet control (mean ± S.E., n = 4–5). F, expression of adipolin in epididymal fat tissue of obese Zucker diabetic fatty (ZDF) rats and lean littermates at 12 weeks of age. Adipolin transcript levels were measured by quantitative real-time PCR analysis and are expressed relative to 18S rRNA levels (mean ± S.E., n = 3).
We next assessed adipolin transcript expression in various tissues of C57BL6/J mice by real-time PCR methods. Adipolin mRNA was expressed in many of the tissues examined, but the levels were highest in subcutaneous and epididymal white adipose tissues and brown adipose tissue (Fig. 1B). Fractionation of white adipose tissue revealed that adipolin expression was observed in adipocytes rather than the stromal vascular fraction (Fig. 1C).
To test whether obese states affect expression of adipolin in fat tissue, we assessed its expression in animal models of obesity. Adipolin mRNA expression was lower in adipose tissue of DIO mice than in that of lean wild-type mice fed a normal diet (Fig. 1D). Similarly, obese leptin-deficient (ob/ob) mice showed a decrease in adipolin expression in epididymal fat tissue compared with lean wild-type mice. The plasma levels of adipolin were significantly lower in DIO and ob/ob mice than in normal diet-fed wild-type mice (Fig. 1E). Furthermore, adipolin expression in adipose tissue was reduced in obese Zucker diabetic fatty rats compared with lean rats (Fig. 1F).
Regulation of Adipolin Expression in Adipocytes
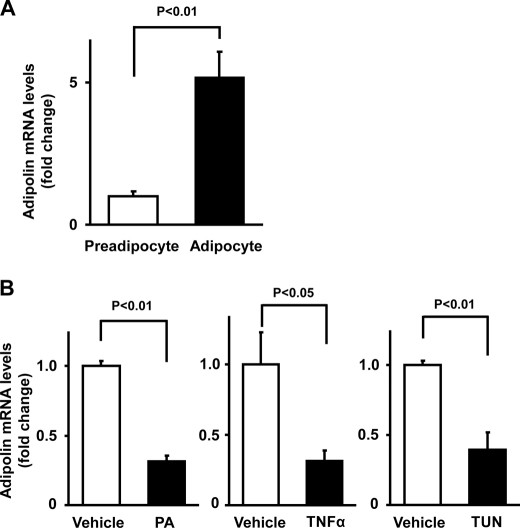
Adipolin expression was also assessed in cultured 3T3-L1 adipocytes. Adipolin mRNA expression was markedly up-regulated upon 3T3-L1 adipocyte differentiation (Fig. 2A). Because obesity is associated with elevated long-chain saturated fatty acid exposure, inflammation, and increased endoplasmic reticulum stress in adipose tissue (18–20), adipolin expression was assessed in 3T3-L1 adipocytes treated with agents that mimic these stresses. Adipolin transcript levels were significantly reduced by treatment with palmitic acid, TNFα, or tunicamycin, an inducer of endoplasmic reticulum stress (Fig. 2B). These data indicate that adipolin expression in adipocytes is negatively regulated by stresses associated with obesity-induced states.
FIGURE 2.
Expression of adipolin in cultured adipocytes in vitro. A, adipolin mRNA expression in 3T3-L1 preadipocytes and differentiated adipocytes. Adipolin mRNA levels in 3T3-L1 preadipocytes and adipocytes at day 8 after differentiation were determined by quantitative real-time PCR and are expressed relative to 18S rRNA levels (mean ± S.E., n = 4). B, regulation of adipolin expression in cultured adipocytes. Differentiated 3T3-L1 adipocytes were treated with palmitic acid (PA; 250 μm), TNFα (10 ng/ml), tunicamycin (TUN; 5 μg/ml), or vehicle for 24 h. Adipolin mRNA levels were assessed by quantitative real-time PCR and are expressed relative to 36B4 levels (mean ± S.E., n = 3–4).
Systemic Delivery of Adipolin Improves Glucose Tolerance
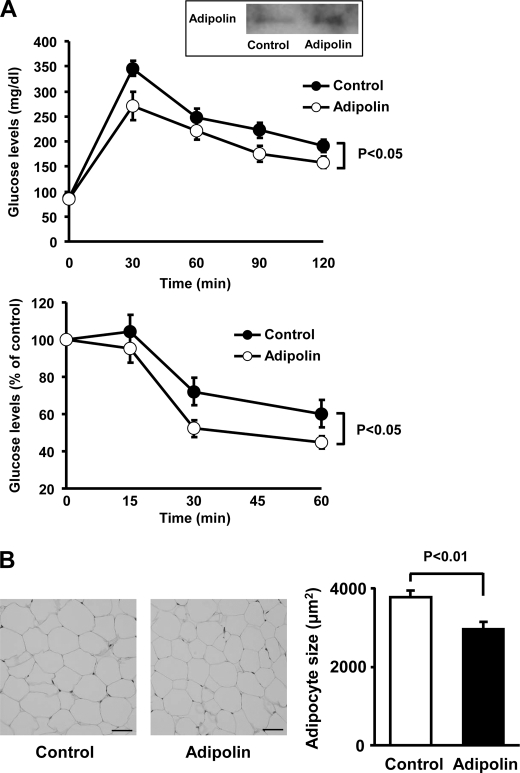
To investigate whether adipolin modulates obesity-inducible metabolism in vivo, we systemically administered Ad-adipolin or Ad-β-gal (as a control) to DIO mice. Delivery of Ad-adipolin resulted in a 2-fold increase in plasma adipolin levels compared with Ad-β-gal (Fig. 3A). DIO mice treated with Ad-adipolin displayed significant improvements in glucose clearance in glucose and insulin tolerance tests compared with DIO mice treated with the control vector (Fig. 3A). Ad-adipolin-treated mice had a small but significant reduction in body weight compared with control mice (Ad-adipolin, 33.0 ± 0.7 g, and control, 34.9 ± 0.5 g; p < 0.05), but food intake levels were similar between the two groups (data not shown). No significant differences in the serum levels of free fatty acids (Ad-adipolin, 0.96 ± 0.08 meq/liter, and control, 1.13 ± 0.13 meq/liter; not significant) or triglyceride (Ad-adipolin, 67.9 ± 5.1 mg/dl, and control, 76.0 ± 7.1 mg/dl; not significant) were observed between the two experimental groups. Histological analyses were performed on epididymal fad pads. Treatment of DIO mice with Ad-adipolin led to a reduction in adipocyte hypertrophy, indicated by a smaller cross-sectional area compared with control mice (Fig. 3B).
FIGURE 3.
Systemic delivery of adipolin improves glucose metabolism in DIO mice. After 11 weeks of HFD feeding, DIO mice were intravenously treated with Ad-adipolin or the Ad-β-gal control (5.0 × 10⁸ plaque-forming units, total). A, glucose tolerance (upper panel) and insulin tolerance (lower panel) tests were performed in DIO mice treated with Ad-adipolin or the Ad-β-gal control (mean ± S.E., n = 6 in each group). The inset shows the representative blot for plasma adipolin at 3 days after injection of adenoviral vectors (control or adipolin). Adipolin protein levels in plasma (0.2 μl) were determined by Western blot analysis. B, histological analysis of hematoxylin/eosin-stained epididymal white adipose tissue of DIO mice at 16 days after injection of Ad-adipolin or the Ad-β-gal control. Scale bars = 50 μm. Adipocyte cross-sectional areas were quantified using the Image J program (mean ± S.E., n = 6).
Adipolin Attenuates Inflammation in Fat Tissue
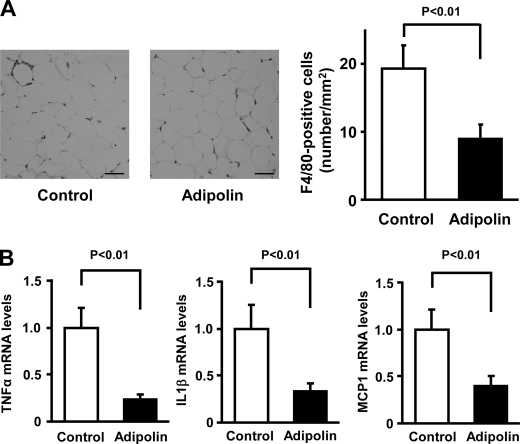
Macrophage recruitment and inflammation in adipose tissue are associated with the development of insulin resistance and glucose intolerance (20–23). Thus, we assessed macrophage accumulation in epididymal fat tissues of DIO mice by staining with antibodies against the macrophage marker F4/80 (Fig. 4A). The frequency of F4/80-positive cells in fat tissues was significantly lower in Ad-adipolin-treated mice than in control mice (Fig. 4A). Furthermore, the expression levels of proinflammatory cytokines and chemokine were determined in epididymal adipose tissue of Ad-adipolin-treated and control mice by real-time PCR methods. The administration of Ad-adipolin to DIO mice led to significant reductions in the transcript levels of TNFα, IL-1β, and MCP-1 in white adipose tissue (Fig. 4B). These data suggest that systemic administration of adipolin can improve glucose clearance and reduce adipose tissue inflammation in a model of diet-induced obesity.
FIGURE 4.
Systemic delivery of adipolin attenuates inflammatory responses in adipose tissue of obese mice. A, macrophage accumulation in epididymal fat tissues of DIO mice at 16 days after administration of Ad-adipolin or the Ad-β-gal control. Histological sections were stained with anti-F4/80 antibody. Scale bars = 50 μm. Macrophage infiltration was quantified as the number of F4/80-positive cells/mm2 (mean ± S.E., n = 6). B, gene expression of TNFα, IL-1β, and MCP-1 in epididymal adipose tissue from DIO mice treated with Ad-adipolin or the Ad-β-gal control. Transcript levels were measured by quantitative real-time PCR and are expressed relative to 36B4 levels (mean ± S.E., n = 5–6).
Adipolin Inhibits Macrophage Inflammatory Responses in Vitro
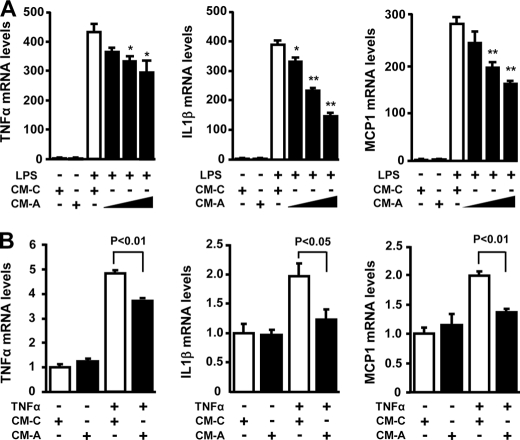
To test the effect of adipolin on macrophage inflammatory responses in vitro, murine peritoneal macrophages were cultured in conditioned medium from COS-7 cells transduced with Ad-adipolin or Ad-β-gal, followed by stimulation with LPS or vehicle. Treatment of macrophages with LPS dramatically increased the transcript levels of TNFα, IL-1β, and MCP-1 in the presence of conditioned medium from cells transduced with the Ad-β-gal control (Fig. 5A). However, conditioned medium from Ad-adipolin-transduced cells significantly blocked the stimulatory effects of LPS on expression of TNFα, IL-1β, and MCP-1 in a dose-dependent manner. Furthermore, conditioned medium from Ad-adipolin-treated cells suppressed TNFα-stimulated gene expression of TNFα, IL-1β, and MCP-1 in macrophages (Fig. 5B).
FIGURE 5.
Adipolin suppresses gene expression of proinflammatory mediators in macrophages. A, effect of adipolin on LPS-stimulated proinflammatory gene expression in macrophages. Mouse peritoneal macrophages were treated with serial dilutions of conditioned medium (CM) from COS-7 cells transduced with Ad-adipolin (CM-A, 1:4, 1:2, and 1:1 dilutions) or the Ad-β-gal control (CM-C; 1:1 dilution) for 18 h and then stimulated with LPS (100 ng/ml) or vehicle for 6 h. The gene expression levels of TNFα, IL-1β, and MCP-1 were determined by quantitative real-time PCR and are expressed relative to 36B4 levels (mean ± S.E., n = 4). *, p < 0.05; **, p < 0.01 versus CM-C. B, adipolin attenuates TNFα-stimulated proinflammatory gene expression in macrophages. Mouse peritoneal macrophages were treated with CM-A (1:1 dilution) or CM-C (1:1 dilution) for 18 h, followed by treatment with TNFα (50 ng/ml) or vehicle for 6 h. Transcript levels were determined by quantitative real-time PCR and are expressed relative to 36B4 levels (mean ± S.E., n = 4).
DISCUSSION
This study provides the first evidence that adipolin/C1qdc2/CTRP12 functions as an adipokine that diminishes inflammatory responses in fat tissues and promotes insulin sensitivity. Adipolin was abundantly expressed in white adipose tissues, and its expression was down-regulated in multiple rodent models of obesity. Systemic delivery of adipolin ameliorated insulin resistance and glucose intolerance in DIO mice in vivo. The beneficial actions of adipolin on glucose metabolism were associated with decreased expression of inflammatory mediators in adipose tissue and with reduced macrophage infiltration.
The development of obesity-related metabolic disorders is attributed in part to an imbalance in the production of adipokines, most of which are proinflammatory and detrimental to metabolism. In comparison, adiponectin is a unique adipokine because it has anti-inflammatory and insulin-sensitizing actions in a number of rodent models (3, 10). Circulating levels of adiponectin are down-regulated in association with various obesity-linked complications, including type 2 diabetes (1, 3, 10). Here, we have demonstrated that, like adiponectin, adipolin is expressed predominantly in fat tissues and that obese states lead to reductions in adipolin levels in both adipose tissue and plasma. Similar to adiponectin, adipolin regulates inflammatory responses in white adipose tissue under conditions of overnutrition, and this may contribute to improvements in glucose metabolism.
CTRP proteins are conserved paralogs of adiponectin that contain a C1q domain at the C terminus (24). Adipolin (CTRP12) belongs to the CTRP protein family, which includes 15 members. An NCBI Database search for the CTRP proteins revealed that the amino acid sequence identity of adipolin (or its C1q domain) to other members of the CTRP protein family in mice ranges from 10(6)% to 23(22)%. Adipolin shares a 20(19)% homology with adiponectin. Whereas adiponectin has up to a 45(48)% sequence identity to some CTRP family members, it displays lesser sequence identity to adipolin. However, both adipolin and adiponectin are down-regulated in obese states. In contrast to adipolin and adiponectin, the expression of other members of this family in fat tissues is either increased or unchanged in obese states (25, 26). For instance, a recent report showed that CTRP13 in fat tissue is up-regulated in obese states, but this factor stimulates glucose uptake in muscle and reduces hepatic glucose output in vitro, indicating a role in glucose homeostasis (25).
Obesity is characterized by a low-grade chronic inflammatory state that contributes to the development of insulin resistance and glucose intolerance. Increased levels of saturated fatty acids are observed in obesity, and these conditions promote endoplasmic reticulum stress in adipocytes, ultimately resulting in the induction of an inflammatory response (18–20, 27). Adipolin transcript levels were markedly suppressed in cultured adipocytes by palmitic acid, the endoplasmic reticulum stress inducer tunicamycin, or TNFα. Adipolin expression was also reduced in adipose tissues in models of diabetes and obesity. These data suggest that obesity-associated pathological conditions, including cellular stress and inflammation, can account for the reduction of adipolin expression in the fat tissues of obese rodents.
Obesity-induced macrophage infiltration of adipose tissue is believed to be causally involved in the development of systemic insulin resistance (22, 23). Thus, the resolution of adipose tissue inflammation may represent an approach to treat obesity-induced metabolic dysfunction. In this study, we have shown that adipolin-conditioned medium suppressed expression of proinflammatory cytokine and chemokine expression in response to LPS or TNFα in macrophages. Furthermore, systemic administration of adipolin to obese mice led to the down-regulation of proinflammatory mediators in fat tissues, which was accompanied by decreased accumulation of adipose tissue macrophages. Because adipolin is produced by adipocytes, these data suggest that adipolin ameliorates insulin resistance through its ability to attenuate macrophage activation in fat tissue by acting in a paracrine manner.
Our data show that adipolin expression is found in both white adipose tissue and brown adipose tissue. Although brown adipose tissue is functionally different from white adipose tissue due to its role in energy expenditure and thermogenesis, both brown and white adipose tissues can produce similar adipokines, including adiponectin and leptin (28, 29). It has been shown that adiponectin and leptin can affect energy metabolism by directly acting on brown adipose tissue (30, 31), indicating possible autocrine roles. However, due to the smaller mass of brown adipose tissue compared with white adipose tissue, it remains unclear whether adipokines secreted from brown adipose tissue function in an endocrine manner. Thus, the physiological significance of adipokine expression in brown adipose tissue requires further investigation. Furthermore, the receptor or binding partners for adipolin and other members of the CTRP family are unknown. Further work will be required to determine whether adipolin shares receptors with adiponectin and, for example, regulates glucose metabolism through interactions with adiponectin receptors 1 and 2 and T-cadherin (32, 33) or whether it functions through an entirely different receptor system.
In summary, our data demonstrate that adipolin is a new member of the adipokine family. It is produced by adipocytes, and its expression in adipose tissue is reduced in rodent models of obesity. Under conditions of obesity, adipolin administration improves insulin sensitivity and suppresses inflammation in adipose tissue. Because adipolin levels in the blood stream are reduced in obese states, it appears that the approaches aimed at increasing adipolin levels can be potentially useful for the prevention and treatment of obesity-linked insulin resistance.
Acknowledgments
We gratefully acknowledge the technical assistance of Megumi Kondo and Masae Takahashi.
This work was supported, in whole or in part, by National Institutes of Health Grant P01HL081587 (to K. W.). This work was also supported by a grant-in-aid for scientific research from the ministry of Education and grants from the Suzuken Memorial Foundation, the Japan Research Foundation for Clinical Pharmacology, and the Uehara Memorial Foundation (to N. O.) and by a grant-in-aid for young scientists (B) from the ministry of Education, the Uehara Memorial Foundation, and the Japan Heart Foundation/Novartis Grant for Research Award on Molecular and Cellular Cardiology 2011 (to R. S.).
- HFD
- high-fat diet
- DIO
- diet-induced obese
- Ad
- adenoviral.
REFERENCES
- 1. Matsuzawa Y. (2006) Nat. Clin. Pract. Cardiovasc. Med. 3, 35–42 [DOI] [PubMed] [Google Scholar]
- 2. Després J. P., Lemieux I. (2006) Nature 444, 881–887 [DOI] [PubMed] [Google Scholar]
- 3. Ouchi N., Parker J. L., Lugus J. J., Walsh K. (2011) Nat. Rev. Immunol. 11, 85–97 [DOI] [PMC free article] [PubMed] [Google Scholar]
- 4. Scherer P. E. (2006) Diabetes 55, 1537–1545 [DOI] [PubMed] [Google Scholar]
- 5. Spiegelman B. M., Flier J. S. (1996) Cell 87, 377–389 [DOI] [PubMed] [Google Scholar]
- 6. Ouchi N., Kihara S., Arita Y., Maeda K., Kuriyama H., Okamoto Y., Hotta K., Nishida M., Takahashi M., Nakamura T., Yamashita S., Funahashi T., Matsuzawa Y. (1999) Circulation 100, 2473–2476 [DOI] [PubMed] [Google Scholar]
- 7. Ouchi N., Kobayashi H., Kihara S., Kumada M., Sato K., Inoue T., Funahashi T., Walsh K. (2004) J. Biol. Chem. 279, 1304–1309 [DOI] [PMC free article] [PubMed] [Google Scholar]
- 8. Maeda N., Shimomura I., Kishida K., Nishizawa H., Matsuda M., Nagaretani H., Furuyama N., Kondo H., Takahashi M., Arita Y., Komuro R., Ouchi N., Kihara S., Tochino Y., Okutomi K., Horie M., Takeda S., Aoyama T., Funahashi T., Matsuzawa Y. (2002) Nat. Med. 8, 731–737 [DOI] [PubMed] [Google Scholar]
- 9. Shibata R., Sato K., Pimentel D. R., Takemura Y., Kihara S., Ohashi K., Funahashi T., Ouchi N., Walsh K. (2005) Nat. Med. 11, 1096–1103 [DOI] [PMC free article] [PubMed] [Google Scholar]
- 10. Ouchi N., Kihara S., Funahashi T., Matsuzawa Y., Walsh K. (2003) Curr. Opin. Lipidol. 14, 561–566 [DOI] [PubMed] [Google Scholar]
- 11. Ouchi N., Higuchi A., Ohashi K., Oshima Y., Gokce N., Shibata R., Akasaki Y., Shimono A., Walsh K. (2010) Science 329, 454–457 [DOI] [PMC free article] [PubMed] [Google Scholar]
- 12. Izumiya Y., Hopkins T., Morris C., Sato K., Zeng L., Viereck J., Hamilton J. A., Ouchi N., LeBrasseur N. K., Walsh K. (2008) Cell Metab. 7, 159–172 [DOI] [PMC free article] [PubMed] [Google Scholar]
- 13. Ouchi N., Oshima Y., Ohashi K., Higuchi A., Ikegami C., Izumiya Y., Walsh K. (2008) J. Biol. Chem. 283, 32802–32811 [DOI] [PMC free article] [PubMed] [Google Scholar]
- 14. Ohashi K., Parker J. L., Ouchi N., Higuchi A., Vita J. A., Gokce N., Pedersen A. A., Kalthoff C., Tullin S., Sams A., Summer R., Walsh K.(2010) J. Biol. Chem. 285, 6153–6160 [DOI] [PMC free article] [PubMed] [Google Scholar]
- 15. Maeda N., Takahashi M., Funahashi T., Kihara S., Nishizawa H., Kishida K., Nagaretani H., Matsuda M., Komuro R., Ouchi N., Kuriyama H., Hotta K., Nakamura T., Shimomura I., Matsuzawa Y. (2001) Diabetes 50, 2094–2099 [DOI] [PubMed] [Google Scholar]
- 16. Shibata R., Ouchi N., Kihara S., Sato K., Funahashi T., Walsh K. (2004) J. Biol. Chem. 279, 28670–28674 [DOI] [PubMed] [Google Scholar]
- 17. Ouchi N., Shibata R., Walsh K. (2005) Circ. Res. 96, 838–846 [DOI] [PubMed] [Google Scholar]
- 18. Schenk S., Saberi M., Olefsky J. M. (2008) J. Clin. Invest. 118, 2992–3002 [DOI] [PMC free article] [PubMed] [Google Scholar]
- 19. Gregor M. G., Hotamisligil G. S. (2007) J. Lipid Res. 48, 1905–1914 [DOI] [PubMed] [Google Scholar]
- 20. Hotamisligil G. S. (2006) Nature 444, 860–867 [DOI] [PubMed] [Google Scholar]
- 21. Sun K., Kusminski C. M., Scherer P. E. (2011) J. Clin. Invest. 121, 2094–2101 [DOI] [PMC free article] [PubMed] [Google Scholar]
- 22. Weisberg S. P., McCann D., Desai M., Rosenbaum M., Leibel R. L., Ferrante A. W., Jr. (2003) J. Clin. Invest. 112, 1796–1808 [DOI] [PMC free article] [PubMed] [Google Scholar]
- 23. Xu H., Barnes G. T., Yang Q., Tan G., Yang D., Chou C. J., Sole J., Nichols A., Ross J. S., Tartaglia L. A., Chen H. (2003) J. Clin. Invest. 112, 1821–1830 [DOI] [PMC free article] [PubMed] [Google Scholar]
- 24. Wong G. W., Wang J., Hug C., Tsao T. S., Lodish H. F. (2004) Proc. Natl. Acad. Sci. U.S.A. 101, 10302–10307 [DOI] [PMC free article] [PubMed] [Google Scholar]
- 25. Wei Z., Peterson J. M., Wong G. W. (2011) J. Biol. Chem. 286, 15652–15665 [DOI] [PMC free article] [PubMed] [Google Scholar]
- 26. Wong G. W., Krawczyk S. A., Kitidis-Mitrokostas C., Revett T., Gimeno R., Lodish H. F. (2008) Biochem. J. 416, 161–177 [DOI] [PMC free article] [PubMed] [Google Scholar]
- 27. Gregor M. F., Hotamisligil G. S. (2011) Annu. Rev. Immunol. 29, 415–445 [DOI] [PubMed] [Google Scholar]
- 28. Zhang Y., Matheny M., Zolotukhin S., Tumer N., Scarpace P. J. (2002) Biochim. Biophys. Acta 1584, 115–122 [DOI] [PubMed] [Google Scholar]
- 29. Combs T. P., Berg A. H., Rajala M. W., Klebanov S., Iyengar P., Jimenez-Chillaron J. C., Patti M. E., Klein S. L., Weinstein R. S., Scherer P. E. (2003) Diabetes 52, 268–276 [DOI] [PubMed] [Google Scholar]
- 30. Siegrist-Kaiser C. A., Pauli V., Juge-Aubry C. E., Boss O., Pernin A., Chin W. W., Cusin I., Rohner-Jeanrenaud F., Burger A. G., Zapf J., Meier C. A. (1997) J. Clin. Invest. 100, 2858–2864 [DOI] [PMC free article] [PubMed] [Google Scholar]
- 31. Masaki T., Chiba S., Yasuda T., Tsubone T., Kakuma T., Shimomura I., Funahashi T., Matsuzawa Y., Yoshimatsu H. (2003) Diabetes 52, 2266–2273 [DOI] [PubMed] [Google Scholar]
- 32. Yamauchi T., Kamon J., Ito Y., Tsuchida A., Yokomizo T., Kita S., Sugiyama T., Miyagishi M., Hara K., Tsunoda M., Murakami K., Ohteki T., Uchida S., Takekawa S., Waki H., Tsuno N. H., Shibata Y., Terauchi Y., Froguel P., Tobe K., Koyasu S., Taira K., Kitamura T., Shimizu T., Nagai R., Kadowaki T. (2003) Nature 423, 762–769 [DOI] [PubMed] [Google Scholar]
- 33. Hug C., Wang J., Ahmad N. S., Bogan J. S., Tsao T. S., Lodish H. F. (2004) Proc. Natl. Acad. Sci. U.S.A. 101, 10308–10313 [DOI] [PMC free article] [PubMed] [Google Scholar]


