

Abstract
Artificial antigen-presenting cells (aAPCs) are an emerging technology to induce therapeutic cellular immunity without the need for autologous antigen-presenting cells (APCs). To fully replace natural APCs, an optimized aAPC must present antigen (signal 1), provide costimulation (signal 2), and release cytokine (signal 3). Here we demonstrate that the spatial and temporal characteristics of paracrine release of IL-2 from biodegradable polymer aAPCs (now termed paAPCs) can significantly alter the balance in the activation and proliferation of CD8+ and CD4+ T cells. Paracrine delivery of IL-2 upon T cell contact with paAPCs induces significant IL-2 accumulation in the synaptic contact region. This accumulation increases CD25 (the inducible IL-2 Rα chain) on responding T cells and increases proliferation of CD8+ T cells in vitro to levels 10 times that observed with equivalent amounts of bulk IL-2. These CD8+ T cell responses critically depend upon close contact of T cells and the paAPCs and require sustained release of low levels of IL-2. The same conditions promote activation-induced cell death in CD4+ T cells. These findings provide insight into the response of T cell subsets to paracrine IL-2.
Keywords: Antigen Presentation, Biomaterials, Cell Therapy, Cytokine Action, T Cell, Artificial Antigen-presenting Cells, Interleukin 2, Paracrine Delivery
Introduction
Activation of naïve T cells to proliferate and acquire effector function requires, at a minimum, antigen recognition by the TCR2 (signal 1) and costimulation by ligands that engage receptors such as CD28 (signal 2), both of which are provided by conventional antigen-presenting cells (APCs) (1, 2). IL-2 is a canonical T cell growth factor and plays a central role in the expansion and differentiation of CD4+ and CD8+ effector T cells both in vivo and in vitro (2, 3) and may be described as signal 3. IL-2 is especially necessary for CD8+ T cell expansion, as this subset ceases IL-2 production after a few days of stimulation (4–6). IL-2 is principally produced by CD4+ T cells (7). APCs, such as dendritic cells, can foster CD8+ T cell responses by facilitating IL-2 delivery from CD4+ T cells to CD8+ T cells. This is accomplished by bringing CD4+ and CD8+ lymphocytes into close contact (1, 7). IL-2 delivery can also occur by synaptic transmission between T cells without the need for an APC, as in the case of homotypic T cell interactions. Synaptic transmission of IL-2, as such, has been demonstrated as a key signal for T cell cluster initiation and persistence after antigen priming (8). It has also been suggested that DCs may also secrete IL-2 at the site of T cell contact, and accumulation of this cytokine at the DC-T cell interface has been shown to be an important signal for T cell activation (9). Thus, paracrine IL-2 delivery is a physiologically important process for effective immune responses.
Both the timing and duration of IL-2 delivery are important determinants for the extent of T cell expansion (10–12). IL-2 received from CD4+ T cells within the first few hours of CD8+ T cell stimulation is responsible for increased IFN-γ and granzyme B secretion and potent anti-tumor activity (11). IL-2 is also required at later time points in CD8+ T cell stimulation to maintain proliferation and produce robust secondary responses (10, 13). However, high concentrations and chronic exposure to IL-2 can negatively impact T cell stimulation by sensitizing T cells to activation-induced cell death and tolerance induction (14–17). The source of IL-2 is also relevant because activated CD4+ T cells may sometimes display FasL, which can result in CD8+ T cell death. Here we constructed a polymeric artificial antigen-presenting cell (paAPC) from biodegradable materials that is capable of providing an antigenic signal, effective costimulation, and adjustable paracrine IL-2 signals to T cells (17, 18). The polymer that constitutes the core of this system, poly(lactic co-glycolic acid), and its homopolymers poly(lactic acid) and poly(glycolic acid) have been used for over 30 years in various human clinical applications, including drug delivery systems. The biodegradability of the polymer and subsequent release of bioactive encapsulant allow for dissection of the spatial and temporal paracrine IL-2 delivery components and their importance in CD4+ and CD8+ T cell proliferation.
In this report, we explore how local control over IL-2 delivery impacts lymphocyte activity. Given that peptide-MHC Class I complexes are recognized by CD8+ T cells whereas peptide-Class II MHC complexes are recognized by CD4+ T cells, no single peptide-MHC complex can be used to activate both T cell subsets. Therefore, in this study, we use a paAPC system presenting an antigen-independent signal equally effective on both T cell subsets, namely anti-CD3 antibody. Anti-CD3, which binds to invariant signaling proteins associated with all TCRs on both CD4+ and CD8+ T cells, is widely used as an antigen mimetic because like peptide-MHC complexes, it activates T cells by clustering TCR·CD3 complexes on the T cell surface. This approach allowed us to assess differences in the responses of these two subsets to paAPC-encapsulated IL-2 acting as a paracrine IL-2 point source.
In cells lacking the ability to secrete IL-2, paracrine delivery is critical for maximum expansion. We show that CD8+ T cells proliferate vigorously in response to paracrine IL-2 delivery by paAPCs, whereas CD4+ T cell expansion is limited by apoptosis. These effects cannot be mimicked even by an addition of a 1000-fold excess of exogenous IL-2. We find that synaptic accumulation of IL-2 in the early stages of activation may be important. Additionally, a slow and sustained release of IL-2 accounts for the effects of paracrine delivery, whereas an initial short-lived burst of cytokine availability (on the order of hours) is dispensable. The slow, sustained release must occur in close proximity to T cells to achieve maximal response.
EXPERIMENTAL PROCEDURES
Cell Lines and Primary Sources
Animal studies were approved by the Institutional Animal Care and Use Committee at Yale University. All animals were routinely used at 6–10 weeks of age, were maintained under specific pathogen-free conditions, and were routinely checked by the Yale University Animal Resource Center. C57BL/6 (B6) mice were obtained from Charles River Laboratories, Inc. (Wilmington, MA). Primary splenocytes were obtained from homogenized naïve mouse spleens after depletion of erythrocytes by hypotonic lysis (Acros Organics, Geel, Belgium). Splenocytes were resuspended in complete RPMI-10, consisting of RPMI 1640 (Invitrogen) supplemented with 10% FBS (Invitrogen), 2 mm l-glutamine (Invitrogen), 25 μm β-mercaptoethanol (American Bioanalytical, Natick, MA), 2% penicillin-streptomycin (Sigma Aldrich) and 1% gentamicin (Sigma Aldrich). B6 splenocytes were either used without further purification or subjected to negative immunoselection (R&D Systems, Minneapolis, MN) to produce CD8+, CD4+, or CD4+CD25- populations of at least 96% purity.
Construction of Biodegradable paAPCs
Poly(lactic co-glycolic acid) 50/50 with an average molecular weight of 80 kDa was obtained from Durect Corp. (Cupertino, CA). Microparticles were fabricated using a double emulsion water-in-oil-in-water technique (Jain 2000 Biomaterials). Microparticles were surface-modified with avidin-palmitate conjugate as described previously (19, 20). For cytokine encapsulation, 100 μg of recombinant human (rh) IL-2 (Proleukin, Chiron Corp., Emeryville, CA) was added to the poly(lactic co-glycolic acid) solution. Particles were lyophilized and stored at −20 °C until use. Controlled release profiles were obtained in 1 ml of PBS at 37 °C from 5 mg of particles. An ELISA analysis was performed to measure rhIL-2 levels (BD Biosciences).
Coupling of Ligand to the Surface of paAPCs
Biotinylated anti-mouse CD3ϵ (BD Biosciences) and anti-mouse CD28 (BD Biosciences) were added at 10 μg/ml to a 10 mg/ml solution of poly(lactic co-glycolic acid) particles in PBS and rotated at room temperature for 20 min. IL-2-biotin, where present, was added after 5 min of particle incubation with antibodies without washing. Particles were then washed in all cases with PBS + 1% FBS and resuspended in complete RPMI-10. IL-2 biotin was prepared by reacting rhIL-2 with biotin hydrazide followed by removal of excess biotin reagent. The activity of IL-2-biotin was verified (supplemental Fig. S2).
T Cell Stimulation Studies
paAPCs with bound antibody were added to C57Bl/6 splenocyte or purified T cell cultures containing 106 cells/ml at 0.5 mg/ml After incubation at 37 °C for 48 h, cell culture supernatant was assayed for IFN-γ and mouse IL-2 or rhIL-2 using ELISA (BD Biosciences). Cells were analyzed for viability after 96 h using Cell Titer Blue (Promega Corp., Madison, WI). For “released particle” studies, paAPCs were allowed to release IL-2 in PBS at 37 °C for 24 h and then washed with PBS + 1% FBS prior to coupling to biotinylated anti-CD3 and anti-CD28 for use in stimulation studies. Reported values were obtained by using dilutions of supernatant that yielded absorbance values within the linear portion of the standard curve. All reagents were added to cell culture at time zero and were not supplemented at a later time. Blocking antibodies (BD Biosciences) were added at 10 μg/ml, carbobenzoxy-valyl-alanyl-aspartyl-[O-methyl]-fluoromethylketone (Promega, Madison, WI) was added at 20 μm, and exogenous rhIL-2 (Chiron, Emeryville, CA) was added at the indicated amount in 2 ml of culture.
Assessment of Marker Expression by Flow Cytometry
Cells were analyzed by flow cytometry after 96 h. Cells were stained with a 1:200 dilution of antibody in PBS + 1% FBS. All antibodies were obtained from BD Biosciences. Analysis of fluorescence was performed after gating on the lymphocyte population in side scatter versus forward scatter plots followed by gating on the CD8+ and CD4+ subsets. Annexin V and the BrdU flow kits were obtained from BD Biosciences and used according to the manufacturer's instructions. Samples were run on a BD FACScan or LSRII (BD Biosciences) and were analyzed using FlowJo 8.7 (Tree Star, Ashland, OR).
Data Fitting and Statistical Analysis
Data fits were performed using GraphPad Prism 5.0. Controlled release data were fit to a two-phase exponential association model. Statistical analysis was performed in GraphPad Prism 5.0 using a one-way analysis of variance with p < 0.05 considered significant.
Modeling of the Concentration Field Near paAPCs
Diffusion controls the shape of the IL-2 normalized concentration field (C*) near a paAPC. If the ambience is quiescent and the C field is steady, the diffusion equation reduces to the Laplace equation:
For an isolated (far from a T cell) paAPC with radius a, the concentration field is spherically symmetric, and the concentration decreases inversely with radial distance (r) from the center of the paAPC (see Fig. 1D, left panel).
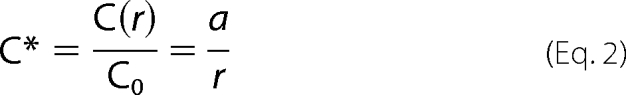 |
where C0 is the surface concentration (r = a). The normalized concentration (C*) thus has a value of unity on the surface of an isolated paAPC. When the paAPC is in proximity with a T cell, the problem is more complex. The C* field is distorted by the interaction and will depend not only on the geometric parameters such as surface-to-surface spacing and relative cell/particle size but also on kinetic parameters, including the release capacity of the paAPC and the absorption characteristics of the T cell. Because we are interested in the early stages of cell activation, when there are few, if any, high affinity IL-2 receptors, the T cell may be considered to be non-absorbing at that stage. If the paAPC releases IL-2 at a constant rate, then Equation 1 can be solved using a boundary collocation method (supplemental methods) (21, 22).
FIGURE 1.

Enhanced effects of paAPC IL-2 delivery require T cell targeting. A, separation of T cells and uncoated paAPCs was achieved by sequestering the uncoated paAPCs in a transwell while adding stimulatory aAPCs to the T cell compartment (left panel). To provide untargeted IL-2 that is released in a controlled manner, aAPCs (no IL-2 encapsulated) were added simultaneously with uncoated paAPCs (center panel). paAPCs interact with T cells at close range through targeting with anti-CD3 and anti-CD28 immobilized on the paAPC surface (right panel). B, C57Bl/6 splenocytes were stimulated with 0.5 mg/ml paAPCs. Fold expansion (after 96 h) and cytokine secretion (after 48 h) decreased significantly when T cells were separated from particles releasing IL-2. C, up-regulation of CD25 was not as pronounced on CD8+ cells distanced from paAPCs. Right panel, mean channel fluorescence values. The vertical lines denote isotype control staining. D, IL-2 release from paAPCs in isolation and in the vicinity of T cells was modeled using the diffusion equation to illustrate the level of IL-2 accumulation that T cells experience during initial interaction with paAPC (supplemental methods). Scale bar = 8 μm. Left panel, a model of IL-2 release from the paAPC. Contour lines denote the value of the normalized concentration (C*). Center panel, a T cell paAPC interaction at 3 μm apart and 20 nm apart (right). Statistical analysis was performed in GraphPad Prism 5.0 using a one-way analysis of variance. *, p < 0.05, considered significant.
RESULTS
Nanoscale Proximity of IL-2 Release Results in Accumulation of Synaptic IL-2 that Differentially Impact CD8+ versus CD4+ T Cell Stimulation
Delivering IL-2 from a point source produces both spatial and temporal gradients. To examine the effect of spatial proximity of an IL-2 source on T cell stimulation, naïve T cells from mouse splenocytes were exposed to aAPCs presenting surface-bound anti-CD3 (signal 1) and anti-CD28 (signal 2) monoclonal antibodies. We then compared the effects when IL-2 was directly added to the culture medium (exogenous IL-2) or when it was provided by releasing paAPCs (encapsulated IL-2) under three different conditions, as shown in Fig. 1A. Because IL-2 is continually released from paAPCs, the concentration of IL-2 decreases with increasing distance from its paAPC source. The closest encounter (Fig. 1A, right panel) IL-2 is delivered by paAPCs that that are separated from T cells only by the nanoscale molecular interactions involving anti-CD3 and anti-CD28 binding to their ligands on T cells. Typically these interactions are on the order of an antigen-antibody molecular length scale (approximately 10–20 nm). In the second scenario, signal 1 and 2 stimulation was achieved with aAPCs (i.e. particles decorated with antibodies without encapsulated IL-2), and IL-2 delivery was achieved with uncoated paAPCs (Fig. 1A, center panel). In this setting, paAPCs may get near the responding T cells, but the nanoscale proximal interactions with T cells are expected to be less frequent, if not absent. In the third scenario, signal 1 and 2 interactions were achieved with aAPCs (particles with antibodies) in contact with the T cells, and IL-2 is provided by uncoated paAPCs that were placed across a transwell with a pore diameter of 0.4 μm (Fig. 1A, left panel). Released IL-2 freely diffuses from the transwell into the cell compartment. Again, in this scenario, cells and IL-2 releasing particles are far from each other on the order of many microns. The total amount of IL-2, either exogenously added or encapsulated in particles, was equal (1 ng of IL-2 in 2 ml of culture).
IL-2 delivered from paAPCs enhanced T cell activation and proliferation compared with exogenous addition of IL-2 (Fig. 1B) and led to up-regulation of CD25 (C). However, IL-2 delivery was significantly less effective than paAPCs in molecular proximity to T cells. Specifically, paAPCs releasing IL-2 produced higher levels of CD25 on the surface of CD4+ and CD8+ T cells (Fig. 1C) and greater T cell activation as measured by secretion of IL-2 and IFN-γ and resulted in increased expansion of CD8+ T cells (Fig. 1B and supplemental Fig. S1). Interestingly, CD4+ T cell expansion was unaffected by distancing the IL-2 source (Fig. 1B). The results highlight the importance of colocalization of IL-2 delivery with stimulatory and costimulatory signals for efficient CD8+ T cell signaling.
A T cell present in proximity to a paAPC can experience variable IL-2 gradients depending on its separation distance from the IL-2 source. To understand the diffusive transfer of IL-2 when a T cell interacts with a paAPC, it is important to examine the behavior of the concentration field during the interaction. The normalized concentration field (C*) field is spherically symmetric and decreases inversely with distance from an isolated paAPC in a quiescent environment (Fig. 1D, left panel). When a paAPC interacts with a T cell, the spherical symmetry of C* is compromised. Prior to activation, the naïve T cell can be considered as a poorly receptive to IL-2 compared with its activated state (7). If the paAPC releases IL-2 at a constant rate, then an accumulation of IL-2 occurs at the interface. The amount of interfacial IL-2 accumulation will depend on the proximity of the cells. When the cells are separated by 3 μm (Fig. 1D, center panel), the IL-2 surface concentration will be non-uniform on the T cell surface and will have a maximum C* value of 0.7 at the synaptic point, as may be seen from the underlying magnified view of the synaptic region. If an isolated paAPC has an IL-2 surface concentration of about 1.8 pm, then a C* = 0.7 means the concentration near the T cell interface would be 1.26 pm. When the T cell is separated from the paAPC by only 20 nm (an approximate distance of synaptic ligand-receptor interactions, Fig. 1D, right panel), the T cell synaptic point C* increases significantly to 2.2, which equates to an actual concentration of 3.96 pm. So, the closer the cells, the larger the interfacial IL-2 accumulation. At this point, the T cell contact point is bathed in a concentration of IL-2 that is considerably higher than what would be expected based on an isolated paAPC concentration. This accumulation effect will be even magnified if the T cell-paAPC interface flattens during the interaction, thereby increasing the synaptic contact area. The above calculation is for a non-absorbing T cell interacting with one paAPC. In our experiments, a T cell may simultaneously interact with several paAPCs, leading to the hypothesis that the cytokine concentration, because of accumulation at multiple interface points, maybe even further magnified.
Transpresentation of IL-2 Is Not as Effective as Paracrine Delivery
Transpresented IL-2 may enhance availability and binding of IL-2 to its receptor (7, 23). Given that IL-2 is released from paAPCs, it is possible that it may associate with the particle surface in a nonspecific manner and be presented rather than released, leading to the observed enhancement at nanoscale separations. To address the effect of non-diffusible, surface-presented IL-2 on T cell activation, IL-2 was biotinylated and immobilized on the surface of aAPCs without encapsulated IL-2. Biotinylation of IL-2 did not affect its functional activity (supplemental Fig. S2). Here the amount of IL-2 immobilized on paAPCs was varied from the total amount released with paAPCs to two orders of magnitude greater than that amount.
As shown in Fig. 2, there was little or no enhancement in stimulation with surface-bound IL-2 aAPCs, and this result was similar to exogenous IL-2 addition (Fig. 2). Increasing the amount of IL-2 presented on the surface by two orders of magnitude (100 ng per mg of aAPC) over the amount released from paAPCs (1 ng per mg of particles) improved CD8+ T cell expansion (Fig. 2B) and T cell cytokine secretion (C) but was significantly lower than paAPC stimulation. Similarly, we observed no changes in the surface density of CD25 on T cells activated by presentation of IL-2 compared with exogenous delivery (Fig. 2D). The results demonstrate the importance of delivering IL-2 as a soluble paracrine factor, similar to its natural mode of action (24).
FIGURE 2.

Transpresentation of IL-2 is not as effective as paracrine delivery of IL-2 by paAPCs. A, biotinylated rhIL-2 was coupled to particles without encapsulated IL-2 after addition of biotinylated anti-CD3 and anti-CD28. C57Bl/6 splenocytes were stimulated with 0.5 mg/ml paAPCs or particles. B, particles presenting IL-2 failed to achieve the levels of CD8+ expansion induced by paAPCs even when presenting 100-fold higher amounts of IL-2. C, similarly, cytokine secretion was reduced, and CD25 levels were not significantly up-regulated from levels observed during stimulation with aAPC lacking encapsulated IL-2 (D). *, p < 0.05.
Slow Sustained Release of IL-2 Facilitates Efficient Stimulation
Diffusion of IL-2 from a point source over time also leads to temporal gradients that may impact T cell function. IL-2 release from the paAPCs occurs in two distinct phases, a short burst phase of IL-2 (0–8 h) followed by a long sustained release phase that has both a lower slope (expressed as quantity of cytokine per time) and a smaller magnitude of cytokine released (Fig. 3A). These two phases occur because IL-2 is not homogeneously distributed in the particle, and a significant fraction is localized near the surface of the particle with the remainder entrapped in the core. Release from the surface is triggered upon aqueous exposure, and slow sustained release from the core takes place over time as the aqueous medium degrades the polymer, releasing entrapped IL-2. To investigate the importance of each phase on T cell stimulation, we stimulated cells with paAPCs that have been depleted of the burst IL-2 phase and compared the potency of these “released” particles with “fresh” particles for T cell activation and expansion. Particles denoted as released were suspended in PBS under constant rotation for 24 h to wash away the burst phase prior to T cell stimulation. The remaining IL-2 is denoted as R in Fig. 3A.
FIGURE 3.

Instant release of IL-2 from paAPCs is not critical for T cell expansion. paAPCs were suspended in PBS and allowed to release their contents for 24 h and then washed prior to use. A, the release curve shows the cumulative amount of IL-2 released from paAPCs over the course of 96 h. R denotes the amount of IL-2 remaining in paAPCs that have been allowed to prerelease their IL-2 for 24 h before addition to T cell culture (paAPC Released). paAPCs allowed to release for 24 h were washed before addition of biotinylated anti-CD3 and anti-CD28. C57Bl/6 splenocytes were stimulated with 0.5 mg/ml paAPCs. B, released paAPCs were found to induce expansion at 70% potency of unreleased paAPCs. Cytokine secretion (C) and up-regulation of CD25 (D) were not significantly different than unreleased paracrine IL-2 paAPCs. *, p < 0.05.
Strikingly, released paAPCs expanded CD8+ T cells to a level that is 70% of that achieved with fresh paAPCs, despite the fact that released paAPCs deliver only about 20% as much IL-2 as fresh paAPCs (Fig. 3B). Cytokine secretion and up-regulation of CD25 were indistinguishable between released and fresh paAPCs (Fig. 3, C and D), signifying the importance of slow sustained paracrine delivery of IL-2 for effective stimulation. Though only a small amount of IL-2 is released during the sustained slow portion of the curve, this amount of cytokine is sufficient to mimic natural paracrine delivery.
Our data point to the importance of high IL-2 interfacial transfer rates over prolonged periods as a key factor in the potency of the paAPC. We hypothesized that increasing the amount of exogenous IL-2 would at some high concentration produce similar effects to those resulting from paracrine IL-2 paAPCs. To test this hypothesis, we incubated paAPCs with T cells derived from wild-type mice and mice deficient in IL-2 production (IL-2−/−) to eliminate confounding variables introduced by the presence of other cells that may act as additional sources of IL-2. The amount of exogenous IL-2 added to the media at the start of the experiment was increased by up to 3 orders of magnitude with both cell types. Although10-fold and 100-fold higher concentrations of exogenous IL-2 increased stimulation, we found that 1000-fold more IL-2 was required to approximate the effects of paAPCs in terms of CD8+ expansion (Fig. 4A), cytokine secretion (B), and levels of CD25 on CD8+ T cells (C) in wild-type T cells. Interestingly, we did not observe this enhancement with additional exogenous IL-2 in IL-2−/− cells. Stimulation of IL-2−/− T cells was still far greater with paAPCs compared with a 1000-fold addition of exogenous IL-2 (Fig. 4, D–F). The data point to the fact that paAPCs facilitate stimulation (in the absence of other sources of IL-2) by an enhanced transfer rate and concentration gradients that cannot be mimicked by exogenous sources, even at high concentrations.
FIGURE 4.

Delivery of IL-2 from paAPCs is at least 100 times more potent than exogenous addition. Exogenous IL-2 concentration was incrementally increased by orders of magnitude until the expansion of T cell subsets (A), cytokine secretion (B), and up-regulation of CD25 (C) on CD8+ T cells matched that of cells stimulated by paracrine IL-2 delivery from paAPCs. Only at 1000-fold higher exogenous IL-2 concentrations did the effects become equal to that of paAPCs. Analysis was performed after 48 h (cytokine secretion), 96 h (FACS analysis), and 96 h (proliferation). The dotted line in A denotes the levels of expansion observed with paAPCs. D, splenocytes from an IL-2−/− mouse were expanded using aAPCs with increasing amounts of exogenous IL-2 or paAPCs. After 96 h of culture, expansion of CD8+ T cells was measured by CellTiter Blue and FACs staining. CD8+ T cells did not expand as a result of increasing exogenous IL-2 concentrations. E, CD25 expression was analyzed by FACS after 96 h. *, p < 0.05.
CD8+ T Cells Are Expanded More Effectively by Paracrine IL-2 Compared with CD4+ T Cells
Stimulation by paAPCs of a splenocyte culture in which similar fractions of CD4+ and CD8+ T cells are present results in a population of T cells that is skewed strongly toward the CD8+ phenotype (Fig. 5A). Given that CD4+ T cells are a primary source of IL-2, we dissected this preferential phenotypic expansion by purifying CD4+ and CD8+ T cell populations and stimulated them separately with paAPCs. The results paralleled splenocyte (mixed CD4+ CD8+) observations. CD4+ T cells failed to proliferate substantially under all conditions, and CD8+ T cells expanded robustly with paAPCs (Fig. 5B). Purified CD8+ and CD4+ T cells mixed at defined ratios prior to stimulation by paAPCs showed the same trend. CD8+ T cells expansion showed a linear dependence on the initial frequency and hence was directly proportional to the starting concentration of CD8+ T cells, whereas CD4+ T cells expanded moderately irrespective of initial frequency (Fig. 5C). Given that CD8+ T cells can also produce small amounts of IL-2, we measured IL-2 secretion after 48 h of culture to ascertain whether the enhanced expansion was due to increased IL-2 production from stimulated CD8+ T cells. Fig. 5D shows that the level of IL-2 production after 48 h increases with increasing percentages of CD4+ T cells, and the opposite effect is seen for IFN-γ. This rules out the possibility that stimulation of CD8+ cells significantly increases their production of IL-2 and leads to the conclusion that the enhanced proliferation of CD8+ T cells is solely due to IL-2 delivery by paAPCs. These results also indicate that the proliferative patterns of CD4+ and CD8+ T cells are not the result of killing of the CD4+ subset by CD8+ T cells (25) or competition for IL-2 but rather intrinsic properties of the CD8+ versus CD4+ T cells' responses to the intense IL-2 concentration gradient provided by paAPCs.
FIGURE 5.

CD8+ T cell activation is enhanced with paracrine IL-2 delivery. A, C57Bl/6 splenocytes were stimulated with 0. 5 mg/ml paAPCs or aAPCs. After 96 h, CD8+CD8+ T cells dominate the culture exposed to paAPCs. B, T cell subsets were purified by negative selection prior to stimulation with 0.5 mg/ml paAPCs. CD4+ and CD8+ cells were stimulated separately, and proliferation was assessed after 96 h using the CellTiter Blue assay. C, the percentages of CD4+ and CD8+ cells in culture were varied, and subset expansion was examined by flow cytometry and CellTiter Blue after 96 h. paAPCs preferentially expand CD8+ T cells even when their starting percentage is low. D, cytokine secretion was measured after 48 h by ELISA. *, p < 0.05.
CD4+ T Cells Divide in Response to paAPCs Releasing IL-2 and Then Undergo Apoptosis
The observed attenuation in the CD4+ T cell response compared with CD8+ T cells upon paracrine stimulation may be due to one or both of the following mechanisms: 1) CD4+ T cells are simply slower in activation and proliferation upon encounter with paAPCs, or 2) CD4+ T cells also activate and proliferate, but their numbers are reduced by programmed cell death. To determine whether CD4+ T cells divide in culture with paAPCs, BrdU incorporation was used to detect cellular division. Division of CD4+ and CD8+ cells was evident after 48 h in all aAPC and paAPC stimulations but was significantly higher when IL-2 was present (Fig. 6A). There was no significant difference in the percentage of CD4+ T cells engaged in cell division between the exogenous and paracrine IL-2 groups. To examine the number of divisions that occurred in each case, splenocytes were labeled with the cytoplasmic dye carboxyfluorescein succinimidyl ester prior to stimulation, and dilution of the dye was examined after 96 h. Although more CD8+ T cells were found to undergo extensive cell division after exposure to paracrine IL-2 versus exogenous IL-2 addition, CD4+ T cells showed similar but moderate cell division patterns regardless of treatment (Fig. 6B and supplemental Fig. S3), indicating that CD4+ T cells are responding to paAPCs by undergoing cell division under all conditions. However, in all cases, the percentage of apoptotic cells was higher for CD4+ T cells, as indicated by annexin V staining, compared with CD8+ T cells (Fig. 6C). This percentage increased dramatically when cells were exposed to paAPCs (Fig. 6C). Interestingly, levels of CD4+ T cell apoptosis equivalent to that resulting from paAPC treatment were observed with aAPC stimulation in the presence of high exogenous IL-2 concentrations (Fig. 6D). Together this indicates that CD4+ cells undergo only a few cell division cycles and that this limited proliferation is accompanied by apoptosis upon exposure to high IL-2 concentrations. This phenomenon is in accordance with previous literature reports involving T cell response to anti-CD3 stimulation with high concentrations of exogenous IL-2 (26).
FIGURE 6.

CD4+ T cell expansion is inhibited by apoptosis, not lack of division. A, after 48 of splenocyte culture, BrdU was added to detect dividing cells. CD4+ and CD8+ T cells are dividing under all paAPC and particle conditions; however, after 96 h (B) the extent of division is much greater for CD8+ T cells exposed to paAPCs, as evidenced by CFSE dilution after 96 h. C, the percentage of cells undergoing apoptosis at 48 h, as determined by staining with annexin V, is much higher among CD4+ cells exposed to paAPCs. D, annexin V staining after 48 h reveals increased apoptosis in CD4+ cultures receiving high levels of IL-2. E, the general caspase inhibitor Z-VAD-FMK was added to C57Bl/6 splenocyte cultures at 20 μm at time zero. A blocking antibody to FasL was added to separate wells at 10 μg/ml. C57Bl/6 splenocytes were stimulated with 0.5 mg/ml paAPCs or aAPCs. Both inhibitors resulted in increased expansion of CD4+ T cells in all cases; however, the greatest gains in expansion occur with the use of apoptosis inhibitors during stimulation with paAPCs. *, p < 0.05.
Addition of the apoptosis inhibitor Z-VAD-FMK, a general caspase inhibitor, or a blocking antibody to FasL increased CD4+ T cell expansion in cultures with paAPCs (Fig. 6E). Still, the relatively modest increases in expansion observed with apoptosis inhibitors indicate that apoptosis is not the only factor limiting CD4+ expansion by paAPCs. Rather, apoptosis is combined with a low number of cell divisions to produce few CD4+ T cells during paAPC stimulation highlighting intrinsic differences in the response of CD4+ and CD8+ T cells to paracrine IL-2.
Another possible factor that could limit CD4+ T cell proliferation is the presence of regulatory T cells (Tregs). Although we did not observe expansion of CD4+FoxP3+ T cells following stimulation of splenocytes by any paAPC or particle configuration (supplemental Fig. S4B), previous work has demonstrated the ability of small numbers of Tregs to suppress large populations of effector T cells (27). To determine whether Tregs contributed to the lack of CD4+ T cell expansion by paAPCs, we depleted CD25+ cells (natural Tregs) from the CD4+ T cell population prior to paAPC stimulation. We observed a small increase in the expansion of CD4+ T cells over 96 h (supplemental Fig. S4B), suggesting that the presence of Tregs is not a major factor limiting CD4+ T cell expansion.
DISCUSSION
In this study, we recapitulated a critical set of features for antigen presentation in a configurable, artificial system that can be easily adopted for future therapeutic applications. The paAPC platform used here is a flexible, tunable system fabricated from Food and Drug Administration-approved polymers that have been used in humans for controlled drug delivery (28, 29). Here we sought to understand how paAPCs' temporal and spatial IL-2 gradients impact T cell function. We found that CD4+ and CD8+ T cells respond very differently to high local concentrations of IL-2. Paracrine IL-2 delivery results in significant expansion of CD8+ T cells, whereas CD4+ T cells proliferate minimally and undergo apoptosis (Fig. 7C). This is in contrast to exogenous IL-2 addition or IL-2 derived from CD4 cells, which leads to only moderate proliferation of CD4+ and CD8+ subsets (Fig. 7, A and B). These findings indicate that continuous release of small amounts of IL-2 in a paracrine manner can dramatically alter the homeostatic milieu in which T cells interact.
FIGURE 7.

CD8+ T cells proliferate vigorously in response to paracrine IL-2. A, moderate expansion of CD4+ and CD8+ T cells occurs in response to stimulation by particles plus antibodies with IL-2 delivery solely from CD4+ T cells or additional exogenous IL-2 (B). C, when T cells receive IL-2 in a paracrine fashion from paAPCs, CD8+ T cells proliferate vigorously, whereas CD4+ T cells undergo apoptosis.
Ultimately, successful paracrine delivery of IL-2 depends on the ability of the T cell to capture IL-2. Although the high-affinity IL-2 receptor, composed of α, β, and γ subunits, does not appear on the T cell surface until approximately 24 h following the antigen encounter (30, 31), high concentrations of IL-2 can be detected by the low-affinity IL-2 receptor (composed of β and γ subunits), which is constitutively expressed by T cells. Previous work has suggested that paracrine delivery of IL-2 from CD4+ to CD8+ T cells takes advantage of high IL-2 concentrations in the T cell-T cell synapse to signal through the low-affinity IL-2 receptor (8). This is consistent with our observation that a paAPC that delivers a high local synaptic concentration of IL-2 in the presence of stimulatory and costimulatory signals can satisfy the requirement of an initial high concentration of the needed IL-2 followed by a slow sustained and lower concentration of the cytokine. The slow sustained provision of the cytokine eventually results in up-regulation of CD25 on the surface of CD8+ T cells, similar to dendritic cell-derived IL-2 signals that have been shown to induce CD25 up-regulation (32).
We demonstrated that both temporal and spatial gradients can affect how T cells perceive and respond to IL-2 signals. During the incipient activation when the T cell is essentially non-absorbing, there is a significant increase in the synaptic IL-2 concentration. The accumulation is a sensitive function of cell separation and increases significantly with decreasing separation. Our modeling suggests that at the synaptic point there is more than a 3-fold increase in IL-2 concentration when the separation is decreased to nanoscale ligand-receptor interaction distances.
At the molecular distances involved in synaptic APC-T cell interactions, IL-2 transmission increases dramatically compared with an isolated IL-2 source. Thus, even a 1000-fold increase in the local concentration of exogenous IL-2 cannot approximate the effect of paracrine IL-2 delivery on T cells in the absence of other sources of IL-2. This observation highlights an unappreciated phenomenon involving how paracrine signaling arising from intense diffusive interactions can affect T cell activation. CD4+ and CD8+ T cells perceive this interactive signal very differently. CD8+ T cells thrive on an intense paracrine IL-2 signal and are able to expand vigorously, whereas the same conditions result in CD4+ T cell death that is likely caspase-dependent. This is consistent with previous results demonstrating that CD4+ T cell expansion by IL-2 is largely regulated by the rate of cell death. IL-2 has the most dramatic influence on the rate at which the death rate increases with the division number (26). This suggests that physiologically, the mode of T cell exposure to IL-2 has a significant role in simultaneously regulating the expansion and contraction of specific subsets.
The paAPC platform studied in this investigation is very well suited for future human therapeutic applications. There are differences between human and mouse T cells, and our current findings will have to be extended to humans. One important contributor to such species differences is that the mouse T cells in our experiments are comprised predominantly of naïve populations, whereas human T cells isolated from the peripheral blood of adults are a mixture of naïve and memory T cells. These populations do not respond the same way to growth stimuli. We note, however, that in our experiments to date we have observed a very similar significant expansion of melanoma-specific and flu-specific human T cells, with paAPCs presenting the cognate antigens and encapsulating IL-2 compared with exogenous IL-2.3
Until now, dose-related toxicity of IL-2 has hampered its therapeutic benefits (33–36). Initial studies used “dose-dense” administration of the cytokine that can cause capillary leak, possibly mediated by natural killer cells (33, 34). Second-generation formulations of IL-2 that have been developed increase its half-life in circulation while simultaneously reducing the administered dose. Some examples include fusion proteins (IL-2/Ig) (35, 36), pegylated IL-2 (37), IL-2-anti-IL-2 complexes (23), liposomal formulations (38–40), and viral and plasmid vectors (41, 42). paAPCs offer a further advantage by not only increasing cytokine half-life but also by delivering IL-2 at higher doses selectively to T cells and away from NK cells and thereby potentially reducing toxicity while improving efficacy.
Supplementary Material
Acknowledgments
We thank Maria Parkhurst and Steven Rosenberg at the National Cancer Institute and the Yale Cancer Center for their generous gifts of rhIL-2. We also thank Mark Saltzman (Yale University), Stephen Wrzesinki, and Richard Flavell (Yale School of Medicine) for helpful discussions and Jillian Andrejecsk for modeling support. We also thank Dr. Zami Ben-Sasson (National Institutes of Health) for critical reading of this work.
This work was supported in part by a National Institutes of Health Autoimmunity Center of Excellence pilot award (to T. M. F.) and Grant HL051015 (to J. S. P.). This work was also supported by a United States Department of Homeland Security predoctoral fellowship (to E. S.) and National Science Foundation Career Award 0747577 (to T. M. F.).

The on-line version of this article (available at http://www.jbc.org) contains supplemental Figs. S1–S4 and methods.
E. R. Steenblock, T. Fadel, M. Labowsky, J. S. Pober, and T. M. Fahmy, manuscript in preparation.
- TCR
- T cell receptor
- APC
- antigen-presenting cell
- paAPC
- polymer artificial antigen-presenting cell
- aAPC
- artificial antigen-presenting cell
- Treg
- regulatory T cell.
REFERENCES
- 1. Blachère N. E., Morris H. K., Braun D., Saklani H., Di Santo J. P., Darnell R. B., Albert M. L. (2006) J. Immunol. 176, 7288–7300 [DOI] [PubMed] [Google Scholar]
- 2. Pardoll D. M. (2002) Nat. Rev. Immunol. 2, 227–238 [DOI] [PubMed] [Google Scholar]
- 3. Rochman Y., Spolski R., Leonard W. J. (2009) Nat. Rev. Immunol. 9, 480–490 [DOI] [PMC free article] [PubMed] [Google Scholar]
- 4. Janssen E. M., Lemmens E. E., Wolfe T., Christen U., von Herrath M. G., Schoenberger S. P. (2003) Nature 421, 852–856 [DOI] [PubMed] [Google Scholar]
- 5. Shedlock D. J., Shen H. (2003) Science 300, 337–339 [DOI] [PubMed] [Google Scholar]
- 6. Shrikant P., Mescher M. F. (2002) J. Immunol. 169, 1753–1759 [DOI] [PubMed] [Google Scholar]
- 7. Malek T. R. (2008) Annu. Rev. Immunol. 26, 453–479 [DOI] [PubMed] [Google Scholar]
- 8. Sabatos C. A., Doh J., Chakravarti S., Friedman R. S., Pandurangi P. G., Tooley A. J., Krummel M. F. (2008) Immunity 29, 238–248 [DOI] [PMC free article] [PubMed] [Google Scholar]
- 9. Granucci F., Feau S., Angeli V., Trottein F., Ricciardi-Castagnoli P. (2003) J. Immunol. 170, 5075–5081 [DOI] [PubMed] [Google Scholar]
- 10. D'Souza W. N., Lefrançois L. (2003) J. Immunol. 171, 5727–5735 [DOI] [PubMed] [Google Scholar]
- 11. Lai Y. P., Lin C. C., Liao W. J., Tang C. Y., Chen S. C. (2009) PLoS ONE 4, e7766 [DOI] [PMC free article] [PubMed] [Google Scholar]
- 12. Villarino A. V., Tato C. M., Stumhofer J. S., Yao Z., Cui Y. K., Hennighausen L., O'Shea J. J., Hunter C. A. (2007) J. Exp. Med. 204, 65–71 [DOI] [PMC free article] [PubMed] [Google Scholar]
- 13. Williams M. A., Tyznik A. J., Bevan M. J. (2006) Nature 441, 890–893 [DOI] [PMC free article] [PubMed] [Google Scholar]
- 14. Krammer P. H., Arnold R., Lavrik I. N. (2007) Nat. Rev. Immunol. 7, 532–542 [DOI] [PubMed] [Google Scholar]
- 15. Lenardo M. J. (1991) Nature 353, 858–861 [DOI] [PubMed] [Google Scholar]
- 16. Waldmann T. A. (2006) Nat. Rev. Immunol. 6, 595–601 [DOI] [PubMed] [Google Scholar]
- 17. Steenblock E. R., Fahmy T. M. (2008) Mol. Ther. 16, 765–772 [DOI] [PubMed] [Google Scholar]
- 18. Steenblock E. R., Wrzesinski S. H., Flavell R. A., Fahmy T. M. (2009) Expert Opin. Biol. Ther. 9, 451–464 [DOI] [PubMed] [Google Scholar]
- 19. Park J., Mattessich T., Jay S. M., Agawu A., Saltzman W. M., Fahmy T. M. (2011) J. Control. Release [DOI] [PMC free article] [PubMed] [Google Scholar]
- 20. Fahmy T. M., Samstein R. M., Harness C. C., Mark Saltzman W. (2005) Biomaterials 26, 5727–5736 [DOI] [PubMed] [Google Scholar]
- 21. Labowsky M. (2010) Rapid Commun. Mass Spectrom. 24, 3079–3091 [DOI] [PubMed] [Google Scholar]
- 22. Labowsky M., Fenn J. B., de la Mora J. F. (2000) Anal. Chim. Acta 406, 105–118 [Google Scholar]
- 23. Létourneau S., van Leeuwen E. M., Krieg C., Martin C., Pantaleo G., Sprent J., Surh C. D., Boyman O. (2010) Proc. Natl. Acad. Sci. U.S.A. 107, 2171–2176 [DOI] [PMC free article] [PubMed] [Google Scholar]
- 24. Huse M., Quann E. J., Davis M. M. (2008) Nat. Immunol. 9, 1105–1111 [DOI] [PMC free article] [PubMed] [Google Scholar]
- 25. Foulds K. E., Zenewicz L. A., Shedlock D. J., Jiang J., Troy A. E., Shen H. (2002) J. Immunol. 168, 1528–1532 [DOI] [PubMed] [Google Scholar]
- 26. Ganusov V. V., Milutinović D., De Boer R. J. (2007) J. Immunol. 179, 950–957 [DOI] [PubMed] [Google Scholar]
- 27. Shevach E. M. (2009) Immunity 30, 636–645 [DOI] [PubMed] [Google Scholar]
- 28. Yamaguchi K., Anderson J. M. (1993) J. Control. Release 24, 81–93 [Google Scholar]
- 29. Langer R., Folkman J. (1976) Nature 263, 797–800 [DOI] [PubMed] [Google Scholar]
- 30. Carlsson R., Sjögren H. O. (1985) Cell. Immunol. 96, 175–183 [DOI] [PubMed] [Google Scholar]
- 31. Pihlgren M., Dubois P. M., Tomkowiak M., Sjögren T., Marvel J. (1996) J. Exp. Med. 184, 2141–2151 [DOI] [PMC free article] [PubMed] [Google Scholar]
- 32. Granucci F., Andrews D. M., Degli-Esposti M. A., Ricciardi-Castagnoli P. (2002) Trends Immunol. 23, 169–171 [DOI] [PubMed] [Google Scholar]
- 33. Hu P., Mizokami M., Ruoff G., Khawli L. A., Epstein A. L. (2003) Blood 101, 4853–4861 [DOI] [PubMed] [Google Scholar]
- 34. Shanafelt A. B., Lin Y., Shanafelt M. C., Forte C. P., Dubois-Stringfellow N., Carter C., Gibbons J. A., Cheng S. L., Delaria K. A., Fleischer R., Greve J. M., Gundel R., Harris K., Kelly R., Koh B., Li Y., Lantz L., Mak P., Neyer L., Plym M. J., Roczniak S., Serban D., Thrift J., Tsuchiyama L., Wetzel M., Wong M., Zolotorev A. (2000) Nat. Biotechnol. 18, 1197–1202 [DOI] [PubMed] [Google Scholar]
- 35. Barouch D. H., Craiu A., Kuroda M. J., Schmitz J. E., Zheng X. X., Santra S., Frost J. D., Krivulka G. R., Lifton M. A., Crabbs C. L., Heidecker G., Perry H. C., Davies M. E., Xie H., Nickerson C. E., Steenbeke T. D., Lord C. I., Montefiori D. C., Strom T. B., Shiver J. W., Lewis M. G., Letvin N. L. (2000) Proc. Natl. Acad. Sci. U.S.A. 97, 4192–4197 [DOI] [PMC free article] [PubMed] [Google Scholar]
- 36. Gillies S. D., Lan Y., Hettmann T., Brunkhorst B., Sun Y., Mueller S. O., Lo K. M. (2011) Clin. Cancer Res. 17, 3673–3685 [DOI] [PubMed] [Google Scholar]
- 37. Teppler H., Kaplan G., Smith K. A., Montana A. L., Meyn P., Cohn Z. A. (1993) J. Exp. Med. 177, 483–492 [DOI] [PMC free article] [PubMed] [Google Scholar]
- 38. Kanaoka E., Takahashi K., Yoshikawa T., Jizomoto H., Nishihara Y., Uchida N., Maekawa R., Hirano K. (2002) J. Control. Release 82, 183–187 [DOI] [PubMed] [Google Scholar]
- 39. Neville M. E., Robb R. J., Popescu M. C. (2001) Cytokine 16, 239–250 [DOI] [PubMed] [Google Scholar]
- 40. Neville M. E., Boni L. T., Pflug L. E., Popescu M. C., Robb R. J. (2000) Cytokine 12, 1691–1701 [DOI] [PubMed] [Google Scholar]
- 41. Fakhrai H., Shawler D. L., Van Beveren C., Lin H., Dorigo O., Solomon M. J., Gjerset R. A., Smith L., Bartholomew R. M., Boggiano C. A., Gold D. P., Sobol R. E. (1997) J. Immunother. 20, 437–448 [DOI] [PubMed] [Google Scholar]
- 42. Kaufman H. L., Flanagan K., Lee C. S., Perretta D. J., Horig H. (2002) Vaccine 20, 1862–1869 [DOI] [PubMed] [Google Scholar]
Associated Data
This section collects any data citations, data availability statements, or supplementary materials included in this article.