

Abstract
The cell dynamics associated with induction of peripheral T cell tolerance remain largely undefined. Herein, an in vivo model was adapted to two-photon microscopy imaging and T cell behavior was analyzed upon tolerogen-induced modulation. Fcγ receptor-deficient (FcγR−/−) mice were unable to resist or ameliorate experimental allergic encephalomyelitis (EAE) when treated with Ig-MOG tolerogen, an Ig carrying the myelin oligodendrocyte glycoprotein (MOG) 35–55 peptide. However, when FcγR+/+ dendritic cells (DC) are adoptively transferred into FcγR−/− mice, uptake and presentation of Ig-MOG occurs and the animals were able to overcome EAE. We then fluorescently labeled FcγR+/+ DC and 2D2 MOG-specific TCR-transgenic T cells, transferred them into FcγR−/− mice, administered Ig-MOG and analyzed both T cell-DC contact events and T cell motility. The results indicate that tolerance takes place in lymphoid organs and surprisingly the T cells do not become anergic but instead have a Th2 phenotype. The tolerant Th2 cells displayed reduced motility after tolerogen exposure similar to Th1 cells following immunization. However, the Th2 cells had higher migration speeds and took longer to exhibit changes in motility. Therefore, both Th1 immunity and Th2 tolerance alter T cell migration upon antigen recognition, but the kinetics of this effect differ among the subsets.
Introduction
Peripheral T cell tolerance represents a safeguard system that prevents self-reactive T cells, which have escaped negative selection in the thymus, from causing autoimmunity (1). The molecular mechanisms that underlie peripheral tolerance are diverse and include T cell deletion (2), anergy (3, 4), cytokine bias (5, 6) and suppression by T regulatory (Treg) cells (7). For these mechanisms to function, antigen presenting cells (APCs) and potentially autoreactive T lymphocytes must interact under circumstances that dictate the fate of the T cells. While the cellular and signaling mechanisms underlying peripheral T cell tolerance are well established, the cell dynamics that manifest while T cells are undergoing tolerance are poorly understood (8). Herein, an antigen-induced T cell tolerance model was developed and used to analyze the characteristic T cell behaviors and DC interactions that lead to T cell tolerance.
Fc gamma receptor (FcγR)-deficient (FcγR−/−) mice are unable to reverse experimental allergic encephalomyelitis (EAE) when treated with tolerogenic Ig-MOG, an Ig carrying the myelin oligodendrocyte glycoprotein (MOG)35–55 peptide (9). However, when FcγR−/− mice are transferred with FcγR+/+ dendritic cells (DC) they became able to take up Ig-MOG through FcγRs and EAE subsides (9). This model is advantageous in that tolerance can be initiated by injection of aggregated (agg) Ig-MOG, providing a highly sensitive readout system for analysis of T cell motility and shape in vivo (10). Moreover, the cell dynamics displayed during antigen recognition reflect abundance of antigen and the strength of the antigen signal (11, 12). Our hypothesis was that tolerance would be associated with transient DC-T cell interactions and reduced T cell velocity, similar to early T cell antigen recognition events (13–15), and to transient interactions observed by others in models of tolerance (16, 17) or as a result of regulatory T cell function (18, 19). To test this hypothesis, we imaged adoptively transferred MOG35-55-specific 2D2 TCR transgenic T cells (CFSE, green) and C57BL/6 FcγR+/+ DC, (SNARF, red) upon exposure to Ig-MOG in the C57BL/6 FcγR−/− hosts. Initially, the experiments were focused on determining where contact between T cells and DCs occurs. Surprisingly, a significant number of T cell-DC contacts were observed in lymphoid tissues but not in non-lymphoid organs such as the lung, intestine, and liver. Moreover, only lymphoid organs in close proximity with the intraperitoneal portal of entry of Ig-MOG displayed significant T cell-DC contacts. Two-photon microscopy and cell tracking showed decreased T cell displacements and reduced speeds but straighter trajectories relative to T cells that were not exposed to agg Ig-MOG. This pattern is similar to immune activated T cells (13, 14) and raised the question as to whether tolerant T cells had activated phenotypes. Analyses of these premises indicated that the tolerant T cells had an activated phenotype and produced both IL-4 and IL-5 Th2 cytokines. Moreover, when compared to immunogen-induced IFNγ-producing 2D2 TCR Tg Th1 cells, the decrease in velocity appeared delayed in time but otherwise similar to the Th1 counterparts which moved at a slower pace with a more directed trajectory than naïve T cells. These results indicate that tolerance during EAE occurs in lymphoid organs and displays cell dynamics that are remarkably similar to those associated with inflammatory immunity.
Materials and Methods
Animals
C57BL/6 mice were purchased from The Jackson Laboratory. 2D2 TCR transgenic mice have been described previously (20). Fcerg1 mice deficient for FcγR I and III were previously described (9). Mice were bred and maintained in our animal care facility for the duration of the experiments. All experimental procedures were performed according to the guidelines of the University of Missouri institutional animal care committee.
Antigens
Peptides
The peptides used in this study was purchased from Metabion (Munich, Germany) and was HPLC purified to >90% purity. MOG peptide encompassing aa residues 35–55 of MOG, is encephalitogenic for C57BL/6 mice (21). PLP1 peptide encompasses an encephalitogenic sequence corresponding to aa 139–151 of PLP (22).
Ig-chimeras
The Ig chimeras used in this study, Ig-W and Ig-MOG, have been previously described (9, 23). Briefly, Ig-MOG incorporates MOG peptide inserted within the H chain CDR3 region. Ig-W is the parental IgG2b, κ molecule not encompassing any myelin or other peptide. All chimera transfectants were grown up in large-scale culture of DMEM containing 10% iron-enriched calf serum (HyClone). The chimeras were purified from culture supernatant on affinity chromatography columns made of rat anti-mouse k chain coupled to CNBr-activated Sepharose 4B (Amersham Biosciences). To avoid cross-contamination, separate columns were used to purify each chimera. Aggregation of the Ig chimeras was done using 50%-saturated (NH4)2SO4 as described previously (24). All the Ig chimeras were derived from the same Ig backbone and thereby comprise identical IgG2b isotype.
Isolation of T cells and dendritic cells
CD4+ T cells were isolated from spleens of 2D2 Tg mice by positive selection using the MACS cell separation system (Miltenyi Biotec). Antigen presenting cells enriched for dendritic cells (DC) were obtained by the standard collagenase/differential adherence method previously described (25). Briefly, spleens from C57BL/6 mice were disrupted in a collagenase solution and an isolated buffy coat was floated on a dense BSA gradient. Subsequently, the cells were allowed to adhere to Petri dishes for 90 min at 37°C, washed, and incubated overnight. The non-adherent cells that are enriched for bulk dendritic cells were collected and used in experiments. CD11c+ purified dendritic cells were obtained from spleens of C57BL/6 mice by positive selection of bulk DCs using MACS separation system.
Induction of EAE
Active EAE
Induction of EAE has been previously described (9, 24). Briefly, FcγR KO mice (6–8 wk old) were induced for EAE by s.c. injection in the footpads and at the base of the limbs of a 200 μl IFA/PBS (v/v) solution containing 300 μg MOG and 200 μg of Mycobacterium tuberculosis H37Ra (Difco). Six hours later, the mice were given i.v. 500 ng of purified Bordetella Pertussis toxin (List Biological Laboratories). A second injection of B. Pertussis toxin was given after 48 h. The mice were then scored daily for clinical signs of EAE as follows: 0, no clinical score; 1, loss of tail tone; 2, hind limb weakness; 3, hind limb paralysis; 4, forelimb paralysis; and 5, moribund or death.
Passive EAE
Splenocytes were purified from 2D2 TCR Tg mice and activated in vitro with 30μg/ml MOG peptide for 72 hours in the presence of 10 ng/ml of rIL-12. Six-to-8-week-old female FcγR−/− mice irradiated (500 rads) and reconstituted with 6 × 10⁶ C57BL/6 FcγR+/+ dendritic cells and 10 × 106 activated 2D2 cells. The mice were observed daily and graded for disease according to the scale described above.
Treatment of EAE with Ig-MOG
For tolerance of T cells prior to disease induction, the mice were given a single i.p. injection of 600 μg agg Ig-MOG. For tolerance of T cells after induction of EAE, the mice were given i.p. 600 μg agg Ig-MOG every other day for 3 times.
Cell labeling with fluorescent dyes
Purified 2D2 CD4+ T cells were labeled with CFSE as previously described (26). Briefly, CD4 T cells (10 ×106 cells/ml) were incubated with 10 μM CFSE at 37°C for 10 minutes. The labeled cells were then washed twice with ice-cold DMEM-10% FCS and PBS before transfer into mice. A similar protocol was used for labeling the cells with SNARF (Molecular Probes).
Tissue preparation and cryosections
Mice that received the adoptively transferred fluorescently tagged cells were sacrificed at respective time points. The organs were fixed internally by perfusion with 2% paraformaldehyde following perfusion with PBS. The fixed tissues were dissected and placed in a biopsy cassette filled with freezing medium (OCT, Ted-Pella Inc). The tissues were frozen at −80°C and cryosections 8 mm thick were obtained using Leica CM 1850 cryostat.
Imaging
Cryosections were imaged using the Zeiss Axiophot microscope fitted with an Olympus DP-70 camera. Images were acquired using DP controller software. Further analysis of images including overlaying, contrast, picture quality adjustment etc. were done using Photoshop software (Adobe).
Measurement of cytokines by ELISA
IFNγ, IL-4 and IL-5 were detected by ELISA according to BD Pharmingen’s (San Jose, CA) standard protocol. The capture antibody was rat anti-mouse IFNγ (R4-6A2) and the biotinylated antibody was rat anti-mouse IFNγ (XMG1.2). For IL-4 detection, the capture antibody was rat anti-mouse IL-4 (11B11) and the biotinylated antibody was rat anti-mouse IL-4 (BVD6-24G2). aIL-4Rα monoclonal antibody (M1) was provided by Amgen (Seattle, WA). For detection of IL-5, the capture antibody was rat anti-mouse IL-5 (TRFK5) and the biotinylated antibody was rat anti-mouse IL-5 (TRFK4). The OD450 was read on SpectraMAX 190 counter (Molecular Devices, Sunnyvale, CA) and analyzed using SOFTmax PRO 3.1.1 software. A graded amount of recombinant cytokine was included for construction of a standard curve. The cytokine concentration in culture supernatants was extrapolated from the linear portion of the standard curve.
Measurement of cytokines by ELISPOT
IFNγ, IL-4 and IL-5 were detected by ELISPOT using an Immunospot analyzer as described (27). Briefly, HA-multiscreen plates were coated with 100 μl/well 1M NaHCO3 buffer containing 2 μg/ml capture antibody. After an overnight incubation at 4°C, the plates were washed three times with sterile PBS and free sites were saturated with DMEM culture media containing 10% fetal calf serum for 2h at 37°C. Subsequently, the blocking media was removed and 1 × 10⁶ splenic cells were added per well along with 30 μg MOG peptide or 15 μg PLP1 peptide. After 24h incubation at 37°C in a 7% CO2 humidified chamber, the plates were washed and 100 μl of biotinylated anti-cytokine antibody (1 μg/ml) was added. The antibody pairs used here were those described for the ELISA technique. Following overnight incubation at 4°C, the plates were washed and 100 μl of avidin-peroxidase (2.5μg/ml) was added. The plates were then incubated for 1h at 37°C. Subsequently, spots were visualized by adding 100 μl of substrate (3-amino-9-ethylcarbazole) in 50 mM acetate buffer pH 5.0, and counted on an Immunospot series 3B analyzer using Immunospot version 3.2 software.
Flow cytometry
SNARF+ MOG transgenic 2D2 CD4+ T cells were adoptively transferred to the FcγR KO mice. The cells were harvested from spleens and lymph nodes 48 hours after treatement with Ig-MOG. Subsequently, these cells were incubated with FITC-conjugated anti-CD25 (PC61), anti-CD62L (MEL-14) or anti-CD44 (IM7) at 4°C for 30 minutes. The cells were then washed and analyzed using FACSVantage flow cytometer and Cell Quest software (BD Biosciences). Dead cells were excluded based on their forward and side-scatter profiles. For staining of intracellular caspase in T cells, FITC-conjugated ZVAD FMK (BD Pharmingen) was used according to the protocol available.
Two-photon imaging and analysis
Mice were sacrificed by CO2 asphyxiation at various times after T cell/DC transfers. LN were removed and analyzed by two-photon microscopy as described previously (14, 15). Briefly, LN were secured to cover slips with a thin film of VetBond (3M) and placed in a flow chamber maintained at 37°C by perfusion with warm, high glucose DMEM bubbled with a mixture of 95% O2 and 5% CO2. Time-lapse imaging was performed using a custom built two-photon microscope, fitted with two Chameleon Ti:sapphire lasers (Coherent) and an Olympus XLUMPlanFI 20x objective (water immersed; numerical aperture, 0.95), and controlled and acquired with ImageWarp (A&B software). For imaging of CFSE, the excitation wavelength was set to 915 nm. Signals from fluorescent dyes were separated by dichroic mirrors (490 nm and 560 nm). To create time-lapse sequences, the volumes of tissue were scanned at 100×120×75 μm at 2.5-μm Z-steps at approximately 30-second intervals for up to 60 min.
Image acquisition, morphometric analysis, and cell tracking were performed using Metamorph software (Universal Imaging Corp). T cell–DC contacts were visualized in three dimensions at different times using a fully rendered multidimensional dataset (Imaris; Bitplane). Cells were tracked over time manually using Velocity (Improvision). Instantaneous velocities were calculated from the distance moved between successive time points.
Statistical analysis
Statistical analyses were done using either an unpaired, two-tailed Student t-test or one-way ANOVA as indicated.
Results
In vivo presentation of aggregated Ig-MOG by dendritic cells modulates EAE
In order to investigate the cellular and molecular mechanisms of T cell tolerance, we devised an in vivo model where antigen-induced interactions between T cells and APCs could be visualized. In our model, 2D2 transgenic T cells carrying the MOG35-55 peptide-specific TCR are the target of tolerance induction (20). The tolerogen is Ig-MOG, an Ig chimera carrying MOG35-55 peptide within the heavy chain complimentarity determining region 3 (CDR3) (9). Ig-MOG is internalized by APCs mainly via FcγRs and drives efficient peptide presentation to T cells (9). Since dendritic cells were reliable for antigen presentation and imaging (28, 29), we used FcγR+/+ DCs to drive presentation of Ig-MOG. Accordingly, 2D2 T cells and FcγR+/+ C57BL/6 DCs were labeled with the green fluorescent dye carboxyfluorescein diacetate succinimidyl ester (CFSE) and the red fluorescent stain 5-(and-6)-carboxy seminaphthorhodafluor-1 (SNARF), respectively and adoptively transferred i.v. into FcγR−/− C57BL/6 recipient mice. Subsequently, Ig-MOG was given i.p to initiate antigen uptake and presentation to T cells by the exogenous FcγR+/+ DC. Co- localization of cells in the spleen of the host mice can be readily visualized indicating that the approach is feasible (Supplemental Fig. 1). This model was then used to evaluate Ig-MOG-induced contact between the two cells and to analyze the cellular dynamics that govern tolerance. The initial experiments were conducted to determine whether Ig-MOG treatment could support tolerance of T cells in this model. Accordingly, FcγR−/− C57BL/6 mice were adoptively transferred with FcγR+/+ DCs and naïve 2D2 T cells and tolerance was induced with agg Ig-MOG prior to induction of EAE with MOGp (Fig. 1A). The results show that mice recipient of Ig-MOG developed clinical signs of EAE with a mean maximal score (MMS) of 1 ± 0.0, while those given Ig-W, the Ig backbone without MOGp had more severe disease with a MMS of 2 ± 0.3. The disease course remained unchanged for both groups of mice for the duration of the monitoring period. These results indicate that exogenous DCs are able to take up Ig-MOG and sustain tolerogenic contact with 2D2 T cells through presentation of MOGp. To further substantiate this phenomenon we tested whether similar tolerogenic contacts could occur when the 2D2 T cells are activated before exposure to DCs and Ig-MOG. Indeed, the transfer of disease by activated 2D2 T cells is inhibited when the mice received both FcγR+/+ DC and Ig- MOG treatment, but not when the recipients were given Ig-MOG without DC transfer (Fig. 1B). The mean maximal score decreased from 1.75 ± 0.5 in the mice without DC transfer to 0.7 ± 0.5 in those receiving DC transfer. In addition, Ig-W treatment had no effect (MMS 1.8 ± 0.3) when given with DC transfer. Finally, to determine whether the DC transfer and Ig-MOG treatment system is effective with endogenous polyclonal T cells after induction of disease, FcγR−/− C57BL/6 mice were induced for EAE with MOGp and then the animals were given FcγR+/+ DCs and treated with agg Ig-MOG. Figure 1C shows that treatment with Ig-MOG suppressed paralysis while treatment with Ig-W, did not. Indeed, the MMS was reduced from 2.5 ± 1.7 in the control mice treated with Ig-MOG without DC transfer to 0.3 ± 0.5 in those recipient of both Ig-MOG and DC transfer. Moreover, the disease remained severe (MMS 2.5 ± 0.5) when Ig-W was used instead of Ig-MOG. These results indicate that FcγR+/+ DCs are able to take up Ig-MOG and establish tolerogenic contact with T cells thus providing a unique model to study the cell dynamics associated with tolerance in vivo.
Figure 1. Agg. Ig-MOG treatment modulates both active and passive EAE.
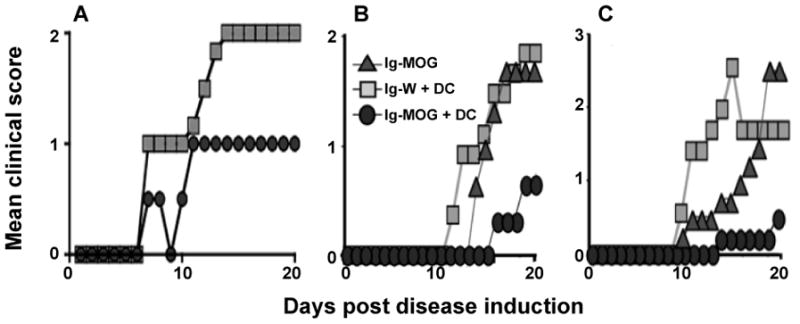
In (A), groups of adult FcγR−/− mice were given i.v. 6 × 10⁶ purified FcγR+/+ DCs and 10 × 106 naïve 2D2 T cells. The next day the mice were given i.p. 600 μg agg Ig-MOG (circles) or control Ig-W (squares). One day later the hosts were induced for active EAE with 300 μg of MOG peptide and monitored daily for signs of paralysis. In (B), groups of FcγR−/− mice were given 6 × 10⁶ purified FcγR+/+ DCs and induced for passive EAE by adoptive transfer of 10 × 106 MOG-activated 2D2 TCR transgenic splenocytes. The next day the mice were treated i.p. with 600 μg agg Ig-MOG (circles) or control Ig-W backbone without MOG peptide (squares) and monitored for signs of paralysis for the duration of the experiment. Groups of mice that did not receive any FcγR+/+ DCs (triangles) were included for comparison purposes. In (C), groups of adult FcγR−/− mice were induced for active EAE with 300 μg of MOG peptide and 4 days later were transferred i.v. with 6 × 10⁶ purified FcγR+/+ DCs. The next day the hosts were treated i.p. with 600 μg agg Ig-MOG (circles) or the control Ig-W (squares). The mice were then monitored for reduction in disease severity for the duration of the experiment. Groups of mice that did not receive any FcγR+/+ DCs (triangles) were included for comparison purposes. Each point represents the mean clinical score of 6–8 mice and is representative of 4 independent experiments.
Kinetics of T cell contact with antigen presenting cells
To determine the site where APCs and naïve T cells interact following administration of Ig- MOG, FcγR−/− mice received SNARF-labeled DC followed 6 hours later by CFSE-labeled 2D2 T cells. Ig-MOG was then administered and cryosections from lymphoid as well as non-lymphoid organs were examined for T cell-DC interactions as an indication of antigen recognition. Few T cells and DCs were observed in the non-lymphoid organs such as the liver, lung, or intestine and these would presumably be transient migrants (30) (Fig. 2). However, T cells and DCs were found abundantly in the spleen and peripheral lymph nodes (Fig. 2). Moreover, there was no apparent difference in the homing of T cells and DCs to these tissues whether the mice received Ig-MOG, control Ig-W, or did not receive antigen at all. Thus, while these results suggest that antigen may not influence trafficking between the lymphoid organs, they do not exclude effects on retention and on contact between specific T cells and APCs.
Figure 2. Assessment of T cell and DC trafficking upon induction of tolerance with agg Ig-MOG.

FcγR−/− mice were given i.v. 6 × 10⁶ SNARF-labeled FcγR+/+ DCs followed 6h later by 10 × 106 CFSE-labeled naïve 2D2 TCR transgenic CD4 T cells. The next day the mice received i.p. 600 μg agg Ig-MOG or Ig-W and 36h later specimens from the liver, lung, intestine, spleen and lymph nodes were harvested. Cryosections were then prepared and examined under UV microscope. Images acquired in red and green channels were overlaid and analyzed for pattern of cellular migration. The data is representative of 3 independent experiments.
Given that Ig-MOG reversed both active and passive EAE, we postulated that a characteristic interaction behavior between T cells and APCs might be associated with T cell tolerance. To test the kinetics of this premise, mice were given dye-labeled T cells and APCs and injected with agg Ig-MOG. Cryosections of the spleen and lymph node were cut and contact between T cells and DCs was assessed by fluorescence microscopy at 12, 36, 60, and 96h post antigen exposure. A contact was defined as the physical apposition of cell membranes as determined by the presence of contiguous pixels from T cells (green channel) and DCs (red channel) (Fig. 3A, insert). While the cells appeared randomly distributed in the control inguinal lymph node they were more clustered in Ig-MOG-treated mice by 36h (Fig. 3A). The findings indicate that T cell – APC contacts were apparent by 12 hours in both the spleen and lymph nodes (Fig. 3B). However, the frequency of T cell-DC contacts was significantly higher 36 hours after antigen injection for the spleen (SP) (p = 0.0028), axillary lymph (Ax.LN) (p = 0.007) and inguinal (In.LN) (p = 0.0005) lymph nodes as compared to the “no antigen” control group. In contrast, the cervical lymph nodes (Cx.LN) did not show an increase in contact frequency (p = 0.35). Contact events decreased by 60 and 96h in all lymph nodes. These results indicate that antigen recognition as evidenced by T cell-DC contacts occurs 36 hours after antigen exposure in organs proximal to the site of injection.
Figure 3. Analysis of T cell-APC contacts by fluorescence microscopy.
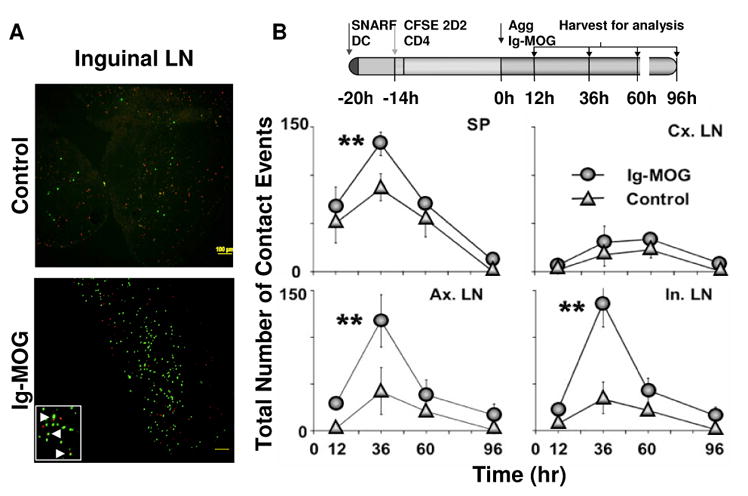
FcγR−/− mice were given i.v. 6 × 10⁶ SNARF-labeled FcγR+/+ DCs followed 6 hours later by 10 × 106 CFSE-labeled naïve 2D2 TCR transgenic CD4 T cells. The next day, the mice received i.p. 600 μg agg Ig- MOG. Cryosections were examined for T cell-DC contact under a UV microscope. Images were acquired in red and green channels and overlaid for analysis of the proximity of red DCs in conjunction with green CD4 T cells. Such proximity events were quantified manually. Untreated mice were included as control. A, Histology images are shown for a section from the inguinal lymph node at 36h to illustrate T cell-APC contacts when the mice are given agg Ig-MOG (lower panel) versus no antigen (upper panel). B, At 12, 36, 60, and 96h after antigen exposure a group of mice was sacrificed and specimens from spleen (sp), cervical (cx), axillary (ax) and inguinal (in) lymph nodes were collected as indicated in the pictogram at the top of the figure. Cryosections prepared from these organs were examined for T cell-DC contact as described above from untreated (control) or agg Ig-MOG (Ig-MOG) recipient mice. Each point represents the number of contacts ± SD of two different experiments. **p values are below 0.05 as analyzed by unpaired, Student t test.
Tolerized T cells display characteristic cell dynamics during antigen recognition
We performed two-photon microscope analyses to evaluate the cell dynamics underlying T cell tolerance. Accordingly, unlabeled DCs and CFSE-dyed T cells were adoptively transferred into FcγR−/− mice and the hosts were given agg Ig-MOG as a tolerogen. Forty-eight hours after Ig- MOG injection, lymph nodes were ex-planted and the T cell motility was visualized by two-photon microscopy (14, 31). Cell tracks were normalized to their starting positions and plotted in Figure 4A (top panel). Under tolerizing conditions, T cell tracks were substantially shorter and had reduced displacement over time compared to naïve T cells. The reduced motility of tolerized T cells is also evident in the snap shot of representative T cells (green) and their non-normalized tracks (yellow) illustrated in Figure 4A (lower panel). The velocity of tolerized T cells (3.934 ± 0.312 μm/min) was significantly lower than that of naïve T cells (8.307 ± 0.777 μm/min, p < 0.001) (Fig. 4B, left panel and Supplemental video 1 and 2). The motility coefficient, which is a measure of how rapidly cells disperse from a given starting point, was also lower in tolerized versus naïve T cells (56.75 ± 7.69 versus 110.2 ± 14 μm2/min, p = 0.0011) (Fig. 4B, right panel). These results indicate that tolerization is associated with reduced T cell motility. The change in T cell motility is consistent with antigen recognition, but contrasts with the cell arrest and clustering observed for activated T cells in other systems (13, 14, 32, 33).
Figure 4. In vivo imaging analysis of tolerized T cells.

In (A) FcγR−/− mice were adoptively transferred with 10 × 106 CFSE-labeled 2D2 CD4+ T cells and 6 × 10⁶ FcγR+/+ DC. The next day the hosts were given i.p. 600 μg agg Ig-MOG tolerogen (TOL) in saline or saline without Ig-MOG (NIL). The axillary and inguinal LNs were harvested at 48h post tolerogen injection and subjected to 2-photon imaging. The behaviors of the 2D2 T cells were analyzed in detail using the Imaris software program (Bitplane). 2-dimensional vectors of T cell movement are depicted with normalization of starting point to center of an XY grid (top panels) of images showing cell tracks (bottom panels). In (B) the graphs illustrate the velocity and motility coefficient of live cells with movement tracks of 8 frames or higher. The scatter plots (top panel) show representative lymph nodes for each condition. The bar graphs (bottom panel) show the cumulative events collected from the lymph nodes of 3 mice per condition. The line represents the mean of analyzed cells. *p<0.05 in comparison to NIL mice as analyzed by unpaired, Student t-test.
Tolerization similar to immunization induces expression of activation markers on T cells
The fact that the T cell dynamics were quantitatively different between tolerance and naïve conditions suggests that the tolerization protocol may be leading to an apoptotic process or eliciting a state of anergy. To test these premises, FcγR−/− mice given FcγR+/+ DCs and SNARF- labeled 2D2 T cells were injected with agg Ig-MOG and their lymph node T cells were analyzed for apoptosis and expression of activation markers. As indicated in Figure 5A, the level of active caspase as measured by Z-VAD binding (26) was not significantly different in naïve versus tolerized T cells (Fig. 5A) indicating that apoptosis may not be the mechanism underlying T cell tolerance. Surprisingly, however, expression of the activation markers CD25 (IL-2Rαchain) and CD44 were significantly increased in tolerized versus control T cells. Indeed, CD25 expression went up from 4% in the control cells to 34% in tolerized T cells while CD44 expression rose from 11 to 34% in control versus tolerized T cells (Fig. 5B). Finally, the T cells displayed reduction in the expression of CD62L, further indicating transition from naïve to an active state (Fig. 5B). This was rather surprising and we sought to compare the activation marker expression of tolerized T cells with those activated by immunization. To test the level of activation, the same experimental design described above was carried out using 600 μg soluble (sol) Ig-MOG plus 33 μg CPG-ODN as an immunizing rather than tolerizing regimen. The results indicate that immunized T cells display the same level of activation as tolerized T cells. Indeed, expression of CD25, CD62L, and CD44 were similar under both tolerizing and immunizing conditions: 34 versus 31% for CD25, 37 versus 31% for CD62L, and 34 versus 33% for CD44 (Fig. 5B). Because these analyses were performed 48 hours after injection of the tolerogen, the up-regulation of CD25 and CD44 may reflect antigen recognition and transient rather than sustained activation. To test this premise, we measured expression of 3 different activation markers: CD25, CD44 and CD69 over a period of 4 days under both tolerizing and immunizing conditions. As indicated in Figure 5C, activation marker expression was up-regulated for 96 hours indicating that the cells are unlikely to undergo anergy. These results indicate that the T cells exposed to tolerogen display an activated phenotype similar to T cells exposed to immunogen.
Figure 5. Tolerized T cells express activation markers and do not undergo apoptosis.

In (A) FcγR−/− mice recipient of 6 × 10⁶ unlabeled FcγR+/+ DC and 10 × 106 SNARF- labeled 2D2 CD4 T cells were given PBS (Nil) or 600 μg agg Ig-MOG (tolerized) the next day. Forty-eight hours later, lymph node cells were stained with ZVAD-FITC. ZVAD binding was analyzed on SNARF+ cells. In (B) FcγR−/− mice recipient of 6 × 10⁶ unlabeled FcγR+/+ DC and 10 × 106 CFSE – labeled 2D2 CD4 T cells were given PBS (No antigen), 600 μg agg Ig-MOG (tolerized), or 600μg sol Ig-MOG plus 33 μg CPG-ODN the next day (immunized). Forty-eight hours later, lymph node cells were stained with antibodies to the activation markers CD25, CD62L and CD44. Activation marker expression was assessed on CFSE+ cells. In (C) both the DC and 2D2 cells were unlabeled and analysis of marker expression was made on Vα3.2+ T cells under both immunizing and tolerizing conditions. The data is representative of 3 independent experiments with 2 mice per condition.
Tolerized T cells produce Th2 cytokines
Since the tolerized T cells expressed activation markers to the same degree as immunized T cells, we investigated the possibility that functional tolerance was perhaps the result of a switch in cytokine expression profile. To test this hypothesis, FcγR−/− mice given FcγR+/+ DCs with or without 2D2 T cells were injected with agg Ig-MOG (tolerogen) or sol Ig-MOG plus CPG-ODN (immunogen) and their lymph node T cells were harvested, stimulated with MOG peptide, and analyzed for cytokine production by ELISA and ELISPOT. The results depicted in Figure 6 indicate that the immunized T cells produced significant amounts of IFNγ (Fig. 6A) and little or no IL-4 or IL-5 cytokines (Fig. 6B and C). Interestingly, the tolerized T cells had minimal IFNγ but produced significant amounts of both IL-4 and IL-5 cytokines. Cytokine production is due to exposure to Ig-MOG because the mice recipient of saline solution did not produce measurable cytokines. The cytokines are produced by the transferred 2D2 cells rather than endogenous T cells because there was no detectable cytokine production in the control group recipient of DC and agg Ig-MOG but no 2D2 T cells (Fig. 6, left panels). Also, cytokine production, whether detected by ELISA or ELISPOT, is induced by Ig-MOG because mice recipient of 2D2 T cells and DCs but no Ig-MOG did not mount significant cytokine responses. Finally, cytokine production is specific because only in vitro stimulation with MOG, but not PLP1, peptide triggered cytokine production (Fig. 6, right panel). Given the specificity of cytokine production and the concordance of the results among the 2 techniques (ELISA and ELISPOT) we are confident that the immunizing conditions induce a Th1-type response while tolerizing conditions result in Th2 responses.
Figure 6. agg Ig-MOG treatment induces Th2 cytokines while sol Ig-MOG induces Th1.

FcγR−/− mice recipient of 6 × 10⁶ unlabeled FcγR+/+ DC alone or in combination with 10 × 106 unlabeled 2D2 CD4 T cells were on the next day given saline, 600 μg agg Ig-MOG (Agg), or 600 μg sol Ig-MOG (Sol) plus 33 μg CPG-ODN (CpG). Forty-eight hours later, lymph node cells were stimulated in vitro with 30 μg/ml MOG peptide (Filled bars) or 15 μg/ml PLP1 peptide as control (open bars) in the absence or presence of 20 μg/ml anti-IL-4R antibody (αIL-4R) (left column). In this case anti-IL-4R is used to prevent reabsorption by T cells. Cytokine production was measured by ELISA (left column) and ELISPOT (right column) for IFNγ (A), IL-5 (B), and IL-4 (C) as described in materials and methods. Each bar represents the mean ± SD of triplicate wells from 3 to 4 mice. N.D, not done.
Immune Th1 and tolerant Th2 cells display different cell dynamics upon exposure to Ag
We compared the T cell dynamics associated with antigen recognition by Th1 cells after immunization and Th2 cells following tolerance induction in our model. Unlabeled DCs and CFSE-dyed T cells were adoptively transferred into FcγR−/− mice and the hosts were given agg Ig-MOG as a tolerogen or sol Ig-MOG plus CPG-ODN as an immunogen. Thirty-six hours after Ig-MOG injection, lymph nodes were harvested and T cells imaged by two-photon microscopy. T cell tracking analysis revealed a significant difference in the velocity of the immunized (3.352 ± 0.221 μm/min) as compared to tolerized (6.377 ± 0.487 μm/min, p< 0.0001), and naïve (8.061 ± 0.504 μm/min, p<0.0001) T cells (Fig. 7A). Interestingly, the tolerized T cells also appeared to decrease their velocity relative to the naïve control (p=0.0476) suggesting that they may be involved in short duration contacts with DCs, similar to what has been previously demonstrated for tolerogenic T cell responses (16, 17). Also, the motility coefficient was significantly lower for the immunized T cells (32.7 ± 5.9 μm2/min) as compared to the tolerized (75.4 ± 8.2 μm2/min, p=0.0004) and naïve (161.8 ± 31.23 μm2/min, p=0.0132) (Fig. 7B). Moreover, there was a significant decrease in the meandering index (MI) of immunized T cells (0.2909 ± 0.026), as compared to tolerized T cells (0.6194 ± 0.0313, p<0.0001) and the naïve T cells (0.5372 ± 0.0244, p<0.0001) (Fig. 7C), indicating that immunized T cells make fewer turns and migrate with straighter paths. Representative image recordings of T cell motility presented in supplemental videos 3, 4, and 5 clearly show reduced T cell velocity following immunization. These results indicate that the T cell dynamics related to tolerance are distinct from those that occur during T cell priming with immunization. Specifically, tolerized cells display intermediate velocity between primed and naïve cells. Moreover, as T cells exposed to the immunogen displayed a Th1 phenotype while those exposed to the tolerogen had a Th2 phenotype, the results suggest that there are previously unappreciated differences in the cell dynamics associated with T helper cell subsets (Fig. 6 and 7).
Figure 7. Differential motility kinetics between immune Th1 and tolerant Th2 cells.

FcγR−/− mice were adoptively transferred with 10 × 106 CFSE-labeled 2D2 CD4+ T cells and 6 × 10⁶ FcγR+/+ DC. The next day the hosts were given i.p. 600 μg agg Ig-MOG tolerogen in saline (TOL), 600 μg sol Ig-MOG plus 33μg CPG-ODN in saline (IMM), or saline without Ig-MOG (NIL). The axillary and inguinal LNs were harvested at 36hr post antigen injection and subjected to 2-photon imaging. The behaviors of the 2D2 T cells were analyzed in detail using the Imaris software program (Bitplane). The graphs illustrate the (A) velocity, (B) motility coefficient, and (C) meandering index of live cells with movement tracks of 8 frames or higher. The scatter plots show representative lymph nodes for each condition. The bar graphs show the cumulative events collected from the lymph nodes of 3 mice per condition. The line represents the mean of analyzed cells. *p<0.05 as analyzed by one-way ANOVA.
Discussion
Presentation of antigen by non-professional APCs residing in non-lymphoid organs was for long viewed as a major mechanism for peripheral T cell tolerance (34). The study presented in this report shows that exposure to tolerogen in vivo leads to contact between the target T cells and APCs rather in lymphoid tissues with minimal interactions in non-lymphoid organs such as the liver, lung or intestinal wall (Fig. 2). Moreover, such interactions lead to modulation of naïve T cells and suppression of EAE (Fig. 1). Also, the tolerogenic contacts, like immunogenic interactions, take place in lymph nodes (inguinal and axillary) close to the portal of tolerogen entry and had defined kinetics beginning at 12 hours, maximizing at 36h and weaning by 96h post tolerogen administration (Fig. 3). While it takes longer than usual for the DCs and T cells to establish contact, which is probably related to FcγR internalization and delayed processing (35), the observation was intriguing and prompted us to examine the dynamics underlying tolerogenic T cell-APC contacts. Two-photon microscopy revealed differences in T cell behavior during immunization and tolerization, perhaps reflecting the strength or the quality of the antigen recognition event. Tolerized T cells displayed lower velocity and traveled shorter distances in comparison with cells that have not been exposed to tolerogen, but were generally more motile than cells stimulated under immunization conditions (Fig. 4 and 7). Initially, this was not surprising as the cells could be undergoing a state of anergy or apoptosis. However, a follow up investigation indicated that the T cells were neither apoptotic nor anergic but expressed markers indicative of T cell activation (Fig. 5). Despite the expression of CD25, these activated T cells could not be T regulatory cells (Tregs) because they did not express FoxP3 (not shown) and did not preserve CD62L (Fig. 5). However, cytokine production analysis indicated that they produced both IL-4 and IL-5 upon stimulation with antigen and this was due to treatment with agg Ig-MOG because when the regimen was substituted with sol Ig-MOG plus CPG-ODN (immunogenic regimen) the cells produced IFNγ instead (Fig. 6). Deviation from a pathogenic (Th1) to an anti-inflammatory (Th2) phenotype by treatment with antagonist peptide was previously shown to suppress EAE (5, 6). However, agg Ig-MOG carries an agonist MOG peptide and deviation of T cells was surprising. This model, though, provided an opportunity to compare the dynamics of Th2 cells in a tolerance setting not only to naïve T cells but also to Th1 lymphocytes driven by an immunogenic regimen (sol Ig-MOG plus CPG-ODN). Indeed, when the movement of tolerant T cells was compared to those displayed by immune T lymphocytes the velocity, meandering index, and motility coefficient were higher for tolerant Th2 versus immune Th1 cells. (Fig. 7, Supplemental videos 3, 4, and 5). At 36h post antigen exposure the immune T cells traveled shorter distances at lower speed with a more directed movement than both Th2 and naïve T cells (Fig. 7). These observations are in agreement with prior studies showing that T cell activation triggers cell arrest and clustering (13, 14), which is related to blast formation and progressive cell division and differentiation to Th1 cells (36) By 48 hours, the Th1 cells migrated out of the lymph node and could not be recovered for cell dynamic analysis, yet the tolerance-driven Th2 cells were still present and showed reduced motility relative to naïve T cells. Because secretion of IFNγ by Th1 cells follows the synapse targeted pathway while IL-4 production by Th2 cells uses multiple random exocrine pathways (37), this functional difference may be responsible for the discrepancy in early cell dynamics among Th1 and Th2 cells. In fact, the Th1 cells produced nanogram quantities of IFNγ while the Th2 cells secreted IL-4 and IL-5 in picogram quantities despite similar frequency in cytokine producing cells (Fig. 6). The findings are consistent with earlier reports indicating T cells that traffic to the T zone boundary display increased motility (38).
Overall, the study presented here demonstrates that T cell tolerance takes place within lymphoid organs and is performed by professional dendritic cells in our EAE model. Moreover, Th2 cells display distinct motility characteristics compared to immune Th1 cells despite having similar activation states.
Recognition of antigen, whether under immunogenic or tolerogenic regimens, induces slower T cell motility (13–15, 32, 33, 39). Although the T cell dynamic may depend on the APC phenotype, the APC activation state, chemokine environment, or the mode of antigen delivery, decreased motility was commonly observed during antigen recognition (17, 28, 38–40). Even during thymic education a slow motility ensued for thymocyte selection to occur (41). The findings reported here extend these observations to Th2 T cell dynamics. Although Th2 cells displayed a reduction in motility after antigen recognition, Th2 cells had higher overall migration speeds and took longer to exhibit changes in their motility than Th1 cells induced by immunization. Both Th1 immunity and Th2 tolerance alter T cell migration upon antigen recognition, but the kinetics of this effect differ among the subsets. To which extent this difference in subset behavior might be related to alterations in the chemotactic environment, the strength of cell-cell contact as a result of differential costimulation, the specific T helper cell function or epigenetic characteristics of the T cell (19) is an avenue for future studies.
Supplementary Material
Acknowledgments
Funding: This work was supported by grants RO1NS057194 and RO1NS037406 (to HZ) from NINDS, by the J. Lavenia Edwards Chair endowment (to HZ), by grant RO1AI077600 (to MJM) from NIAID, and by grant K26 RR018811 (CLF) from NIH. C. M. H. was supported by a training grant GM008396 from NIGMS. J.A.C and D.M.T. were supported by Life Sciences fellowships from the University of Missouri.
Abbreviations
- Agg
aggregated
- BFA
Brefeldin A
- CpG-ODN
oligodeoxynucleoties
- EAE
experimental allergic encephalomyelitis
- LN
lymph nodes
- AxLN
axillary LN
- CxLN
cervical LN
- InLN
inguinal LN
- MMCS
mean maximal clinical score
- MI
meandering index
- MOG
myelin oligodendrocyte glycoprotein
- PLP
proteolipid protein
- SP
spleen
- SNARF
5-(and-6)-carboxy seminaphthorhodafluor-1
- sol
soluble
- Tg
transgenic
- Treg
T regulatory cell
References
- 1.Walker LS, Abbas AK. The enemy within: keeping self-reactive T cells at bay in the periphery. (Translated from eng) Nat Rev Immunol. 2002;2(1):11–19. doi: 10.1038/nri701. (in eng) [DOI] [PubMed] [Google Scholar]
- 2.Critchfield JM, et al. T cell deletion in high antigen dose therapy of autoimmune encephalomyelitis. (Translated from eng) Science. 1994;263(5150):1139–1143. doi: 10.1126/science.7509084. (in eng) [DOI] [PubMed] [Google Scholar]
- 3.Gaur A, Wiers B, Liu A, Rothbard J, Fathman CG. Amelioration of autoimmune encephalomyelitis by myelin basic protein synthetic peptide-induced anergy. (Translated from eng) Science. 1992;258(5087):1491–1494. doi: 10.1126/science.1279812. (in eng) [DOI] [PubMed] [Google Scholar]
- 4.Jenkins MK, Pardoll DM, Mizuguchi J, Quill H, Schwartz RH. T-cell unresponsiveness in vivo and in vitro: fine specificity of induction and molecular characterization of the unresponsive state. (Translated from eng) Immunol Rev. 1987;95:113–135. doi: 10.1111/j.1600-065x.1987.tb00502.x. (in eng) [DOI] [PubMed] [Google Scholar]
- 5.Brocke S, et al. Treatment of experimental encephalomyelitis with a peptide analogue of myelin basic protein. (Translated from eng) Nature. 1996;379(6563):343–346. doi: 10.1038/379343a0. (in eng) [DOI] [PubMed] [Google Scholar]
- 6.Nicholson LB, Greer JM, Sobel RA, Lees MB, Kuchroo VK. An altered peptide ligand mediates immune deviation and prevents autoimmune encephalomyelitis. (Translated from eng) Immunity. 1995;3(4):397–405. doi: 10.1016/1074-7613(95)90169-8. (in eng) [DOI] [PubMed] [Google Scholar]
- 7.Vignali DA, Collison LW, Workman CJ. How regulatory T cells work. (Translated from eng) Nat Rev Immunol. 2008;8(7):523–532. doi: 10.1038/nri2343. (in eng) [DOI] [PMC free article] [PubMed] [Google Scholar]
- 8.Hugues S, Boissonnas A, Amigorena S, Fetler L. The dynamics of dendritic cell-T cell interactions in priming and tolerance. (Translated from eng) Curr Opin Immunol. 2006;18(4):491–495. doi: 10.1016/j.coi.2006.03.021. (in eng) [DOI] [PubMed] [Google Scholar]
- 9.Legge KL, et al. On the role of dendritic cells in peripheral T cell tolerance and modulation of autoimmunity. (Translated from eng) J Exp Med. 2002;196(2):217–227. doi: 10.1084/jem.20011061. (in eng) [DOI] [PMC free article] [PubMed] [Google Scholar]
- 10.Germain RN, Miller MJ, Dustin ML, Nussenzweig MC. Dynamic imaging of the immune system: progress, pitfalls and promise. (Translated from eng) Nat Rev Immunol. 2006;6(7):497–507. doi: 10.1038/nri1884. (in eng) [DOI] [PubMed] [Google Scholar]
- 11.Henrickson SE, et al. T cell sensing of antigen dose governs interactive behavior with dendritic cells and sets a threshold for T cell activation. (Translated from eng) Nat Immunol. 2008;9(3):282–291. doi: 10.1038/ni1559. (in eng) [DOI] [PMC free article] [PubMed] [Google Scholar]
- 12.Skokos D, et al. Peptide-MHC potency governs dynamic interactions between T cells and dendritic cells in lymph nodes. (Translated from eng) Nat Immunol. 2007;8(8):835–844. doi: 10.1038/ni1490. (in eng) [DOI] [PubMed] [Google Scholar]
- 13.Mempel TR, Henrickson SE, Von Andrian UH. T-cell priming by dendritic cells in lymph nodes occurs in three distinct phases. (Translated from eng) Nature. 2004;427(6970):154–159. doi: 10.1038/nature02238. (in eng) [DOI] [PubMed] [Google Scholar]
- 14.Miller MJ, Safrina O, Parker I, Cahalan MD. Imaging the single cell dynamics of CD4+ T cell activation by dendritic cells in lymph nodes. (Translated from eng) J Exp Med. 2004;200(7):847–856. doi: 10.1084/jem.20041236. (in eng) [DOI] [PMC free article] [PubMed] [Google Scholar]
- 15.Miller MJ, Wei SH, Parker I, Cahalan MD. Two-photon imaging of lymphocyte motility and antigen response in intact lymph node. (Translated from eng) Science. 2002;296(5574):1869–1873. doi: 10.1126/science.1070051. (in eng) [DOI] [PubMed] [Google Scholar]
- 16.Hugues S, et al. Distinct T cell dynamics in lymph nodes during the induction of tolerance and immunity. (Translated from eng) Nat Immunol. 2004;5(12):1235–1242. doi: 10.1038/ni1134. (in eng) [DOI] [PubMed] [Google Scholar]
- 17.Zinselmeyer BH, et al. In situ characterization of CD4+ T cell behavior in mucosal and systemic lymphoid tissues during the induction of oral priming and tolerance. (Translated from eng) J Exp Med. 2005;201(11):1815–1823. doi: 10.1084/jem.20050203. (in eng) [DOI] [PMC free article] [PubMed] [Google Scholar]
- 18.Tadokoro CE, et al. Regulatory T cells inhibit stable contacts between CD4+ T cells and dendritic cells in vivo. (Translated from eng) J Exp Med. 2006;203(3):505–511. doi: 10.1084/jem.20050783. (in eng) [DOI] [PMC free article] [PubMed] [Google Scholar]
- 19.Tang Q, et al. Visualizing regulatory T cell control of autoimmune responses in nonobese diabetic mice. (Translated from eng) Nat Immunol. 2006;7(1):83–92. doi: 10.1038/ni1289. (in eng) [DOI] [PMC free article] [PubMed] [Google Scholar]
- 20.Bettelli E, et al. Myelin oligodendrocyte glycoprotein-specific T cell receptor transgenic mice develop spontaneous autoimmune optic neuritis. (Translated from eng) J Exp Med. 2003;197(9):1073–1081. doi: 10.1084/jem.20021603. (in eng) [DOI] [PMC free article] [PubMed] [Google Scholar]
- 21.Bernard CC, et al. Myelin oligodendrocyte glycoprotein: a novel candidate autoantigen in multiple sclerosis. (Translated from eng) J Mol Med. 1997;75(2):77–88. doi: 10.1007/s001090050092. (in eng) [DOI] [PubMed] [Google Scholar]
- 22.Tuohy VK, Lu Z, Sobel RA, Laursen RA, Lees MB. Identification of an encephalitogenic determinant of myelin proteolipid protein for SJL mice. (Translated from eng) J Immunol. 1989;142(5):1523–1527. (in eng) [PubMed] [Google Scholar]
- 23.Legge KL, Min B, Potter NT, Zaghouani H. Presentation of a T cell receptor antagonist peptide by immunoglobulins ablates activation of T cells by a synthetic peptide or proteins requiring endocytic processing. (Translated from eng) J Exp Med. 1997;185(6):1043–1053. doi: 10.1084/jem.185.6.1043. (in eng) [DOI] [PMC free article] [PubMed] [Google Scholar]
- 24.Legge KL, et al. Coupling of peripheral tolerance to endogenous interleukin 10 promotes effective modulation of myelin-activated T cells and ameliorates experimental allergic encephalomyelitis. (Translated from eng) J Exp Med. 2000;191(12):2039–2052. doi: 10.1084/jem.191.12.2039. (in eng) [DOI] [PMC free article] [PubMed] [Google Scholar]
- 25.Inaba K, et al. Granulocytes, macrophages, and dendritic cells arise from a common major histocompatibility complex class II-negative progenitor in mouse bone marrow. (Translated from eng) Proc Natl Acad Sci U S A. 1993;90(7):3038–3042. doi: 10.1073/pnas.90.7.3038. (in eng) [DOI] [PMC free article] [PubMed] [Google Scholar]
- 26.Li L, et al. IL-4 utilizes an alternative receptor to drive apoptosis of Th1 cells and skews neonatal immunity toward Th2. (Translated from eng) Immunity. 2004;20(4):429–440. doi: 10.1016/s1074-7613(04)00072-x. (in eng) [DOI] [PubMed] [Google Scholar]
- 27.Bell JJ, et al. In trans T cell tolerance diminishes autoantibody responses and exacerbates experimental allergic encephalomyelitis. (Translated from eng) J Immunol. 2008;180(3):1508–1516. doi: 10.4049/jimmunol.180.3.1508. (in eng) [DOI] [PubMed] [Google Scholar]
- 28.Lindquist RL, et al. Visualizing dendritic cell networks in vivo. (Translated from eng) Nat Immunol. 2004;5(12):1243–1250. doi: 10.1038/ni1139. (in eng) [DOI] [PubMed] [Google Scholar]
- 29.Miller MJ, Hejazi AS, Wei SH, Cahalan MD, Parker I. T cell repertoire scanning is promoted by dynamic dendritic cell behavior and random T cell motility in the lymph node. (Translated from eng) Proc Natl Acad Sci U S A. 2004;101(4):998–1003. doi: 10.1073/pnas.0306407101. (in eng) [DOI] [PMC free article] [PubMed] [Google Scholar]
- 30.Ley K, Kansas GS. Selectins in T-cell recruitment to non-lymphoid tissues and sites of inflammation. (Translated from eng) Nat Rev Immunol. 2004;4(5):325–335. doi: 10.1038/nri1351. (in eng) [DOI] [PubMed] [Google Scholar]
- 31.Stoll S, Delon J, Brotz TM, Germain RN. Dynamic imaging of T cell-dendritic cell interactions in lymph nodes. (Translated from eng) Science. 2002;296(5574):1873–1876. doi: 10.1126/science.1071065. (in eng) [DOI] [PubMed] [Google Scholar]
- 32.Bousso P, Robey EA. Dynamic behavior of T cells and thymocytes in lymphoid organs as revealed by two-photon microscopy. (Translated from eng) Immunity. 2004;21(3):349–355. doi: 10.1016/j.immuni.2004.08.005. (in eng) [DOI] [PubMed] [Google Scholar]
- 33.Shakhar G, et al. Stable T cell-dendritic cell interactions precede the development of both tolerance and immunity in vivo. (Translated from eng) Nat Immunol. 2005;6(7):707–714. doi: 10.1038/ni1210. (in eng) [DOI] [PMC free article] [PubMed] [Google Scholar]
- 34.Mitchison NA, Katz DR, Chain B. Self/nonself discrimination among immunoregulatory (CD4) T cells. (Translated from eng) Semin Immunol. 2000;12(3):179–183. doi: 10.1006/smim.2000.0229. discussion 257–344 (in eng) [DOI] [PubMed] [Google Scholar]
- 35.Bergtold A, Desai DD, Gavhane A, Clynes R. Cell surface recycling of internalized antigen permits dendritic cell priming of B cells. (Translated from eng) Immunity. 2005;23(5):503–514. doi: 10.1016/j.immuni.2005.09.013. (in eng) [DOI] [PubMed] [Google Scholar]
- 36.Bird JJ, et al. Helper T cell differentiation is controlled by the cell cycle. (Translated from eng) Immunity. 1998;9(2):229–237. doi: 10.1016/s1074-7613(00)80605-6. (in eng) [DOI] [PubMed] [Google Scholar]
- 37.Huse M, Lillemeier BF, Kuhns MS, Chen DS, Davis MM. T cells use two directionally distinct pathways for cytokine secretion. (Translated from eng) Nat Immunol. 2006;7(3):247–255. doi: 10.1038/ni1304. (in eng) [DOI] [PubMed] [Google Scholar]
- 38.Okada T, et al. Antigen-engaged B cells undergo chemotaxis toward the T zone and form motile conjugates with helper T cells. (Translated from eng) PLoS Biol. 2005;3(6):e150. doi: 10.1371/journal.pbio.0030150. (in eng) [DOI] [PMC free article] [PubMed] [Google Scholar]
- 39.Bhakta NR, Oh DY, Lewis RS. Calcium oscillations regulate thymocyte motility during positive selection in the three-dimensional thymic environment. (Translated from eng) Nat Immunol. 2005;6(2):143–151. doi: 10.1038/ni1161. (in eng) [DOI] [PubMed] [Google Scholar]
- 40.Castellino F, et al. Chemokines enhance immunity by guiding naive CD8+ T cells to sites of CD4+ T cell-dendritic cell interaction. (Translated from eng) Nature. 2006;440(7086):890–895. doi: 10.1038/nature04651. (in eng) [DOI] [PubMed] [Google Scholar]
- 41.Witt CM, Raychaudhuri S, Schaefer B, Chakraborty AK, Robey EA. Directed migration of positively selected thymocytes visualized in real time. (Translated from eng) PLoS Biol. 2005;3(6):e160. doi: 10.1371/journal.pbio.0030160. (in eng) [DOI] [PMC free article] [PubMed] [Google Scholar]
Associated Data
This section collects any data citations, data availability statements, or supplementary materials included in this article.