Network analysis provides powerful tools for studying interactions (represented by edges) between a large number of entities (nodes). Various methods can be used to identify subgraphs known as communities, which are groups of nodes that are densely connected to each other.1 Because networks can be large, coarse-graining into communities facilitates subsequent investigation of structural organization.
The field of graph visualization is enormous,2 so we restrict our attention to modifying the Kamada–Kawai3 (KK) and Fruchterman–Reingold4 (FR) force-directed layout algorithms to include community information. FR is closely related to modularity maximization,5 one of the main approaches employed for identifying communities. However, it does not resolve the community structure when the number of communities exceeds the spatial dimension of visualization (the usual case). We incorporate a specified community structure (however obtained) into similar layouts.
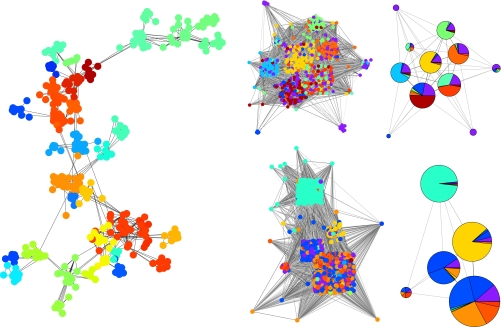
In our visualizations,6 we identified communities of the largest connected components of graphs using a spectral modularity-optimization algorithm.7 We place the centers of these communities using FR, treating communities as the nodes of a (significantly smaller) network with rescaled intercommunity links. We use KK to obtain relative placements of nodes within each community (ignoring intercommunity links). Combining these coordinates, we then use the same KK force rules to rotate (and flip, if necessary) individual communities for optimal placement relative to nodes in the other communities (including intercommunity links), maintaining the specified community center positions.
We illustrate our procedure with three examples in Fig. 1. On the left is a graph of network scientists connected by paper co-authorship,7 colored by a community assignment. On the right are Facebook networks, defined by self-identified, reciprocal online friendships:8 the Caltech network colored by ‘‘House’’ (dorm) affiliation (top); and the Haverford network colored by class year (bottom). Similarly positioned community-level pie charts further illustrate the demographic organization of the Facebook networks.9
Figure 1.
References
- Porter M. A., Onnela J.-P., and Mucha P. J., Not. Am. Math. Soc. 56, 1082 (2009); [Google Scholar]; Porter M. A., Onnela J.-P., and Mucha P. J., Not. Am. Math. Soc. 56, 1164 (2009). [Google Scholar]
- Kolaczyk E., Statistical Analysis of Network Data: Methods and Models (Springer-Verlag, New York, NY, 2009), Chap. 3. [Google Scholar]
- Kamada T. and Kawai S., Inf. Process. Lett. 3, 7 (1989). 10.1016/0020-0190(89)90102-6 [DOI] [Google Scholar]
- Fruchterman T. M. J. and Reingold E. M., Softw.: Pract. Exp. 21, 1129 (1991). 10.1002/spe.4380211102 [DOI] [Google Scholar]
- Noack A., Phys. Rev. E 79, 026102 (2009). 10.1103/PhysRevE.79.026102 [DOI] [PubMed] [Google Scholar]
- Code available at http://netwiki.amath.unc.edu/VisComms.
- Newman M. E. J., Phys. Rev. E 74, 036104 (2006). 10.1103/PhysRevE.74.036104 [DOI] [Google Scholar]
- Traud A. L., Kelsic E. D., Mucha P. J., and Porter M. A., “Community structure in online collegiate social networks,” arXiv:0809.0960, 2008.
- We thank Mark Newman, Adam D'Angelo, and Facebook for providing data; Eric Kelsic for preliminary work; and Aaron Clauset for valuable insight. This research was supported by the National Science Foundation (Contract Nos. HRD-0450099 and DMS-0645369) and the James S. McDonnell Foundation (Contract No. 220020177).


