

Abstract
Although neurogenesis in the embryo proceeds in a region- or lineage-specific fashion coincident with neuropeptide expression, a regulatory role for G protein-coupled receptors (GPCR) remains undefined. Pituitary adenylate cyclase activating polypeptide (PACAP) stimulates sympathetic neuroblast proliferation, whereas the peptide inhibits embryonic cortical precursor mitosis. Here, by using ectopic expression strategies, we show that the opposing mitogenic effects of PACAP are determined by expression of PACAP receptor splice isoforms and differential coupling to the phospholipase C (PLC) pathway, as opposed to differences in cellular context. In embryonic day 14 (E14) cortical precursors transfected with the hop receptor variant, but not cells transfected with the short variant, PACAP activates the PLC pathway, increasing intracellular calcium and eliciting translocation of protein kinase C. Ectopic expression of the hop variant in cortical neuroblasts transforms the antimitotic effect of PACAP into a promitogenic signal. Furthermore, PACAP promitogenic effects required PLC pathway function indicated by antagonist U-73122 studies in hop-transfected cortical cells and native sympathetic neuroblasts. These observations highlight the critical role of lineage-specific expression of GPCR variants in determining mitogenic signaling in neural precursors.
The production of new neurons, or neurogenesis, is controlled in part by locally secreted factors that regulate proliferation (1–5). Ligands for G protein-coupled receptors (GPCR) may play significant roles in neurogenesis in a regionally or developmentally specific fashion (6–9). The neuropeptide PACAP (pituitary adenylate cyclase activating polypeptide ) exhibits either positive or negative mitogenic effects depending on the neuroblast (10–12). The basis of these opposite effects is undefined, but may be due to differential expression of PACAP receptor isoforms and consequent activation of distinct signal transduction pathways. Alternatively, lineage-specific responses may be determined by other aspects of cellular context, including arrays of G proteins or other signal transduction molecules. In the present study, we examined the role of PACAP receptor isoforms in mitogenic regulation.
Three PACAP receptor genes have been cloned (13): PAC1 is PACAP selective, and activated by nanomolar concentrations, although micromolar vasoactive intestinal peptide (VIP) is a heterologous ligand. In contrast, VPAC1 and VPAC2 exhibit similar affinities for PACAP and VIP. These three heptahelical GPCR family members all couple positively to adenylate cyclase (AC). Significantly, rats (14) and humans (15) exhibit PAC1 splice variants that differ in the third intracellular loop, a region classically involved in specific G protein interactions that link to second messenger pathways (16). In transfected cell lines, the absence (“short” isoform) or presence of either one or two 28-aa cassettes, designated “hip” and “hop,” in the third intracellular loop regulates coupling to phosphoinositide-specific phospholipase C (PLC), although data regarding hop function conflict (14, 15). In primary neuroblasts, we previously defined region-specific mitogenic effects of PACAP, which may be attributed to receptor isoforms (17). For example, in embryonic hindbrain (11) and cortical neuroblasts (10, 17), which express the short variant, PACAP stimulates AC only and elicits mitotic inhibition. In contrast, in sympathetic neuroblasts, which express the hop variant, PACAP activates both AC and PLC pathways and stimulates precursor mitosis (12, 17). Thus, alternative usage of the hop exon may determine receptor intracellular signaling and mitogenic response. In nonneural cells, GPCRs produce changes in cAMP, phospholipases C and D, cytosolic Ca2+, and the protein kinase C (PKC) family, all of which putatively regulate mitogenesis (18–20). Although recent studies suggest GPCRs may regulate neural proliferation (21–23), a direct link of receptor isoform to second messenger and resultant mitogenic response remains undefined. Alternatively, receptor isoform may be relatively unimportant, with cellular responses dependent on lineage-specific pools of intracellular proteins and cell type-specific interactions among receptors and different signaling pathways (24–27).
The present study tests the hypothesis that PAC1 isoform plays a pivotal role in coupling and activation of specific pathways leading to opposite mitogenic actions in neural precursors. Ectopic expression of short or hop variants in embryonic day 14 (E14) cortical precursors established differential signaling and elicited negative and positive mitogenic regulation, respectively.
Methods
Cultures.
E14 rat cortical cells (10) were plated on poly-d-lysine (0.1 mg/ml)/laminin (20 μg/ml)-coated glass coverslips at 4–8 × 10⁴ cells/cm2 in defined medium [Neurobasal/B27 (from BRL), 2 mM glutamine, penicillin (25 units/ml), streptomycin (25 μg/ml), BSA (0.1%)] with basic fibroblast growth factor (bFGF) (10 ng/ml). E16 sympathetic neuroblasts were seeded at 3 × 10⁴ cells per well (24-multiwell) (12). Cultures were maintained in a humidified 5% CO2/air incubator at 37°C. For each experiment, one litter of 10–14 embryos was used.
cDNA Transfection.
Cells were transfected with plasmids containing CMV-based mammalian expression vectors: reporter cDNAs encoding enhanced green fluorescent protein (EGFP) (pEGFP-N1 or pPKCγ-EGFP; CLONTECH) and cDNAs encoding PAC1short or PAC1hop1 (14) (provided by L. Journot, Centre Nationale de la Recherche Scientifique, Montpellier, France). Functionality of PAC1 expression plasmids was tested in COS-7 cells: both isoforms mediated PACAP-induced phosphorylation of nuclear cAMP response element-binding protein (CREB), whereas GFP-transfected cells did not respond to PACAP (PAC1short = 43 ± 5; PAC1hop = 28 ± 8; GFP = 3 ± 1; mean % ± SEM of cells exhibiting P-CREB immunoreactivity after 15 min PACAP). Eight to twelve hours after plating, cortical cells were cotransfected with GFP/PAC1 cDNAs in ratio of 1:4, with Lipofectamine Plus (BRL) for 5 h. After transfection, cells were incubated in medium for 1–4 additional days, representing 2–5 days in vitro (DIV). Cultures received vehicle or 10 nM PACAP daily from 2–5 DIV, and were fixed 6 h after the last treatment.
Immunocytochemistry.
After 4% paraformaldehyde fixation (20 min), immunocytochemistry was performed with antibodies to precursor markers vimentin and nestin [1:1000; developed by S. Hockfield and provided by Developmental Studies Hybridoma Bank (DSHB), University of Iowa, Iowa City], neuronal markers tau (1:10000; I. Fischer, Medical College of Philadelphia) and βIII tubulin (1:1000; TuJ1, clone TU-20, Biogenesis, Poole, U.K.), astrocyte glial fibrillary acidic protein (GFAP, 1:1,000; Dako), oligodendrocyte marker Rip1 (1:1000, DSHB), and PAC1 (1:2500; A. Arimura, Tulane University, New Orleans) as described (10). Staining was visualized by using Vectastain ABC Kit or FITC- or Texas Red-conjugated secondary antibodies (1:100; Vector Laboratories). To double label GFP-expressing cells with S phase marker BrdUrd, cultures exposed to BrdUrd (10 μM) during the final 2 h of incubation were incubated with anti-GFP polyclonal antibody (1:5,000; Chemicon) and FITC-secondary with 0.03% Triton-X. Cells were fixed again and exposed to 2 M HCl (30 min), rinsed twice in PBS, incubated with monoclonal anti-BrdUrd (1:100; Beckton Dickinson), followed by Texas Red-secondary (10). The BrdUrd labeling index [i.e., proportion of GFP-immunoreactive (IR) cells incorporating BrdUrd] was determined by scoring 100–200 cells from ten randomly selected fields in one or two dishes per group in five experiments.
Calcium Imaging.
The [Ca2+]i in cultured neuroblasts was monitored by using Fura-2 ratio imaging (12). Briefly, cortical cells on 25-mm glass coverslips were incubated with culture medium containing 8 μM Fura-2/acetoxymethyl ester (AM; Calbiochem) and 5% FBS (BRL) for 30 min at 37°C. Changes in [Ca2+]i at room temperature were directly estimated from ratios of Fura-2 emission at 510 nm with alternate excitation wavelengths of 340 and 380 nm, using radiometric imaging (Attofluor, Atto Instruments, Rockville, MD). To select GFP-transfected cells, illumination with a Bio-Rad MRC-600 argon laser (488 nm excitation and 515 nm emission) was used. Cells were first exposed to 10 nM PACAP, and then to 25 mM KCl (five independent cultures).
PKCγ-GFP Translocation.
Cells were transfected with PKCγ-GFP alone or in combination with PAC1 isoforms. GFP immunoreactivity was localized after 0.2 μM PMA (phorbol 12-myristate 13-acetate) or 10 nM PACAP treatment for 0 s, 45 s, 3 min, and 15 min. The percent of cells exhibiting translocated PKCγ-GFP after 45 s of PACAP was scored in 50 cells per group (PKCγ-GFP, PKCγ-GFP/PAC1short, and PKCγ-GFP/PAC1hop) in each of three experiments.
Cell Survival and Proliferation.
To analyze cell survival, GFP-IR cells were scored in five fields at 32× at 2 and 3 DIV, 6 h after the last daily PACAP treatment (three coverslips per group, two experiments). To quantify proliferation, transfected cultures (two coverslips per group, four experiments) were treated daily with PACAP for 4 days. GFP-IR cells were assessed at 5 DIV in 20 fields at 25×. GFP-IR clones were defined as groups of ≥4 cells, each within five cell bodies of another labeled cell. Clones were counted in ten fields at 10×.
DNA Synthesis.
Incorporation of [3H]thymidine ([3H]dT) was used to assess DNA synthesis in native sympathetic neuroblasts (12, 32). After plating, neuroblasts were treated with 10 μM PLC antagonist U-73122 or inactive isomer U-73343 for 30 min followed by vehicle or 10 nM PACAP for 6 h. Cells were incubated with [3H]dT during the final 2 h of incubation and incorporation assayed by scintillation spectroscopy (12). Experiments were performed three times, with three to four samples per group per experiment.
Materials.
PACAP was from American Peptide Company (Sunnyvale, CA), bFGF was a gift of Scios (Mountain View, CA), BrdUrd was from Sigma, and U-73122, U-73343, and PMA were from Biomol (Plymouth Meeting, PA). Two-way ANOVA, one-way ANOVA followed by Sheffe's post hoc test, or unpaired t test were performed by using the statview program.
Results
Characterization of the Cell Culture.
To define proliferative effects of receptor isoforms, we used conditions that maintained precursor proliferation, including high cell density, laminin-coated glass coverslips, and enriched serum-free medium. These conditions contrast with our previous model, in which most cells exited the cell cycle and expressed neuronal marker MAP2 by 2 DIV (10). In this modified system, 45–55% of cells at 2 DIV expressed nestin (Fig. 1) and vimentin (data not shown), neuroepithelial markers of mitotically active neural precursors (28). The balance of the population expressed β tubulin III (TuJ1), an early marker of neocortical neurons (29) and axonal filament tau (Fig. 1). In contrast, cells did not exhibit glial antigens, which include markers of mature astrocytes [glial fibrillary acidic protein (GFAP)] and the oligodendrocyte lineage (Rip1). Ongoing mitosis was observed only in the precursor subpopulation at 2 DIV, as the mitotic marker BrdUrd colocalized with nestin alone, and not with TuJ1 (Fig. 1). Proliferation of nestin-IR cells continued until at least 5 DIV (data not shown).
Figure 1.
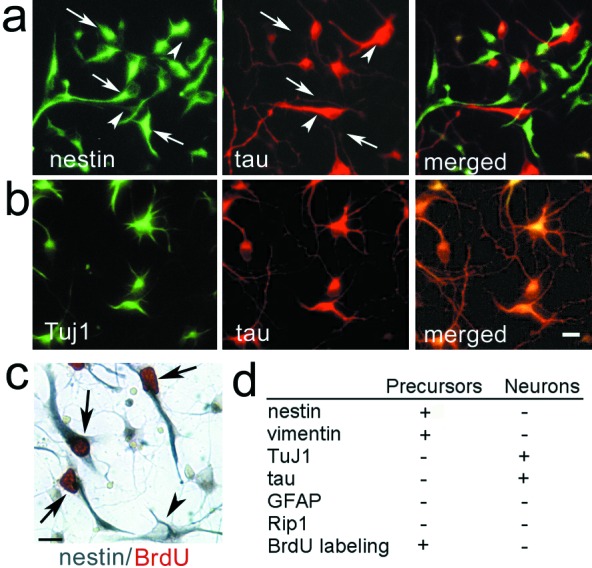
Cortical cultures consist of neural precursors and differentiating neurons. Cortical cells at DIV2 express (a) nestin (FITC labeling, arrows) or tau (Texas Red labeling, arrowheads) or (b) TuJ1 (FITC) and tau (Texas Red). (c) The proliferative population, labeled with BrdUrd (arrows, red chromophore), is nestin-positive (blue chromophore). Solid arrowhead indicates a nestin-positive cell, which did not incorporate BrdUrd. (d) Summary of immunocytochemical markers exhibited by cortical cells at 2 DIV. (Scale bars = 10 μm.)
Effects of Transfection on Cortical Precursors.
Before defining PAC1 isoform function, we examined potential effects of transfection on precursor proliferation at 2 DIV. When using the CMV-based plasmid and Lipofectamine Plus, 7 to 10% of cells expressed the GFP reporter protein. Further, the approximate 1:1 ratio of nestin to TuJ1/tau expression defined in control cells was observed in GFP-expressing cells after transfection (Fig. 2 a and b), indicating that neither the procedure nor reporter gene expression interfered with cell differentiation or survival, in contrast to other reagents (A.N. and E.D.-B., unpublished data). Furthermore, the BrdUrd labeling index of GFP positive and negative cells (Fig. 2) also did not differ (33 ± 1% vs. 27 ± 2%, respectively; mean ± SEM, P > 0.05), suggesting that the transfection procedure per se did not affect proliferation.
Figure 2.

Characterization of GFP-transfected cells. Cells were transfected with vector 12 h after plating and were analyzed by double immunocytochemistry at 2 DIV. GFP is expressed in both nestin-IR cells (a and a′: arrowhead) and TuJ1-IR cells (b and b′). In another experiment, cells were pulsed for 4 h with 10 μM BrdUrd and processed for GFP/BrdUrd double immunostaining. Cells expressing GFP (FITC labeling) exhibit (c, arrows) or lack (d, arrowheads) BrdUrd labeling (Texas red). (Scale bars = 10 μm.)
The vast majority of normal cortical precursors express the short isoform of PAC1, defined previously (10, 17). Indeed, most cells exhibit PAC1 immunoreactivity after extended peroxidase incubation with DAB substrate (Fig. 3a). In contrast, only cells cotransfected with GFP and PAC1short (or PAC1hop) exhibit PAC1 immunoreactivity following brief incubation, whereas untransfected and GFP vector alone transfected cells display only background (Figs. 3 b and c). In the following experiments, GFP protein was thus used as a marker of cells successfully cotransfected with PAC1 isoforms.
Figure 3.
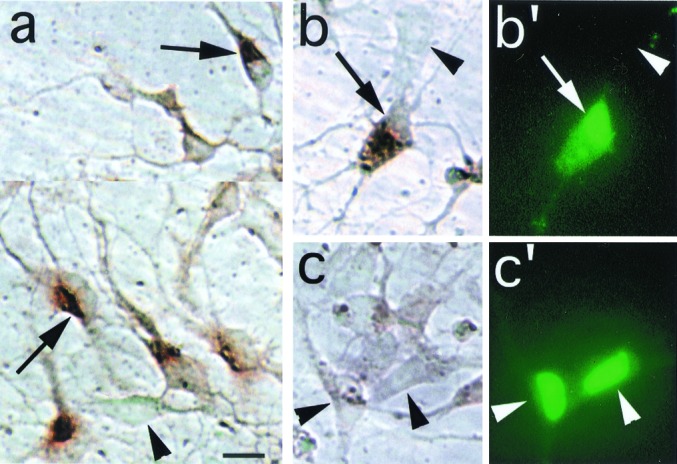
Ectopic expression of PAC1 receptor in cortical precursors. (a) The majority of normal, untransfected cortical precursors express PAC1 immunoreactivity (as previously reported in ref. 10) revealed by extended peroxidase incubation time (5 min, DAB substrate). Arrows, PAC1-IR cells exhibiting intense cytoplasmic signal and a negatively stained, eccentric nucleus; arrowheads, negative cell exhibiting only background signal. (b and b′) Following a brief (1 min) reaction time, this oblong cell cotransfected with GFP and PAC1 expression vectors exhibits intense cytoplasmic immunostaining for PAC1 (b, arrow) and prominent GFP autofluorescence in the eccentric nucleus (b′), although weaker fluorescence is present in the cytoplasm. (c and c′) In contrast, cells transfected with GFP vector alone exhibit intense GFP signal (c′), but only background DAB signal (c, arrowhead). Note that, in contrast to the GFP immunostaining procedure (Figs. 1 and 2), GFP autofluorescence is predominantly observed in the nucleus. (Scale bar = 10 μm.)
Effect of PAC1 Isoforms on Intracellular Calcium Levels.
Intracellular calcium ([Ca2+]i) serves as one effector of activated GPCRs, regulated by PLC production of diacylglycerol (DAG) and IP3 which, in turn, elicits release of [Ca2+]i from endoplasmic reticulum. To define the effects of PAC1 receptor on calcium signaling, precursors cotransfected with GFP and one of the PAC1 isoforms were analyzed by using the Fura-2 ratio method. PACAP triggered a rapid increase in [Ca2+]i levels in 68% of cells cotransfected with GFP/PAC1hop (Fig. 4). In contrast, PACAP did not elicit changes in GFP/PAC1short-expressing or in nontransfected cells. However, lack of PACAP response was not due to absent [Ca2+]i regulation, as levels increased after depolarization with 25 mM KCl. Variable response intensity likely reflects the various stages of precursor maturation as reported (30), although different levels of PAC1hop expression cannot be excluded. Regardless, ectopic expression of PAC1hop only (but not PAC1short) in cortical precursors established calcium signaling in response to PACAP.
Figure 4.

PAC1hop activation increases intracellular calcium levels in cortical cells. Following transfection with different PAC1 isoforms, cells were analyzed by using Fura-2 calcium ratio imaging at steady state and after 10 nM PACAP (arrow) and 25 mM KCl (arrowhead). Traces show individual plots of F340/F380 ratio in (a) three representative GFP/PAC1hop-transfected cells and (b) three nontransfected cells from the same dish. (c) Ratio of transfected cells that responded to PACAP with an increase in intracellular calcium to total GFP positive cells assessed.
Effect of PAC1 Isoforms on PKC Translocation.
In addition to calcium signaling, PACAP binding to PAC1hop isoform may stimulate production of DAG and subsequently activate PKC. The PKCγ-GFP fusion protein has been used to monitor subcellular translocation (activation) of protein kinases that follows stimulatory signals such as phorbol esters and receptor-ligand binding (31). To study this pathway, precursors were cotransfected with PAC1 isoforms and PKCγ-GFP, and PACAP effects were examined after plasmid expression. In cells transfected with PKCγ-GFP vector alone, intense GFP immunoreactivity was observed in the cytoplasm with only faint nuclear staining (Fig. 5a). To define the effects of PKC activation we used the phorbol ester PMA, which mimics DAG action. In cortical cells, PMA induced PKCγ-GFP translocation from the cytoplasm to the plasma membrane at 3 min and to the nucleus at 15 min (Fig. 5b) reproducing studies in CHO cells (31), providing a marker of PKC activation. When cortical cells were cotransfected with PKCγ-GFP and PAC1 isoforms, GFP immunostaining was observed primarily in the perikarya, as observed with PKCγ-GFP alone. In cells cotransfected with PAC1short, PACAP treatment elicited no change in PKCγ-GFP distribution after 45 s (Fig. 5 c and e) or after 3 and 15 min. In contrast, in PKCγ-GFP/PAC1hop-transfected cells, PACAP induced rapid PKCγ-GFP translocation to the plasma membrane and to the nucleus at 45 s [ANOVA F(2,8)46.6, P = 0.002; Fig. 5 d and e]. PKC translocation was no longer observed at 3 or 15 min. In sum, ≈80% of PAC1hop-transfected cells exhibited PKC activation after PACAP treatment, whereas vector- and PAC1short-expressing cells exhibited responses similar to those treated with vehicle.
Figure 5.

Phorbol ester- and PACAP-induced translocation of PKCγ-GFP fusion protein in cortical cells. (a) PKCγ-GFP fusion protein was visualized throughout the cytoplasm in transfected cortical cells. Note the lack of staining over the eccentric nuclei as indicated by open arrowheads. This pattern was observed in most unstimulated cortical cells transfected with PKCγ-GFP alone, PKCγ-GFP/PAC1short, or PKCγ-GFP/PAC1hop. (b) Activation of PKCγ by 0.2 μM PMA for 15 min induced the translocation of PKCγ-GFP from cytosol to the nucleus (indicated by solid arrowheads). (c) PKCγ-GFP was also visualized throughout the cytoplasm in PKCγ-GFP/PAC1short-transfected cortical cells 45 s after 10 nM PACAP treatment. Open arrowhead indicates absence of prominent nuclear staining. (d) In contrast, PKCγ translocation to the membrane (arrows) and nucleus (solid arrowheads) occurred in PKCγ-GFP/PAC1hop-transfected cells 45 s after 10 nM PACAP. (e) Quantification of PKCγ-GFP nuclear/membrane localization in cells transfected with PKCγ-GFP alone, PKCγ-GFP/PAC1short, or PKCγ-GFP/PAC1hop after 45 s PACAP treatment. Data were obtained from three experiments; *, P < 0.001 vs. GFP-PKC-transfected cells. (Scale bar, 10 μm.)
Effect of PAC1 Isoforms on Mitosis.
To define the effects of receptor variants on neural precursor mitosis, we analyzed the BrdUrd labeling index in GFP-transfected cells 6 h after PACAP exposure. Previously, we found that dividing precursors may undergo cell death in culture over 24 h, making it difficult to distinguish whether growth factors increase cell entry into DNA synthetic S phase (mitogenesis), or alternatively promote precursor survival (trophism) (10, 32). Use of a brief 6 h paradigm minimized involvement of cell death, thus excluding survival-promoting effects, and allowing identification of mitogenic activity. Transfected precursors exhibited distinct and highly significant isoform-dependent responses to PACAP [group X treatment F(2,47)10.2, P = 0.0002]. PACAP treatment elicited 27 and 33% decreases in the labeling index of cells transfected with GFP and GFP/PAC1short, respectively, responses similar to those in native cortical precursors (which normally express short; ref. 10). In contrast, in GFP/PAC1hop-transfected cells, PACAP increased the labeling index by 49% (Fig. 6a), suggesting that PAC1 isoform expression determines the direction of mitogenic regulation. As CMV-driven vectors respond to cAMP (33), a signal elicited by PACAP (10, 17), it was not unexpected that the peptide increased GFP-IR cells by 1.8-fold [two-way ANOVA, PACAP effect F(1,48)8.7, P = 0.005; Fig. 6b]. However, because this increase was uniform and independent of PAC1 isoform expressed [group X treatment F(2,48)0.1, P > 0.5], it cannot account for isoform regulation of mitogenesis.
Figure 6.

PAC1 isoforms differentially regulate DNA synthesis and proliferation. At 2 DIV, transfected cortical precursors were incubated for 6 h with 10 nM PACAP. Cultures were pulsed with BrdUrd (10 μM) for the final 2 h and processed for double GFP/BrdUrd labeling. (a) BrdUrd labeling index of transfected cells. PACAP treatment decreased DNA synthesis in GFP- or GFP/PAC1short-transfected cells, whereas the peptide increased mitosis in GFP/PAC1hop-transfected cells. Values are expressed as % ± SEM (n = 9). Differs from vehicle-treated group: *, P < 0.05; **, P < 0.01. (b) Transfection rates in corresponding cultures. PACAP treatment resulted in an overall increase in GFP-IR cell number (P < 0.05). Values are expressed as % of GFP-IR cells/total ± SEM. (c and d) GFP/PAC1short- or GFP/PAC1hop-transfected cells were treated daily with PACAP for 5 days and processed for GFP immunostaining. (c) Example of a clone at 5 DIV. (Scale bar = 10 μm.) (d) Quantification of GFP-IR clones (≥4 cells) at 5 DIV. Data are expressed as mean number of clones per ten fields ± SEM (n = 8, four experiments). *, unpaired t test, P < 0.02.
Effects of PAC1 Isoforms on Precursor Survival and Proliferation.
To define the potential effects of receptor isoform on survival, cultures were treated with PACAP daily and GFP-IR cells were counted at 2 and 3 DIV. The number of GFP-IR cells increased in both groups [1.38- ± 0.15-fold for GFP/PAC1short and 1.69- ± 0.14-fold for GFP/PAC1hop; two-way ANOVA, time effect F(1,8)5.8, P = 0.04]. No difference between receptor isoforms was observed [group X time interaction F(1,8)0.6, P = 0.5], indicating that PAC1 isoforms did not differentially affect cell death or survival. This was expected, however, as it was previously shown in sympathoblasts (12) and cerebellar granule cells (34) that enhanced survival elicited by PACAP depends on the cAMP pathway, which is activated by both PAC1 isoforms.
To characterize proliferative effects, the number of total GFP-IR cells and GFP-IR clones in GFP/PAC1short and GFP/PAC1hop groups was assessed at 5 DIV. There were almost twice as many GFP-IR cells in the PAC1hop group than in the PAC1short (133 ± 9.5 and 72 ± 14, respectively; GFP-IR cells per 20 fields, P = 0.02, four experiments). Moreover, there was a 56% increase in the number of clones generated from precursors transfected with PAC1hop as compared with PAC1short (Fig. 6 c and d). The increased incidence of clones following PAC1hop activation suggests that PACAP increased proliferation by enhancing precursor mitosis, or alternatively, promoting precursor cell survival. As we did not find differential effects of PAC1 isoforms on survival, the increased clone number after PAC1hop activation likely reflects enhanced precursor mitosis leading to proliferation. Furthermore, analysis of clone size showed no difference between groups (8.9 ± 1 cells for GFP/PAC1hop and 8.5 ± 1 for GFP/PAC1short, n = 15 per group), suggesting that precursors expressing different isoforms exhibit similar cell cycle lengths. In aggregate, the data suggest that the increased entry of precursors into mitotic S phase elicited by PACAP at 6 h through the hop isoform (Fig. 6a) leads to a larger number of clones 3 days later (Fig. 6d).
Finally, although PLC pathway activation was associated with PAC1hop-induced mitogenesis, its requirement for stimulation remains undefined. To examine the role of PLC, we used the specific antagonist, U-73122. In sympathetic neuroblasts, which naturally express PAC1hop as well as in PAC1hop-transfected cortical cells, the PACAP-induced increase in DNA synthesis was completely blocked in the presence of PLC antagonist (Table 1). Moreover, in native cortical precursors, we found that PMA counteracted the anti-mitogenic action of forskolin (data not shown). Taken together, these data support the involvement of the PLC pathway and downstream effectors in the promitogenic effects of PACAP through the PAC1hop variant.
Table 1.
Involvement of the PLC pathway in PACAP-induced promitogenic effects
| Control
|
PLC antagonist
|
|||
|---|---|---|---|---|
| Vehicle | PACAP | Vehicle | PACAP | |
| GFP/PAC1hop cortical cells, BrdUrd labeling index ± SEM | 20 ± 2.0 | 30.3 ± 0.7** | 19.2 ± 1.2 | 20.6 ± 1.0 |
| Sympathoblasts, cpm ± SEM | 333 ± 10 | 489 ± 24*** | 296 ± 12 | 330 ± 28 |
After pretreatment with U-73122 or inactive analogue (control, U-73345), PAC1hop transfected cortical cells and sympathetic neuroblasts were exposed to PACAP (10 nM) for 6 h, and DNA synthesis was assessed as BrdUrd labeling index (BrdUrd-IR cells per GFP-IR cells, n = three to four coverslips per group) and [3H]dT incorporation (n = 9–11 wells per group), respectively. Differs from control: **, P < 0.01; ***, P < 0.001.
Discussion
Although GPCR signaling regulates mitosis of various cell types, little is known about its role in neuroblast mitosis, a rate-limiting step in neurogenesis. Although neural mitogenic signaling has traditionally been associated with tyrosine kinase receptors (1, 2, 5), GPCRs may also regulate the survival or proliferation of neural precursors (7–9, 23). Indeed, PACAP was previously identified as an antimitogenic signal for hindbrain neuroepithelial cells (11) and cortical precursors (10, 35), in contrast to its mitogenic activity in sympathetic neuroblasts (12). This dichotomy could be due to mechanisms dependent on cellular context (presence of differential intracellular components; refs. 24–27) and/or to a different subset of PACAP receptors (17). Our present data provide compelling evidence that the differential expression of intracellular loop isoforms of PAC1, by activating different signal transduction pathways, plays a role in the opposite mitogenic effects observed among neural precursor populations.
As indicated by calcium imaging and PKCγ-GFP translocation, our transfection studies demonstrate differential signaling mediated by PAC1hop and PAC1short variants in neural precursors. These data support previous evidence in primary neuroblasts indicating a correlation between endogenous PAC1hop expression and PLC activation. Indeed, in PAC1hop expressing sympathoblasts (12, 17) or immature cerebellar granule cells (36–38), PACAP increases phosphoinositide (PI) turnover and [Ca2+]i. In contrast, the peptide does not elicit PI turnover (17) or [Ca2+]i release (this study) in short isoform-expressing cortical precursors. However, introduction of the hop isoform into cortical precursors established PLC activation and enhanced proliferation in response to PACAP. Therefore, differences in GPCR isoform as opposed to available intracellular signaling machinery likely underlie the distinct pathways and mitogenic effects elicited by PACAP. Moreover, the hop isoform apparently determines calcium activation in diverse primary neural populations including more mature and postmitotic cortical and sympathetic neurons. In contrast, calcium responses do not occur in astrocytes expressing the short isoform (39, 40). In aggregate, the data support a direct link between the third intracellular loop of the PACAP receptor and signaling specificity in primary neural cells. Thus, receptor isoform determination of intracellular signaling in primary neural cells differs markedly from observations of nonneural cell lines: both hop and short variants activated equally AC and PLC when expressed transiently in porcine renal epithelial LLC-PK1 cells (14), whereas hop was 5–8-fold more efficient than short in increasing PLC activity in NIH 3T3 fibroblasts (15). Differences between primary neural cells and cell lines may reflect differential, and potentially excessive, expression of intracellular signaling components or ectopic receptors in immortalized cell lines.
The PAC1 receptor belongs to the group II receptor family, a subclass of heptahelical GPCRs, which includes calcitonin, secretin, PTH, vasoactive intestinal peptide (VIP), gastric inhibitory peptide, glucagon, glucagon-like peptide-1, and corticotrophin-releasing factor receptors (16). It is well known that the third intracellular loop of rhodopsin/adrenergic group I receptors determines G protein coupling selectivity (41–43). Direct sequence comparisons between members of these two receptor groups, however, reveals no sequence homologies in this region and its importance in the type II family is less well-defined (16). Our study supports a critical involvement of the C-terminal intracellular loop of PAC1 in PLC coupling, although further experiments are needed to delineate specific amino acids involved in this interaction.
Significantly, mitogenic stimulation by PAC1hop in cortical precursors or sympathetic neuroblasts was prevented by antagonist U-73122 suggesting that PLC and downstream effectors, such as PKC, positively regulate neural precursor mitosis, as observed in nonneural cells (18, 44). Although rarely addressed, the role of GPCR-regulated PLC in neural proliferation was previously suggested by PMA effects on neuroblastoma DNA synthesis (45) and, more recently, by muscarinic GPCRs stimulation of cortical neuroblast mitosis (23). Indeed, our observations indicate that the third intracellular loop of GPCRs may regulate neuroblast proliferation through fine tuning of intracellular signaling such as the PLC/PKC pathway. Although D phospholipases, components of PKC-mediated mitogenesis in several cell types (46, 47), are expressed in embryonic neural precursors (48), contributions to PACAP effects remain to be defined. On the other hand, we cannot exclude the possibility that pro-mitogenic effects mediated by PAC1hop also involve regulation of arachidonic acid release or the Ras-MAPK cascade, as described in other systems (49, 50).
Implications for Neurogenesis.
Expression of the PAC1 hop and short isoforms differentially regulated precursor mitosis mediating stimulation and inhibition, respectively. In turn, these studies suggest that region- or lineage-specific effects of widely expressed extracellular signals, such as PACAP, may depend on distinct receptor isoform function. Receptor isoform determination of ligand-specific activity may apply not only to GPCRs of neurotransmitters and neuropeptides, but also to mitogenic effects of the tyrosine or threonine/serine kinase families including receptors for fibroblast growth factor (51), neurotrophins (52–54), epidermal growth factor (55), and bone morphogenetic proteins (56). Thus, at the level of an individual neural lineage, the decision for precursors to proliferate, or alternatively, exit the cell cycle, may rest with control of receptor mRNA splicing, providing an ontogenetic switch for epigenetic regulation of neurogenesis.
Acknowledgments
We are grateful to Dr. David Ginty for critical review and thoughtful discussion, Dr. R. D. McKinnon for assistance in calcium imaging, Dr. A. Arimura for PAC1 antiserum, and Dr. L. Journot for PAC1 expression vectors. We thank X. Zhou for sympathetic cell cultures. A.N. was a recipient of a postdoctoral “Fondation Simone et Cino Del Duca” fellowship. This work was supported in part by National Institutes of Health Grant NS 32401.
Abbreviations
- PACAP
pituitary adenylate cyclase activating polypeptide
- GPCR
G protein-coupled receptors
- PLC
phospholipase C
- PKC
protein kinase C
- DIV
days in vitro
- GFP
green fluorescent protein
- IR
immunoreactive
Footnotes
This paper was submitted directly (Track II) to the PNAS office.
References
- 1.Drago J, Murphy M, Carroll S M, Harvey R P, Bartlett P F. Proc Natl Acad Sci USA. 1991;88:2199–2203. doi: 10.1073/pnas.88.6.2199. [DOI] [PMC free article] [PubMed] [Google Scholar]
- 2.Temple S, Qian X. Neuron. 1995;15:249–252. doi: 10.1016/0896-6273(95)90030-6. [DOI] [PubMed] [Google Scholar]
- 3.LoTurco J J, Owens D F, Heath M J, Davis M B, Kriegstein A R. Neuron. 1995;15:1287–1298. doi: 10.1016/0896-6273(95)90008-x. [DOI] [PubMed] [Google Scholar]
- 4.Antonopoulos J, Pappas I S, Parnavelas J G. Eur J Neurosci. 1997;9:291–298. doi: 10.1111/j.1460-9568.1997.tb01399.x. [DOI] [PubMed] [Google Scholar]
- 5.Vaccarino F M, Schwartz M L, Raballo R, Nilsen J, Rhee J, Zhou M, Doetschman T, Coffin J D, Wyland J J, Hung Y T. Nat Neurosci. 1999;2:246–253. doi: 10.1038/6350. [DOI] [PubMed] [Google Scholar]
- 6.Levitt P, Harvey J A, Friedman E, Simansky K, Murphy E H. Trends Neurosci. 1997;20:269–274. doi: 10.1016/s0166-2236(96)01028-4. [DOI] [PubMed] [Google Scholar]
- 7.Cameron H A, Hazel T G, McKay R D. J Neurobiol. 1998;36:287–306. [PubMed] [Google Scholar]
- 8.Reznikov K, Hauser K F, Nazarevskaja G, Trunova Y, Derjabin V, Bakalkin G. Eur J Neurosci. 1999;11:2711–2719. doi: 10.1046/j.1460-9568.1999.00680.x. [DOI] [PubMed] [Google Scholar]
- 9.Chun J. Crit Rev Neurobiol. 1999;13:151–168. doi: 10.1615/critrevneurobiol.v13.i2.20. [DOI] [PubMed] [Google Scholar]
- 10.Lu N, DiCicco-Bloom E. Proc Natl Acad Sci USA. 1997;94:3357–3362. doi: 10.1073/pnas.94.7.3357. [DOI] [PMC free article] [PubMed] [Google Scholar]
- 11.Waschek J A, Casillas R A, Nguyen T B, DiCicco-Bloom E M, Carpenter E M, Rodriguez W I. Proc Natl Acad Sci USA. 1998;95:9602–9607. doi: 10.1073/pnas.95.16.9602. [DOI] [PMC free article] [PubMed] [Google Scholar]
- 12.DiCicco-Bloom E, Deutsch P J, Maltzman J, Zhang J, Pintar J E, Zheng J, Friedman W F, Zhou X, Zaremba T. Dev Biol. 2000;219:197–213. doi: 10.1006/dbio.2000.9604. [DOI] [PubMed] [Google Scholar]
- 13.Harmar A J, Arimura A, Gozes I, Journot L, Laburthe M, Pisegna J R, Rawlings S R, Robberecht P, Said S I, Sreedharan S P, et al. Pharmacol Rev. 1998;50:265–270. [PMC free article] [PubMed] [Google Scholar]
- 14.Spengler D, Waeber C, Pantaloni C, Holsboer F, Bockaert J, Seeburg P H, Journot L. Nature (London) 1993;365:170–175. doi: 10.1038/365170a0. [DOI] [PubMed] [Google Scholar]
- 15.Pisegna J R, Wank S A. Proc Natl Acad Sci USA. 1993;90:6345–6349. doi: 10.1073/pnas.90.13.6345. [DOI] [PMC free article] [PubMed] [Google Scholar]
- 16.Strader C D, Fong T M, Graziano M P, Tota M R. FASEB J. 1995;9:745–754. [PubMed] [Google Scholar]
- 17.Lu N, Zhou R, DiCicco-Bloom E. J Neurosci Res. 1998;53:651–662. doi: 10.1002/(SICI)1097-4547(19980915)53:6<651::AID-JNR3>3.0.CO;2-4. [DOI] [PubMed] [Google Scholar]
- 18.van Biesen T, Luttrell L M, Hawes B E, Lefkowitz R J. Endocr Rev. 1996;17:698–714. doi: 10.1210/edrv-17-6-698. [DOI] [PubMed] [Google Scholar]
- 19.Takuwa N, Yanagisawa M, Yamashita K, Masaki T. J Biol Chem. 1989;264:7856–7861. [PubMed] [Google Scholar]
- 20.LaMorte V J, Harootunian A T, Spiegel A M, Tsien R Y, Feramisco J R. J Cell Biol. 1993;121:91–99. doi: 10.1083/jcb.121.1.91. [DOI] [PMC free article] [PubMed] [Google Scholar]
- 21.Ashkenazi A, Ramachandran J, Capon D J. Nature (London) 1989;340:146–150. doi: 10.1038/340146a0. [DOI] [PubMed] [Google Scholar]
- 22.Bohn L M, Belcheva M M, Coscia C J. J Neurochem. 2000;74:564–573. doi: 10.1046/j.1471-4159.2000.740564.x. [DOI] [PMC free article] [PubMed] [Google Scholar]
- 23.Ma W, Maric D, Li B S, Hu Q, Andreadis J D, Grant G M, Liu Q Y, Shaffer K M, Chang Y H, Zhang L, et al. Eur J Neurosci. 2000;12:1227–1240. doi: 10.1046/j.1460-9568.2000.00010.x. [DOI] [PubMed] [Google Scholar]
- 24.Liu F, Wan Q, Pristupa Z B, Yu X M, Wang Y T, Niznik H B. Nature (London) 2000;403:274–380. doi: 10.1038/35002014. [DOI] [PubMed] [Google Scholar]
- 25.Faure M, Voyno-Yasenetskaya T A, Bourne H R. J Biol Chem. 1994;269:7851–7854. [PubMed] [Google Scholar]
- 26.Tortora G, Pepe S, Bianco C, Damiano V, Ruggiero A, Baldassarre G, Corbo C, Cho-Chung Y S, Bianco A R, Ciardiello F. Int J Cancer. 1994;59:712–716. doi: 10.1002/ijc.2910590521. [DOI] [PubMed] [Google Scholar]
- 27.Lezcano N, Mrzljak L, Eubanks S, Levenson R, Goldman-Rakic P, Bergson C. Science. 2000;287:1660–1664. doi: 10.1126/science.287.5458.1660. [DOI] [PubMed] [Google Scholar]
- 28.Lendahl U, Zimmerman L B, McKay R D. Cell. 1990;60:585–595. doi: 10.1016/0092-8674(90)90662-x. [DOI] [PubMed] [Google Scholar]
- 29.Menezes J R, Luskin M B. J Neurosci. 1994;14:5399–5416. doi: 10.1523/JNEUROSCI.14-09-05399.1994. [DOI] [PMC free article] [PubMed] [Google Scholar]
- 30.Maric D, Maric I, Smith S V, Serafini R, Hu Q, Barker J L. Eur J Neurosci. 1998;10:2532–2546. doi: 10.1046/j.1460-9568.1998.00284.x. [DOI] [PubMed] [Google Scholar]
- 31.Sakai N, Ikegaki N, Shirai Y, Ono Y, Saito N. J Cell Biol. 1997;139:1465–1476. doi: 10.1083/jcb.139.6.1465. [DOI] [PMC free article] [PubMed] [Google Scholar]
- 32.Lu N, Black I B, DiCicco-Bloom E. Dev Brain Res. 1996;94:31–36. doi: 10.1016/0165-3806(96)00050-8. [DOI] [PubMed] [Google Scholar]
- 33.Hunninghake G W, Monick M M, Liu B, Stinski M F. J Virol. 1989;63:3026–3033. doi: 10.1128/jvi.63.7.3026-3033.1989. [DOI] [PMC free article] [PubMed] [Google Scholar]
- 34.Vaudry D, Gonzalez B J, Basille M, Anouar Y, Fournier A, Vaudry H. Neuroscience. 1998;84:801–812. doi: 10.1016/s0306-4522(97)00545-9. [DOI] [PubMed] [Google Scholar]
- 35.Suh J, Lu N, Nicot A, Tatsuno I, DiCicoo-Bloom E. Nat Neurosci. 2001;4:123–124. doi: 10.1038/83936. [DOI] [PubMed] [Google Scholar]
- 36.Basille M, Gonzalez B J, Desrues L, Demas M, Fournier A, Vaudry H. J Neurochem. 1995;65:1318–1324. doi: 10.1046/j.1471-4159.1995.65031318.x. [DOI] [PubMed] [Google Scholar]
- 37.Cavallaro S, Copani A, D'Agata V, Musco S, Petralia S, Ventra C, Stivala F, Travali S, Canonico P L. Mol Pharmacol. 1996;50:60–66. [PubMed] [Google Scholar]
- 38.Villalba M, Bockaert J, Journot L. J Neurosci. 1997;17:83–90. doi: 10.1523/JNEUROSCI.17-01-00083.1997. [DOI] [PMC free article] [PubMed] [Google Scholar]
- 39.Grimaldi M, Cavallaro S. Eur J Neurosci. 1999;11:2767–2772. doi: 10.1046/j.1460-9568.1999.00693.x. [DOI] [PubMed] [Google Scholar]
- 40.Braas K M, May V. J Biol Chem. 1999;274:27702–27710. doi: 10.1074/jbc.274.39.27702. [DOI] [PubMed] [Google Scholar]
- 41.Guiramand J, Montmayeur J P, Ceraline J, Bhatia M, Borrelli E. J Biol Chem. 1995;270:7354–7358. doi: 10.1074/jbc.270.13.7354. [DOI] [PubMed] [Google Scholar]
- 42.Wess J, Liu J, Blin N, Yun J, Lerche C, Kostenis E. Life Sci. 1997;60:1007–1014. doi: 10.1016/s0024-3205(97)00041-6. [DOI] [PubMed] [Google Scholar]
- 43.Conchon S, Barrault M B, Miserey S, Corvol P, Clauser E. J Biol Chem. 1997;272:25566–25572. doi: 10.1074/jbc.272.41.25566. [DOI] [PubMed] [Google Scholar]
- 44.Dajani O F, Sandnes D, Melien O, Rezvani F, Nilssen L S, Thoresen G H, Christoffersen T. J Cell Physiol. 1999;180:203–214. doi: 10.1002/(SICI)1097-4652(199908)180:2<203::AID-JCP8>3.0.CO;2-T. [DOI] [PubMed] [Google Scholar]
- 45.Minana M D, Felipo V, Grisolia S. Proc Natl Acad Sci USA. 1990;87:4335–4339. doi: 10.1073/pnas.87.11.4335. [DOI] [PMC free article] [PubMed] [Google Scholar]
- 46.Boarder M R. Trends Pharmacol Sci. 1994;15:57–62. doi: 10.1016/0165-6147(94)90111-2. [DOI] [PubMed] [Google Scholar]
- 47.Zhang Y, Altshuller Y M, Hammond S M, Hayes F, Morris A J, Frohman M A. EMBO J. 1999;18:6339–6348. doi: 10.1093/emboj/18.22.6339. [DOI] [PMC free article] [PubMed] [Google Scholar]
- 48.Saito S, Sakagami H, Kondo H. Dev Brain Res. 2000;120:41–47. doi: 10.1016/s0165-3806(99)00189-3. [DOI] [PubMed] [Google Scholar]
- 49.Stella N, Magistretti P J. J Biol Chem. 1996;271:23705–23710. doi: 10.1074/jbc.271.39.23705. [DOI] [PubMed] [Google Scholar]
- 50.Moroo I, Tatsuno I, Uchida D, Tanaka T, Saito J, Saito Y, Hirai A. Brain Res. 1998;795:191–196. doi: 10.1016/s0006-8993(98)00291-1. [DOI] [PubMed] [Google Scholar]
- 51.Shi D L, Launay C, Fromentoux V, Feige J J, Boucaut J C. Dev Biol. 1994;164:173–182. doi: 10.1006/dbio.1994.1189. [DOI] [PubMed] [Google Scholar]
- 52.Lamballe F, Tapley P, Barbacid M. EMBO J. 1993;12:3083–3094. doi: 10.1002/j.1460-2075.1993.tb05977.x. [DOI] [PMC free article] [PubMed] [Google Scholar]
- 53.Valenzuela D M, Maisonpierre P C, Glass D J, Rojas E, Nunez L, Kong Y, Gies D R, Stitt T N, Ip N Y, Yancopoulos G D. Neuron. 1993;10:963–974. doi: 10.1016/0896-6273(93)90211-9. [DOI] [PubMed] [Google Scholar]
- 54.Hapner S J, Boeshore K L, Large T H, Lefcort F. Dev Biol. 1998;201:90–100. doi: 10.1006/dbio.1998.8970. [DOI] [PubMed] [Google Scholar]
- 55.Kainulainen V, Sundvall M, Maatta J A, Santiestevan E, Klagsbrun M, Elenius K. J Biol Chem. 2000;275:8641–8649. doi: 10.1074/jbc.275.12.8641. [DOI] [PubMed] [Google Scholar]
- 56.Shou J, Murray R C, Rim P C, Calof A L. Development. 2000;127:5403–5413. doi: 10.1242/dev.127.24.5403. [DOI] [PubMed] [Google Scholar]