

Abstract
Radiotherapy is commonly employed to treat cancers of the head and neck and is increasingly used to treat other central nervous system (CNS) disorders. Exceeding the radiation tolerance of normal CNS tissues can result in sequelae contributing to patient morbidity and mortality. Animal studies and clinical experience suggest that neuroinflammation plays a role in the etiology of these effects; however, detailed characterization of this response has been lacking. Therefore, a dose–time investigation of the neuroinflammatory response after single-dose cranial irradiation was performed using C57BL/6 mice. Consistent with previous reports, cranial irradiation resulted in multiphasic inflammatory changes exemplified by increased transcript levels of inflammatory cytokines, along with glial and endothelial cell activation. Cranial irradiation also resulted in acute infiltration of neutrophils and a delayed increase in T cells, MHC II-positive cells, and CD11c-positive cells seen first at 1 month with doses ≥15 Gy. CD11c-positive cells were found almost exclusively in white matter and expressed MHC II, suggesting a “mature” dendritic cell phenotype that remained elevated out to 1 year postirradiation. Our results indicate that cranial irradiation leads to persistent neuroinflammatory changes in the C57BL/6 mouse brain that includes unique immunomodulatory cell populations.
INTRODUCTION
Cranial radiotherapy is commonly used to treat primary and metastatic brain tumors and is also used in non-neoplastic applications, such as in the treatment of cerebral arteriovenous malformations (AVMs), neuro-facial pain syndromes, and specific forms of epilepsy (1–3). However, whether the protocol used is a localized fractionated schedule, whole-brain irradiation or stereotactic radiosurgery, in all cases, the total dose of cranial radiation delivered is limited by the sensitivity of the surrounding normal brain tissue and concern over subsequent radiation-induced side effects, such as radionecrosis and neurocognitive deficits.
Classically, it was believed that a tissue’s response to radiation could be broken down into two components: an acute response resulting from DNA damage and production of reactive oxygen species and a chronic phase consisting of tissue remodeling that results from terminal damage to critical cell populations. More recently, investigators have shown that the response to radiation is a far more complex and continuous process, consisting of changes in the tissue microenvironment, the infiltration of immune cells, and the modification of reparative processes that occurs prior to the development of tissue injury (4). The successful use of corticosteroids (5) and cyclooxygenase-2 inhibitors (6) as therapies for both acute and chronic radiation-induced brain injury suggests that neuroinflammation may play a role in its pathogenesis.
Neuroinflammation is a central nervous system (CNS) response to injury that is characterized by the activation of microglia, astrocytes and endothelial cells and increased expression of inflammatory mediators. It is therefore not surprising that brain exposure to radiation has been shown to result in both acute and late (persistent) neuroinflammatory responses. For example, increases in GFAP immunoreactivity, indicating astrocyte activation, have been observed as early as 4 h in vivo (7) and as late as 6 months (8) postirradiation. A similar pattern of activation has been seen for microglia. Increased CD11b staining in vivo has been seen as early at 4 h (7) and appears to persist out to 5–6 months postirradiation, as demonstrated by increased numbers of CD11b-positive or MHC II-positive cells (8, 9).
In addition to cellular activation, there is a rapid (at 4 h) upregulation of multiple proinflammatory cytokine and cytokine receptor mRNAs in the brain such as TNFA, IL1B, IL6 and IL1A (10, 11). In vivo studies also have shown that increased immunoreactivity for intercellular adhesion molecule (ICAM-1) on glial cells and the brain vasculature begins at 4 h (7, 12). This is consistent with intravital imaging showing increased leukocyte rolling and adhesion within the first 24 h after radiation exposure (13). An acute upregulation in the mRNA levels for multiple recruitment chemokines such as monocyte chemoattractant protein (MCP-1/CCL2) and macrophage inflammatory protein 2 (MIP-2/CXCL2) (11, 14, 15) has been demonstrated, and downstream inflammatory mediators, such as prostaglandins, are also increased after brain irradiation (11, 16, 17). In addition, increased mRNA expression for proinflammatory cytokines and their receptors, as well as ICAM-1, has been found to persist for months after irradiation (18, 19).
The neuroinflammatory response to cranial irradiation is complex, involving multiple cell types and multiple signaling pathways. Transgenic animals provide an effective approach to tease apart the contributions of inflammatory mediators and signaling pathways, and many such models have been created, often on a C57BL/6 genetic background. To the authors’ knowledge, only one group has examined the long-term effects of radiation on the C57BL/6 mouse brain (19). Although they reported a dose-dependent effect of radiation on seizure development, late changes were investigated in animals only after exposure to 25 Gy. In particular, Daigle et al. (19) examined behavioral changes, late changes in myelination, acute apoptosis and acute changes in the mRNA levels for a handful of cytokines. This paucity of data regarding long-term effects of radiation on the C57BL/6 mouse brain and the frequent use of this mouse strain led us to undertake a detailed dose–time investigation of the molecular and cellular components of the neuroinflammatory response after cranial irradiation. Our results provide a better foundation for understanding chronic neuroinflammatory changes and their potential contribution to changes in the CNS microenvironment after brain irradiation.
MATERIALS AND METHODS
Animals
Male C57BL/6J mice (Jackson Laboratory, Bar Harbor, ME) 8–10 weeks of age were used in all groups (n = 488). Animals were allowed to acclimate for at least 7 days prior to experimentation. All animal procedures were reviewed and approved by the University of Rochester’s Committee on Animal Resources and were in compliance with the National Institutes of Health (NIH) guidelines prior to the initiation of the study.
Radiation
Mice were anesthetized (90 mg/kg ketamine and 8 mg/kg xylazine administered intraperitoneally) then laid supine on the 137Cs irradiator (J. L. Shepherd and Associates, San Fernando, CA) such that the cranial volume between their eyes and ears was exposed using a 5-mm × 12.2-cm collimator slit. This collimator provided a very uniform field at a dose rate of 1.25 Gy/min with sharp edges that fell to a dose rate of 0 Gy/min within 2.5 mm of the slit edge. Mice were exposed to a single dose of radiation ranging from 0 to 35 Gy. This dose range was selected based on work done by previous investigators in other strains of mice (8, 18, 20, 21). After irradiation, mice were returned to the vivarium and supplied with laboratory diet and water ad libitum until the time of euthanasia. Mice were euthanized at 4 and 12 h, 1, 3 and 7 days, and 1, 3, 6 and 12 months postirradiation.
Quantitative Real-Time Polymerase Chain Reaction (qRT-PCR)
Immediately after euthanasia, the animals were flushed intracardially with 10–15 ml of a solution containing 2 IU/ml heparin, 0.05% sodium nitrite, and 10 mM indomethacin in 0.15 M phosphate buffer (PB). After brain removal, the hemispheres were separated and snap frozen in isopentane. Frozen hemispheres were placed in sterile tubes and stored at −80°C. RNA was isolated using TRIzol (Invitrogen, Carlsbad, CA) and an Omni International TH tissue homogenizer according to the manufacturer’s suggested protocol. cDNA was prepared using 1 μg of RNA, oligo (dt) and random heximer primers, and SuperScript III reverse transcriptase (Invitrogen). Real-time PCR assays were conducted by the University of Rochester Functional Genomics Center using commercially available, predesigned primer/probe sets (Applied Biosystems, Carlsbad, CA), as listed in Supplementary Table 1 (http://dx.doi.org/10.1667/RR2587.1.S1). Samples were run on a custom TaqMan® Array (384-Well Micro Fluidic Cards; Applied Biosystems) in a 7900HT Sequence Detection System (Applied Biosystems) loaded by a CAS-1200 (Qiagen Inc., Valencia, CA) precision liquid handling system. Standard curves were generated using serially diluted samples over 4–5 orders of magnitude. PCR reactions were carried out using TaqMan® MasterMix. PCR conditions were as follows: denaturation at 94.5°C for 5 min followed by 40 cycles of amplification by denaturing at 97°C for 15 s and annealing/extension at 59.8°C for 30 s. To determine relative differences in mRNA levels, reaction efficiency (E) was calculated from a standard curve and threshold cycle (Ct) values were transformed using the following equation: expression = (1 + E)Ct. Ribosomal 18S RNA was used as a housekeeping gene to normalize the calculated quantities of mRNA for the gene of interest. The average of this calculated quantity for the control animals at a particular time was used to convert the data into relative change in expression of the genes of interest.
Statistical significance was determined for the RT-PCR data using Kruskal-Wallis tests for each time followed by Dunn’s post-tests that compared each dose to the control. A P value of less than 0.05 was considered significant. Statistical analysis and graph generation were performed with Prism 5.01 for Windows (GraphPad Software, San Diego, CA).
Histology/Immunohistochemistry/Immunofluorescence
At each time, in a subset of animals, the brains were removed and post-fixed in 4% paraformaldehyde at 4°C for 2 h, at which point they were transferred to a 30% sucrose solution in 0.15 M PB until equilibrated. Once equilibrated, brains were snap frozen in isopentane and stored at −80°C until sectioning. Brains were sectioned at 30 μm on a sliding knife microtome with a −25°C freezing stage. Sections were stored in cryoprotectant at −20°C until processing. Every 24th brain section from each mouse at each time and dose was mounted onto slides. One set was stained using cresyl violet and another with hematoxylin and eosin. These stained sections were examined for the presence of gross pathological changes. Visualization of antibody-bound sections for immunohistochemistry was performed using biotinylated secondary antibodies, avidin-biotin complex (Elite) and a 3,3-diaminobenzadine (DAB) substrate kit (Vector Laboratories, Burlingame, CA). For immunofluorescence, primary antibodies were used at concentrations three times the immunohistochemistry level. Secondary antibodies bound to Alexa (Invitrogen) or DyLight (Jackson Laboratory) fluorophores were used at a dilution of 1:500. Primary antibodies used included rat anti-mouse MHC class II I-Ab (BD Pharmingen, San Jose, CA, 1:2000); rabbit anti-GFAP (Dako North America, Glostrup, Denmark, 1:6000); rabbit anti-Iba-1 (Wako, Richmond, VA, 1:5000); hamster anti-ICAM-1 (AbD Serotec, Raleigh, NC, 1:2000); rat anti-CD3 (AbD Serotec, 1:4000); hamster anti-CD3 (Santa Cruz Biotechnology Inc., Santa Cruz, CA, 1:2000); rat anti-CD11c (BD Pharmingen, 1:500); and rat anti-7/4 (AbD Serotec, 1:2000). Biotinylated secondary antibodies used included goat anti-Armenian Hamster IgG (Jackson Laboratory, 1:1000); goat anti-mouse F(ab′)2 (Jackson Laboratory, 1:2000); goat anti-rabbit IgG (Vector Laboratory, 1:1000); and goat anti-rat IgG (Vector Laboratories, 1:2000).
Quantification of MHC II, CD11c, CD3 and 7/4 Cells by Immunohistochemistry and Methyl Green Staining
Brain sections were stained according to the aforementioned protocol, mounted 1:24 on 2× subbed slides, and counterstained with methyl green (Vector) according to the manufacturer’s protocol. Sections were viewed with a Zeiss Axioplan light microscope (Zeiss, Thornwood, NY). Numbers of positively stained cell profiles with a methyl green-stained nucleus were counted throughout the first two brain tissue sections containing both blades of the dentate gyrus. The number of cells reported is the total number of cell profiles counted for the two sections.
For MHC II, the number of positively stained cells was plotted as a function of time and analyzed using a two-way ANOVA followed by Bonferroni post-tests comparing all doses at each time. For CD11c and CD3 cells, the numbers of positively stained cells for each marker were plotted as a function of time and analyzed using a two-way ANOVA followed by Bonferroni post-tests comparing 35 Gy to controls at each time. To examine the effect of aging on the presence of MHC II-, CD3- and CD11c-expressing cells, the numbers of cells from control animals for each marker was analyzed using one-way ANOVA followed by Bonferroni post-tests comparing all times to the earliest time recorded. All statistical analyses were performed in Prism 5.01 (GraphPad Software).
Quantification of MHC II-Positive Cells as a Function of Brain Section
Sections from the 0- and 35-Gy animals were stained for MHC II and methyl green (Vector Laboratories). Cell profiles were counted for each section throughout the cerebral cortex for each animal. Images of the sections were captured using an RT Spot camera (Diagnostic Instruments, Inc., Sterling Heights, MI) at a magnification of 10×. Images were combined with the photomerge function in Adobe Photoshop CSII (Adobe Systems, San Jose, CA). The area of each section was calculated with ImageJ (NIH, Bethesda, MD), and the total number of cells was divided by the section area in square millimeters. The number of cells per mm2 was plotted as a function of the approximate distance to Bregma, based on a mouse brain atlas (22).
RESULTS
Assessment of Body Weight
As part of monitoring the general health of the irradiated mice, animals were weighed every month for the duration of the study. Some of the animals were observed to develop overgrown teeth at approximately 3 months postirradiation after doses of 25 Gy or more. The teeth were clipped in these mice every 7–10 days as necessary. As shown in Fig. 1, there was a dose-dependent effect on the ability to gain weight. Data analysis using a two-way ANOVA comparing all doses revealed a significant interaction effect between the radiation dose and time postirradiation [F(44, 561) = 12.65, P < 0.0001], a significant effect of dose alone [F(4, 561) = 54.01, P < 0.0001], a significant effect of time postirradiation [F(11, 561) = 44.70, P < 0.0001], and a significant effect of subject matching [F(51, 561) = 18.35, P < 0.0001]. Bonferroni post-test analysis revealed a significant reduction in weight gain of animals irradiated with 25 and 35 Gy relative to control animals starting at 2 months postirradiation. Mice irradiated with 5 and 15 Gy only showed a significant difference in weight from control animals at the two latest times (11 and 12 months postirradiation).
FIG. 1.

Weight gain after cranial irradiation at different doses. Each point represents 7–13 mice; error bars are SEM.
Analysis of mRNA Transcript Levels of Inflammatory Mediators
To characterize the neuroinflammatory response to cranial irradiation, brain hemispheres were collected from irradiated animals at numerous times up to 1 year after radiation exposure and processed for cDNA. qRT-PCR was performed to assess mRNA expression levels of genes involved in neuroinflammation (Supplementary Table 1, http:dx.doi.org/10.1667/RR2587.1.S1). Members of the IL1 family (IL1A, IL1B, IL1R1, IL1R2 and caspase-1), IL6, TNFA and TGFB were selected to look at inflammatory cytokine responses. GFAP was selected as a marker of astrocyte activation, MHC II and CD11b were selected as markers of microglial activation, and ICAM-1 was used as a marker of endothelial cell activation. In addition, COX-1, COX-2, PTGES, PTGES2 and PTGES3 were selected to investigate the contribution of the prostaglandin pathway. SOD-2, HO-1 and GSTP were selected as markers that respond to oxidative stress, and CCR2 and CCL2 were selected because of their known involvement with cell recruitment. The relative changes in these mRNAs were analyzed using Kruskal-Wallis tests at each time. If the Kruskal-Wallis test found a significant difference in the medians of the group (P < 0.05), it was followed by a post-hoc analysis using Dunn’s multiple comparison tests.
Final analysis revealed that cranial irradiation yields a biphasic or multiphasic neuroinflammatory response (Supplementary Table 2, http:dx.doi.org/10.1667/RR2587.1.S1). Representative examples of genes that significantly changed are shown in Fig. 2. After doses of 15 Gy or more, significant differences in the mRNA levels for CCL2, IL1A and TNFA were observed at the two earliest times (4 h and 1 day). There were also early, significant differences seen in the levels for the endothelial and glial activation markers, ICAM-1 and GFAP, after irradiation at higher doses. Not surprisingly, increases in the transcript levels for HO-1 were noted at 1 day postirradiation, suggesting increased oxidative stress. Of note, increases in transcript levels were not observed across all markers since no acute change was detected for CCR2, IL1B, IL1R1 and IL6. At 3 days postirradiation, gene transcript levels in the high-dose (25 and 35 Gy) irradiated animals were no longer significantly different than their age-matched controls. In fact, MHC II expression was significantly decreased at 3 days and decreased at 7 days, although the difference at this time did not reach statistical significance. Transcript levels of COX-1, IL1A, IL1R1, IL6 and TNFA also appeared to decrease in these animals, although these differences failed to reach significance.
FIG. 2.

Relative changes in selected neuroinflammatory mRNA level as a function of radiation dose and time after irradiation. Panel A: TNFA; panel B: CCL2; panel C: GFAP; panel D: MHC II; panel E: ICAM-1; panel F: HO-1. Kruskal-Wallis tests were run at each time for each gene followed by Dunn’s multiple comparison tests comparing each dose to its respective control. Each bar represents the mean for 3 to 5 mice in each condition; error bars are SEM. *P < 0.05, ** P < 0.01, ***P < 0.001.
One month after irradiation, expression of glial activation markers differed significantly from controls, with MHC II and GFAP mRNA levels being increased in mice exposed to doses of 25 Gy or higher. A similar trend was also observed for TNFA and CCL2, but the increases did not reach significance. Although these same genes appeared to show modest dose-dependent increases at 3 months postirradiation, none were found to be statistically significant.
At 6 months, transcript levels for multiple cytokines, chemokines and activation markers were increased after the two highest doses of radiation. Significant elevations were seen at both doses for CCL2, GFAP, HO-1 and TNFA and at 25 Gy for COX-1, MHC II and TGFB. Other transcripts (CCR2, IL1A, IL1B, IL1R1 and IL6; Table 2) appeared to increase in a similar manner but failed to reach significance at either dose. Unexpectedly, ICAM-1 levels were significantly increased in the 5-Gy group but not at higher doses. ICAM-1 was similarly increased at 12 months postirradiation. In contrast, transcript levels for all other genes did not significantly differ from controls at this last time.
Analysis for the Presence of Radiation Necrosis
Brain sections from all doses and times were stained with cresyl violet and hematoxylin/eosin to determine whether gross pathological changes developed after radiation exposure. In particular, we looked for macroscopic and microscopic evidence of radiation necrosis. Macroscopically, radiation necrosis appears as hemorrhagic coagulation necrosis (23). Microscopically, it manifests as areas of edema, neuroglial necrosis, blood-brain barrier dysfunction, hemorrhage, vascular damage, capillary malformations, perivascular cuffing of leukocytes, lipid-laden macrophages, and demyelination with surrounding areas of hypertrophic and reactive astrocytes and microglia (23–25). We also looked for changes thought to precede the development of necrosis, such as dilation of blood vessels, enlargement of endothelial cell nuclei, thickening of the blood vessel walls, and astrocyte hypertrophy (24, 25). Despite extensive analysis of tissue sections, at no time in the study was there clear evidence of radiation necrosis in this particular mouse strain, even after the highest dose of 35 Gy. Moreover, immunohistochemical staining of control and 35-Gy irradiated tissues with anti-mouse IgG at all times revealed no evidence of focal blood-brain barrier disruption. Therefore, based on the consistent findings of neuroinflammatory changes at the mRNA level after the higher doses of radiation and the large number of times, further detailed immunohistochemical analysis was limited to the 0- and 35-Gy irradiated animals only. In the following sections, unless otherwise specified, references to irradiated animals denote animals cranially irradiated with 35 Gy.
Cellular Analysis of Neuroinflammation
1. Astrocytes
Consistent with observed increases in mRNA levels, GFAP protein expression was increased at early and late times after a 35-Gy radiation exposure. Examination of GFAP-stained sections showed radiation-induced evidence of astrocyte activation in the caudal striatum, an area essentially devoid of GFAP staining in control mice, beginning at 3 days (data not shown). These increases in striatal GFAP staining persisted at all times until the conclusion of the study. At 1 month, increased GFAP staining, hypertrophy and other changes in astrocyte morphology were present in both the striatum and more caudal brain regions, including the hippocampus (compare Fig. 3A and B). These changes persisted for up to 1 year postirradiation (Fig. 3C).
FIG. 3.

Glial activation after cranial irradiation. Tissue sections from 0- and 35-Gy irradiated animals were immunohistochemically stained for GFAP, a marker of astrocytes (panels A–C), or for Iba-1, a marker of myeloid cells (panels D–F). Panels A and D show the results for control mice that did not receive radiation. Panels B and C show GFAP staining 7 days and 12 months after irradiation, respectively. Panels E and F show Iba-1 staining at 1 and 12 months postirradiation, respectively. Insets in each panel are representative of individual glial cell morphologies. Scale bars in panels A and D represent 100 μm for the large panels and 12.5 μm for the insets.
2. Microglia
To investigate the effect of cranial irradiation on microglia, sections were stained with antibodies to Iba-1, which is a surface marker present on microglia and other myeloid cells. This enables visualization of microglial morphology and size, which change with activation. By 7 days postirradiation, changes in microglial morphology became apparent throughout the dorsoventral axis of the brain as demonstrated in the hippocampus (compare Fig. 3D and E). There was a decrease in punctate Iba-1 staining in the irradiated brains, most likely due to a retraction of fine processes in the irradiated animals that allowed for more distinct microglial staining. The microglial response to radiation was heterogeneous: some of the microglia adopted a slightly activated phenotype (hyper-ramified) (26), while others exhibited a more classically activated morphology after cranial irradiation, particularly in ventral parts of the brain (insets, Fig. 3E and F). At later times, the microglial response became more homogeneous (Fig. 3F), with widespread evidence of increased hypertrophy and classically activated morphology.
To further investigate microglial activation, sections were stained for MHC II (Fig. 4A and B) and a dot-plot analysis was performed (Fig. 4C) to show cell localization. In normal brain, MHC II is constitutively expressed by perivascular macrophages and a small number of white matter microglia. At early times (4 h, 1, 3 and 7 days), MHC II staining was limited to perivascular macrophages in both irradiated and control animals, as is typically seen in the normal brain. Beginning at 3 days, the number of MHC II-positive cell profiles that co-localized with methyl green nuclear staining was quantified for each time and analyzed with a two-way ANOVA and Bonferroni post-tests comparing all groups (Fig. 4D). Two-way ANOVA revealed a significant interaction effect between the dose of cranial irradiation delivered and the time postirradiation [F(20, 134) = 9.447, P < 0.0001], a significant effect of the delivered dose [F(4, 134) = 66.30, P < 0.0001], and a significant effect of time [F(5, 134) = 51.13, P < 0.0001]. At 3 and 7 days, the number of MHC II-positive cells appeared to be decreased in animals exposed to γ-radiation doses ≥5 Gy, but no significant difference was found at any dose. At 1 month, the number of MHC II-positive cells increased in a dose-dependent manner after doses ≥15 Gy. In contrast to nonirradiated animals, irradiated animals possessed MHC II-positive parenchymal microglia in addition to positively stained perivascular cells (Fig. 4A and B). Parenchymal MHC II-positive microglia also displayed an activated morphology. This dose-dependent increase in the number of MHC II-positive cells was observed at all later times. The increased number of MHC II-positive cells and the presence of labeled parenchymal microglia were not homogeneously distributed throughout the brain; there was a predilection for higher numbers in ventral than in dorsal brain regions (Fig. 4C).
FIG. 4.

Delayed increase in cells expressing MHC II after cranial irradiation. Animals were cranially irradiated and euthanized at various times for up to 1 year postirradiation. Sections from 0- and 35-Gy irradiated animals were immunohistochemically stained for MHC II and counterstained for methyl green at 1 month (panel A) and at 6 months (panel B) postirradiation. Scale bars in panels A and B, 100 μm. Representative dot plots demonstrating the distribution of MHC II-positive cells in the brain were constructed for 0- and 35-Gy animals at 6 months (panel C). Each point represents one MHC II-positive cell. The total number of cells from the first two sections of brain tissue containing both blades of the dentate gyrus was quantified in control and 35-Gy irradiated animals, starting at 3 days (panel D). Data were analyzed with a two-way ANOVA and Bonferroni post-tests comparing all doses within a time. Graph shows means ± SEM, n = 5–6 per condition at each time. The following symbols were used to distinguish the statistical significances determined within times for comparing one dose to one another: * compared to 0 Gy, + compared to 5 Gy, # compared to 15 Gy, and @ compared to 25 Gy. One symbol represents P ≤ 0.05, two symbols represent P ≤ 0.01, and three symbols represent P ≤ 0.001.
Of note, an interesting effect of aging on the number of MHC II-positive cells was observed in the control animals (Fig. 4D). One-way ANOVA revealed significant differences between the number of MHC II-positive cells over the course of the study ( [F(5, 28) = 6.155, P < 0.0006]. Bonferroni post-tests demonstrated increases in the numbers of MHC II-positive cells at 1 year and 6 months compared to the number of cells determined in control mice at 3 days.
Analysis of Endothelial Cell Activation and Immune Cell Infiltration
1. Endothelial cell activation
Similar to the timing of mRNA level increases, immunohistochemical evidence of ICAM-1 protein expression was increased as early as 1 day after cranial irradiation with 35 Gy (Fig. 5). At 1 and 3 days postirradiation, increased staining was observed predominantly in the small vessels (Fig. 5B). At later times, the staining in small vessels was less prominent, whereas increased staining was observed in larger vessels and patchy staining became apparent. Figure 5C and D illustrates this pattern at 1 and 6 months after irradiation. Subsequently, a change in the pattern of ICAM-1 staining occurred at 6 and 12 months postirradiation, when definitive cellular staining appeared. The most prominent of these ICAM-1-positive cells were highly branched with morphologies similar to the MHC II-positive cells described above (Fig. 5D inset).
FIG. 5.
Early and late ICAM-1 induction after cranial irradiation in endothelial cells and glia. Tissue sections from 0- and 35-Gy irradiated animals were immunohistochemically stained for ICAM-1. Representative images of the hippocampus are shown for control, nonirradiated animals (panel A) and irradiated animals at 1 day (panel B), 1 month (panel C), and 6 months (panel D). The inset in panel D shows the morphology of occasional parenchymal cells that stained for ICAM-1 at this later time. Scale bar in panel A is 200 μm for the large panels and 12.5 μm for the inset.
2. Neutrophils
The early induction and expression of ICAM-1 in irradiated animals suggested that radiation might result in the recruitment of peripheral immune cells into the brain. Staining for the 7/4 antigen was performed to determine whether cranial irradiation recruited neutrophils to the brain. Beginning at 4 h, the numbers of 7/4-positive cell profiles that co-localized with methyl green nuclear staining were quantified at each time in 35-Gy irradiated and control tissues. Quantification of 7/4-positive cells revealed that radiation induced a significant increase in neutrophil infiltration over controls only at 12 h postirradiation (96 ± 62 compared to 43 ± 18, P < 0.001; Bonferroni post-test) with no evidence of increased infiltration at any other time.
3. T cells
To determine if radiation facilitates an increase in the number of T cells recruited to the brain, sections were stained for CD3 antigen (Fig. 6A and B). Interestingly, dot plot analysis revealed that CD3-positive cells appeared to be selectively recruited to white matter areas (Fig. 6C). Beginning at 7 days, the numbers of CD3-positive cell profiles that co-localized with methyl green nuclear staining were quantified at each time and analyzed using a two-way ANOVA with Bonferroni post-tests comparing irradiated animals to controls (Fig. 6D). There was a significant interaction effect between radiation dose and time postirradiation [F(4, 44) = 4.322, P = 0.005], a significant effect of radiation dose alone [F(1, 44) = 50.66, P < 0.0001] and a significant effect of time after irradiation [F(4, 44) = 9.528, P < 0.0001]. Surprisingly, at 7 days postirradiation, there was an apparent decrease in the number of CD3-positive cells in the irradiated brain, but it did not reach significance. By 1 month, post-test analysis revealed that radiation induced a significant increase in the number of CD3-positive cells in the brain (272 ± 123 compared to 21 ± 11, P < 0.01), which persisted at 3 months (427 ± 157 compared to 62 ± 30, P < 0.001), 6 months (400 ± 139 compared to 140 ± 88, P < 0.01), and 12 months (454 ± 248 compared to 153 ± 100, P < 0.001).
FIG. 6.

Delayed increase in T-cell infiltration after cranial irradiation. Animals were cranially irradiated and euthanized at various times up to 1 year postirradiation. Sections from 0- and 35-Gy irradiated animals were immunohistochemically stained for CD3 and counterstained with methyl green (Vector) at 1 month (panel A) and at 6 months (panel B) postirradiation. Scale bars in panels A and B: 100 μm, insets, 20 μm. Representative dot plots demonstrating the distribution of CD3-positive cells in the brain were constructed for 0- and 35-Gy animals at 6 months (panel C). Each point represents one CD3-positive cell. The total number of cells from the first two sections of brain tissue containing both blades of the dentate gyrus was quantified in both 0- and 35-Gy irradiated animals, starting at 7 days (panel D). Data were analyzed with a two-way ANOVA and Bonferroni post-tests comparing 0- and 35-Gy mice for each time. Graph shows means ± SEM, n = 5–6 per condition for each time: *P < 0.05, **P < 0.01, and ***P < 0.001.
As was the case for MHC-II-positive cells, the number of CD3-positive cells appeared to increase in control animals with increasing age (Fig. 6D). Indeed, one-way ANOVA revealed significant differences between the number of CD3-positive cells over the course of the study [F(4, 22) = 4.903, P < 0.006]. Post-tests demonstrated differences between the numbers of CD3-positive cells in control, unirradiated brain at 1 year relative to 7 days.
4. Dendritic cells
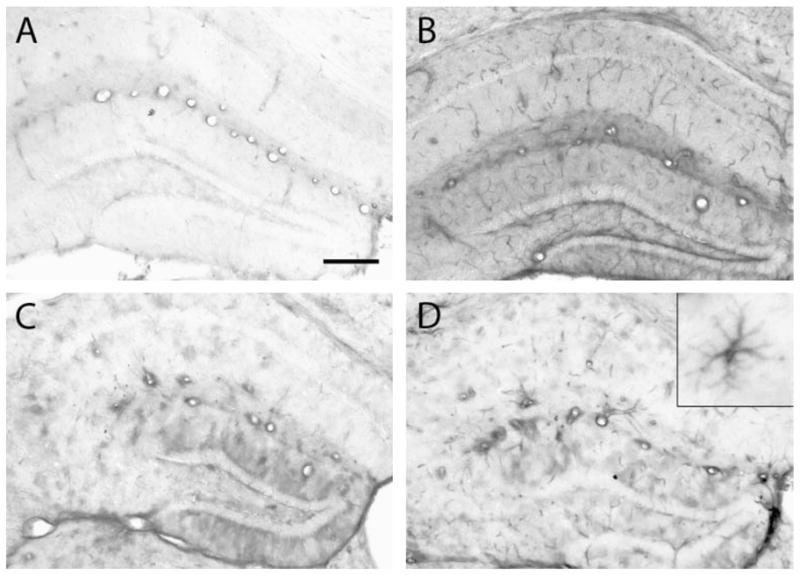
Sections were stained for the CD11c antigen to determine if radiation had the ability to increase the number of immune dendritic cells in the CNS. CD11c antigen and dendritic cells are not typically found in the normal brain parenchyma, although they are commonly observed in the dura mater, leptomeninges and choroid plexus of healthy rats (27). CD11c-positive cells were detected in the parenchyma at 1 month after cranial irradiation and were still present at 6 months postirradiation (Fig. 7A and B). CD11c-positive cells were not distributed homogeneously throughout the brain, with the majority of CD11c-positive cells being located in white matter tracts (Fig. 7C).
FIG. 7.

Delayed increase in CD11c expressing cells after cranial irradiation. Sections from 0- and 35-Gy irradiated animals were stained for CD11c antigen and methyl green (Vector). Representative photomicrographs are shown at 1 month (panel A) and 6 months (panel B) postirradiation. Scale bars in panels A and B: 100 μm. Representative dot plots demonstrating the distribution of CD11c-positive cells for 0- and 35-Gy animals at 6 months (panel C). Each point represents one CD11c-positive cell. The total number of cells from the first two sections containing both blades of the dentate gyrus was quantified in 0- and 35-Gy irradiated animals, starting at 4 h (panel D). Two-way ANOVA and Bonferroni post-tests compared 0- and 35-Gy animals for each time. Graph shows means ± SEM, n = 5–6 per condition for each time: *P ≤ 0.05, **P ≤ 0.01, and ***P ≤ 0.001.
Numbers of CD11c-positive cell profiles that co-localized with methyl green nuclear staining were determined at each time and analyzed using a two-way ANOVA with Bonferroni post-tests comparing irradiated animals to controls (Fig. 7D). This revealed a significant interaction effect between radiation dose and time postirradiation [F(7, 72) = 15.82, P < 0.0001], a significant effect of radiation dose [F(1, 72) = 64.34, P < 0.0001] and a significant effect of time postirradiation [F(7, 72) = 18.08, P < 0.0001]. Increases in the numbers of CD11c-positive cells compared to controls first reached significance at 1 month postirradiation (191 ± 67 compared to 5 ± 2, P < 0.01) and remained significantly increased above controls at both 3 months (396 ± 114 compared to 10 ± 4, P < 0.001) and 6 months (497 ± 233 compared to 24 ± 4, P < 0.001) but failed to achieve significance at 12 months (190 ± 89 compared to 136 ± 105, P > 0.05). This loss of significance at 12 months appeared to arise in part from an increased number of CD11c-positive cells in control animals (Fig. 7D). Indeed, one-way ANOVA revealed significant differences between the number of CD11c-positive cells over the course of the study [F(7, 36) = 7.875, P < 0.0001], with a significant elevation of CD11c-positive cells in unirradiated mice at 1 year compared to mice euthanized at all other times (P < 0.01; Bonferroni multiple comparison post-test).
Although increases in MHC II and CD11c expression were demonstrated in irradiated brain tissues, it was not clear whether there were cells that expressed both markers. To answer this question, sections were immunofluorescently stained for MHC II and CD11c. Although there were distinctions in the tissue distribution of these two markers, with CD11c-positive cells showing a clear predilection for white matter tracts (compare Fig. 4C to Fig. 7C), we found that many cells having morphologies consistent with activated microglia expressed both CD11c and MHC II (Fig. 8).
FIG. 8.

CD11c-positive cells express MHC II in irradiated brain. Sections from 35-Gy cranially irradiated mice were obtained 6 months after exposure and immunofluorescently labeled for MHC II (green) and CD11c (red) antigens. Scale bar: 20 μm.
Localization of Radiation Effect on Immune Cell Activation
All of the activation and immune cell markers examined in this study showed selective distribution in the rostrocaudal axis, suggesting that they were increased only in areas that were exposed to the radiation beam. To further examine this phenomenon, the total number of MHC II-positive cells was quantified from each section in a 1:24 series of tissue sections for all 0-Gy or 35-Gy irradiated animals at 6 months. The numbers of MHC II-positive cells per section were plotted as a function of the distance from bregma of the quantified tissue section, which was estimated using a mouse brain atlas (22). In contrast to control sections that uniformly showed a relatively low number of MHC II-positive cells, sections from 35-Gy irradiated animals showed a pattern of a steep increase in the number of positively stained cells followed by a plateau along the rostrocaudal axis (Supplementary Fig. 1, http//dx.dox.org/10.1667/RR2587.1.S2). Although the position at which this phenomenon was observed varied slightly between irradiated animals, the distance over which it occurred was similar (approximately 6–7 brain sections). Based on the number of sections over which this plateau effect occurred, we approximated the distance by multiplying the number of sections (6–7) by the thickness of the sections (30 μm) and the section interval (×24). This yielded an estimated distance of 4.32–5.04 mm, a value consistent with the width of the radiation beam delivered through the 5-mm slit of our collimator.
DISCUSSION
Cranial irradiation can result in numerous clinical sequelae, which contribute to the morbidity and mortality of patients. The pathogenesis of these adverse effects remains elusive, but a number of studies support a significant role for neuroinflammation. To establish a firm foundation for future mechanistic investigations, a major goal of the current study was to characterize the neuroinflammatory response of the C57BL/6 mouse brain over a wide range of doses and times after single-dose cranial irradiation. The doses used in this study are consistent with those used by other investigators (8, 18, 20, 21).
The early and late neuroinflammatory responses to cranial irradiation seen in our study are consistent with previous studies using mice and other species. Cranial irradiation of the C57BL/6 mouse resulted in dose-dependent, acute increases in mRNA levels of multiple proinflammatory mediators and markers of activation, as has been reported previously in different mouse strains (10–12, 14, 15, 18). Although no formal behavioral testing was conducted, no overt changes in behavior, grooming or balance were noted in our irradiated animals at any time, a result consistent with previous studies (8, 19, 21). Indeed, the only grossly apparent difference between animals cranially irradiated with 25 and 35 Gy and controls, which became statistically significant at 2 months postirradiation, was the failure to demonstrate age-appropriate weight gain. Similar findings have been reported in cranially irradiated rats after doses of 25 Gy at 6 months (9).
In the current study, some of the mice cranially irradiated with doses ≥25 Gy developed overgrown teeth, starting approximately 3 months postirradiation, that interfered with eating. As a result, animals were examined every 7 to 10 days, their teeth were clipped if necessary, and their food was placed at ground level for easier access. Based on dosimetry, the delivered dose was very localized, with essentially no total-body dose. We speculate, therefore, that the decreased weight seen at the two highest doses was partially due to the radiosensitivity of the salivary glands, which is well documented in mice (28–30). Some salivary gland dysfunction was probably present after all of the doses used in this study; recovery of salivary function and some glandular sparing most likely explains the relatively normal weight gain seen at the two lower doses (29, 31).
In addition to demonstrating early and late neuroinflammatory changes seen in previous work, the current study did elucidate some important differences and novel findings. Unlike previous studies using C3H mice (10, 18), cranially irradiated C57BL/6 mice did not appear to suffer from increased mortality due to brain injury. There was no mention of abnormalities in dentition in other studies, so it is unclear whether this played a role in the mortality observed by others or whether the reduced mortality in our study reflects a potential strain difference in brain radiosensitivity. Alternatively, the dose range used may have been too low to elicit a lethal response. For example, the mice in our study did not show any histological evidence of radiation necrosis, consistent with previous reports (8, 21). In contrast, Jost et al. 60 Gy delivered to the left hemisphere of BALB/c mice in 10 equal fractions was required to elicit radiation necrosis; lower doses resulted in no detectable radiation necrosis out to 10 months (32).
Our study also demonstrated an acute infiltration of neutrophils into brain at 12 h postirradiation, a phenomenon that has been described in other tissues (33). This finding is not completely surprising because previous work demonstrated increased leukocyte rolling and adhesion at 2 and 24 h postirradiation in pial vessels (13). Although the specific mechanisms were not evaluated, the increased expression of TNFA and ICAM-1 observed during this time frame likely contributed to neutrophil infiltration (7, 34, 35). Neutrophils possess NADPH oxidase and, upon stimulation, can release a burst of superoxide radicals, leading to a further increase in oxidative stress (36). We found an increase in the mRNA of heme oxygenase-1 (HO-1) after cranial irradiation at 24 h. HO-1 is a microsomal enzyme present in endothelial cells, microglia, astrocytes and neurons that is upregulated in response to inflammation, tissue injury and/or oxidative stress (37–39); however, it is unclear if this early upregulation of HO-1 is the result of inflammatory stimuli or increased oxidative stress resulting from radiation exposure and neutrophil infiltration.
One of the more interesting and novel findings in this study was the delayed increase in CNS T-cell and dendritic cell populations after cranial irradiation. The central nervous system has long been described as being protected from the peripheral immune system or “immunologically privileged,” but this is not the case. Leukocytes are known to infiltrate the normal CNS and are believed to be involved in immunological surveillance of the parenchyma (40). Previous reports have described infiltrating T cells in response to radiation, but these were involved with perivascular cuffing and radiation necrosis (24, 41–44). In this study, it appears that radiation increased T-cell surveillance in the CNS and that this persisted for up to 12 months postirradiation. To the authors’ knowledge, this is also the first report of dendritic cells appearing in the brain after cranial irradiation. Based on the times analyzed, it is unclear if the appearance of one cell type preceded another or if they appeared in response to the same stimuli.
Both T cells and dendritic cells showed a predilection for white matter. In addition, some CD11c-positive cells were found to be positive for MHC II, suggesting that these cells were mature dendritic cells and were capable of presenting antigen. T cells also appeared to be in proximity to dendritic cells (data not shown), suggesting that they may be interacting with one another. Interestingly, the appearance of T cells and dendritic cells in white matter and their proximity to each other have been reported previously in C57BL/6 mice as part of normal aging (45). Further work needs to be performed to better characterize and elucidate the functions of specific subtypes of T cells and dendritic cells, in both normal and irradiated brain.
Cranial irradiation also caused a delayed, dose-dependent increase in the number of MHC II-positive cells that persisted out to 12 months. Similar findings have been reported in rat brain after 20 Gy (9). The distribution of these cells in the brain was more homogeneous than that of the dendritic cells or T cells and did not show an obvious predilection for white matter. Consistent with upregulation of MHC II, these cells appeared to have an activated microglial morphology. Activated microglia are known to produce a number of inflammatory mediators, recruitment factors and proteases as well as reactive oxygen and nitrogen intermediates (46, 47). At 1 month, decreases in SOD2 and GSTP1 mRNA were noted (Supplementary Table 1, http://dx.doi.org/10.1667/RR2587.1.S1), and at 6 months, HO-1 mRNA levels were increased. These changes may be related to the persistent oxidative stress after radiation exposure that has been reported in the CNS by multiple investigators (48, 49). The activated microglia, along with dendritic cells and T cells, indicate that radiation induces a chronic neuroinflammatory environment, a hypothesis that is further supported by late increases in the mRNA levels for TNFA, MHC II, GFAP and CCL2.
Our study demonstrated that cranial irradiation induced the recruitment of T cells in the C57BL/6 mouse brain. MHC II-positive and CD11c-positive cells are not typically found in the young mouse CNS parenchyma under normal conditions; whether these myeloid cells arose from endogenous microglia or were recruited from the periphery after irradiation remains to be established. Evidence that CCL2, a known recruitment factor for myeloid-derived cells, is upregulated at 6 months suggests that it may play a role in recruiting cells to the irradiated brain. Indeed, 10 Gy of whole-body irradiation has been shown to recruit CD11c-positive cells from the periphery (50). Future studies are planned to better answer this question of cell origin in our model using bone marrow chimeras.
Finally, in the context of clinical practice, there is speculation that the accumulation of immune cells may be beneficial in the treatment of primary brain tumors. Gliomas represent 32% of all primary brain and CNS tumors, with glioblastoma multiforme (GBM) accounting for greater than 50% of all gliomas (51). GBM is the most aggressive type of glioma and carries an unfavorable prognosis, with a 1-year survival rate of 33% and less than 5%survival at 5 years (51); with standard of care therapeutic intervention, the mean survival is 14.6 months (52). As a result, efforts are under way to develop newer combination therapies that increase survival. One such approach is to combine immunotherapy with radiotherapy (53–55). Two of the more popular immunotherapies are adoptive T-cell transfer and dendritic cell vaccines, where both sets of immune cells are modulated ex vivo and returned to the patient (56, 57). Common hurdles for both approaches are overcoming immunosuppressive factors and immune avoidance of the CNS and CNS tumors to facilitate T-cell stimulation and cell killing as well as enhanced delivery of effector cells to the tumor site (56). Importantly, the glial activation, endothelial activation and immune cell recruitment observed in this study appeared to be limited to areas that were exposed to the radiation beam, as demonstrated by the rostrocaudal distribution of MHC II+ cells. Therefore, this observation of radiation-targeted immune activation suggests that combination radiotherapy and immunotherapy could yield improved therapeutic outcomes. Indeed, a synergistic effect of the two modalities was recently demonstrated in a rat glioma model (58).
In summary, our study demonstrates that cranial irradiation results in a bi- or multiphasic inflammatory response with a delayed infiltration of immune cells in the C57BL/6 mouse brain. In this model, cranial irradiation induced an acute recruitment of neutrophils and caused rapid endothelial and glial activation. This response was followed by a delayed infiltration of T cells beginning at 1 month postirradiation that was accompanied by the appearance of MHC II-positive dendritic cells. These cells remained in the brain for months, indicating that cranial irradiation leads to persistent neuroinflammatory changes in the C57BL/6 mouse brain. Further studies will be required to determine whether such alterations in the CNS microenvironment affect brain function or responses to other challenges, including age-associated changes.
Supplementary Material
Acknowledgments
Support for this work was provided by grant R01 CA114587 from the National Institutes of Health. MJM is a trainee in the Medical Scientist Training Program funded by NIH T32 GM007356 and also received support from a Training Grant in Neuroinflammation and Glial Cell Biology (T32 NS051152). The authors would like to thank Lee Trojancyzk and Joanna Daeschner for assistance with animal irradiation and tissue preparation, Dr. Sean Hurley for guidance in quantitative RT-PCR, Dr. Bruce Fenton for dosimetry measurements, and the University of Rochester Functional Genomics Center for carrying out the PCR assays.
Footnotes
The online version of this article (DOI: 10.1667/RR2587.1) contains supplementary information that is available to all authorized users.
References
- 1.Soffietti R, Ruda R, Trevisan E. Brain metastases: current management and new developments. Curr Opin Oncol. 2008;20:676–84. doi: 10.1097/CCO.0b013e32831186fe. [DOI] [PubMed] [Google Scholar]
- 2.Kondziolka D, Lunsford LD, Flickinger JC. The application of stereotactic radiosurgery to disorders of the brain. Neurosurgery. 2008;62(Suppl 2):707–19. doi: 10.1227/01.neu.0000316275.12962.0e. discussion 19–20. [DOI] [PubMed] [Google Scholar]
- 3.Platta CS, Khuntia D, Mehta MP, Suh JH. Current treatment strategies for brain metastasis and complications from therapeutic techniques: a review of current literature. Am J Clin Oncol. 2010;33:398–407. doi: 10.1097/COC.0b013e318194f744. [DOI] [PubMed] [Google Scholar]
- 4.Zhao W, Robbins ME. Inflammation and chronic oxidative stress in radiation-induced late normal tissue injury: therapeutic implications. Curr Med Chem. 2009;16:130–43. doi: 10.2174/092986709787002790. [DOI] [PubMed] [Google Scholar]
- 5.Genc M, Genc E, Genc BO, Kiresi DA. Significant response of radiation induced CNS toxicity to high dose steroid administration. Br J Radiol. 2006;79:e196–9. doi: 10.1259/bjr/50789043. [DOI] [PubMed] [Google Scholar]
- 6.Khan RB, Krasin MJ, Kasow K, Leung W. Cyclooxygenase-2 inhibition to treat radiation-induced brain necrosis and edema. J Pediatr Hematol Oncol. 2004;26:253–5. doi: 10.1097/00043426-200404000-00008. [DOI] [PubMed] [Google Scholar]
- 7.Kyrkanides S, Olschowka JA, Williams JP, Hansen JT, O’Banion MK. TNF alpha and IL-1beta mediate intercellular adhesion molecule-1 induction via microglia-astrocyte interaction in CNS radiation injury. J Neuroimmunol. 1999;95:95–106. doi: 10.1016/s0165-5728(98)00270-7. [DOI] [PubMed] [Google Scholar]
- 8.Chiang CS, McBride WH, Withers HR. Radiation-induced astrocytic and microglial responses in mouse brain. Radiother Oncol. 1993;29:60–8. doi: 10.1016/0167-8140(93)90174-7. [DOI] [PubMed] [Google Scholar]
- 9.Mildenberger M, Beach TG, McGeer EG, Ludgate CM. An animal model of prophylactic cranial irradiation: histologic effects at acute, early and delayed stages. Int J Radiat Oncol Biol Phys. 1990;18:1051–60. doi: 10.1016/0360-3016(90)90440-u. [DOI] [PubMed] [Google Scholar]
- 10.Hong JH, Chiang CS, Campbell IL, Sun JR, Withers HR, McBride WH. Induction of acute phase gene expression by brain irradiation. Int J Radiat Oncol Biol Phys. 1995;33:619–26. doi: 10.1016/0360-3016(95)00279-8. [DOI] [PubMed] [Google Scholar]
- 11.Kyrkanides S, Moore AH, Olschowka JA, Daeschner JC, Williams JP, Hansen JT, et al. Cyclooxygenase-2 modulates brain inflammation-related gene expression in central nervous system radiation injury. Brain Res Mol Brain Res. 2002;104:159–69. doi: 10.1016/s0169-328x(02)00353-4. [DOI] [PubMed] [Google Scholar]
- 12.Olschowka JA, Kyrkanides S, Harvey BK, O’Banion MK, Williams JP, Rubin P, et al. ICAM-1 induction in the mouse CNS following irradiation. Brain Behav Immun. 1997;11:273–85. doi: 10.1006/brbi.1997.0506. [DOI] [PubMed] [Google Scholar]
- 13.Yuan H, Gaber MW, McColgan T, Naimark MD, Kiani MF, Merchant TE. Radiation-induced permeability and leukocyte adhesion in the rat blood-brain barrier: modulation with anti-ICAM-1 antibodies. Brain Res. 2003;969:59–69. doi: 10.1016/s0006-8993(03)02278-9. [DOI] [PubMed] [Google Scholar]
- 14.Lee WH, Sonntag WE, Mitschelen M, Yan H, Lee YW. Irradiation induces regionally specific alterations in pro-inflammatory environments in rat brain. Int J Radiat Biol. 2010;86:132–44. doi: 10.3109/09553000903419346. [DOI] [PMC free article] [PubMed] [Google Scholar]
- 15.Kalm M, Fukuda A, Fukuda H, Ohrfelt A, Lannering B, Bjork-Eriksson T, et al. Transient inflammation in neurogenic regions after irradiation of the developing brain. Radiat Res. 2009;171:66–76. doi: 10.1667/RR1269.1. [DOI] [PubMed] [Google Scholar]
- 16.Moore AH, Olschowka JA, Williams JP, Paige SL, O’Banion MK. Radiation-induced edema is dependent on cyclooxygenase 2 activity in mouse brain. Radiat Res. 2004;161:153–60. doi: 10.1667/rr3116. [DOI] [PubMed] [Google Scholar]
- 17.Siegal T, Pfeffer MR. Radiation-induced changes in the profile of spinal cord serotonin, prostaglandin synthesis, and vascular permeability. Int J Radiat Oncol Biol Phys. 1995;31:57–64. doi: 10.1016/0360-3016(94)E0305-4. [DOI] [PubMed] [Google Scholar]
- 18.Chiang CS, Hong JH, Stalder A, Sun JR, Withers HR, McBride WH. Delayed molecular responses to brain irradiation. Int J Radiat Biol. 1997;72:45–53. doi: 10.1080/095530097143527. [DOI] [PubMed] [Google Scholar]
- 19.Daigle JL, Hong JH, Chiang CS, McBride WH. The role of tumor necrosis factor signaling pathways in the response of murine brain to irradiation. Cancer Res. 2001;61:8859–65. [PubMed] [Google Scholar]
- 20.Chiang CS, McBride WH. Radiation enhances tumor necrosis factor alpha production by murine brain cells. Brain Res. 1991;566:265–9. doi: 10.1016/0006-8993(91)91707-8. [DOI] [PubMed] [Google Scholar]
- 21.Chiang CS, McBride WH, Withers HR. Myelin-associated changes in mouse brain following irradiation. Radiother Oncol. 1993;27:229–36. doi: 10.1016/0167-8140(93)90079-n. [DOI] [PubMed] [Google Scholar]
- 22.Franklin KBJ, Paxinos G. The mouse brain in stereotaxic coordinates. San Diego: Academic Press; 1997. [Google Scholar]
- 23.Gutin PH, Leibel SA, Sheline GE. Radiation injury to the nervous system. New York: Raven Press; 1991. [Google Scholar]
- 24.Calvo W. Experimental radiation damage of the central nervous system. Recent Results Cancer Res. 1993;130:175–88. doi: 10.1007/978-3-642-84892-6_15. [DOI] [PubMed] [Google Scholar]
- 25.Kamiryo T, Kassell NF, Thai QA, Lopes MB, Lee KS, Steiner L. Histological changes in the normal rat brain after gamma irradiation. Acta Neurochir (Wien) 1996;138:451–9. doi: 10.1007/BF01420308. [DOI] [PubMed] [Google Scholar]
- 26.Wilson MA, Molliver ME. Microglial response to degeneration of serotonergic axon terminals. Glia. 1994;11:18–34. doi: 10.1002/glia.440110105. [DOI] [PubMed] [Google Scholar]
- 27.McMenamin PG. Distribution and phenotype of dendritic cells and resident tissue macrophages in the dura mater, leptomeninges, and choroid plexus of the rat brain as demonstrated in wholemount preparations. J Comp Neurol. 1999;405:553–62. [PubMed] [Google Scholar]
- 28.Coppes RP, Vissink A, Konings AW. Comparison of radiosensitivity of rat parotid and submandibular glands after different radiation schedules. Radiother Oncol. 2002;63:321–8. doi: 10.1016/s0167-8140(02)00129-9. [DOI] [PubMed] [Google Scholar]
- 29.Grundmann O, Mitchell GC, Limesand KH. Sensitivity of salivary glands to radiation: from animal models to therapies. J Dent Res. 2009;88:894–903. doi: 10.1177/0022034509343143. [DOI] [PMC free article] [PubMed] [Google Scholar]
- 30.Konings AW, Coppes RP, Vissink A. On the mechanism of salivary gland radiosensitivity. Int J Radiat Oncol Biol Phys. 2005;62:1187–94. doi: 10.1016/j.ijrobp.2004.12.051. [DOI] [PubMed] [Google Scholar]
- 31.Deasy JO, Moiseenko V, Marks L, Chao KS, Nam J, Eisbruch A. Radiotherapy dose-volume effects on salivary gland function. Int J Radiat Oncol Biol Phys. 2010;76:S58–63. doi: 10.1016/j.ijrobp.2009.06.090. [DOI] [PMC free article] [PubMed] [Google Scholar]
- 32.Jost SC, Hope A, Kiehl E, Perry A, Travers S, Garbow JR. A novel murine model for localized radiation necrosis and its characterization using advanced magnetic resonance imaging. Int J Radiat Oncol Biol Phys. 2009;75:527–33. doi: 10.1016/j.ijrobp.2009.06.007. [DOI] [PMC free article] [PubMed] [Google Scholar]
- 33.Johnston CJ, Hernady E, Reed C, Thurston SW, Finkelstein JN, Williams JP. Early alterations in cytokine expression in adult compared to developing lung in mice after radiation exposure. Radiat Res. 2010;173:522–35. doi: 10.1667/RR1882.1. [DOI] [PMC free article] [PubMed] [Google Scholar]
- 34.Staykova M, Maxwell L, Willenborg D. Kinetics and polarization of the membrane expression of cytokine-induced ICAM-1 on rat brain endothelial cells. J Neuropathol Exp Neurol. 2000;59:120–8. doi: 10.1093/jnen/59.2.120. [DOI] [PubMed] [Google Scholar]
- 35.Wong D, Prameya R, Dorovini-Zis K. Adhesion and migration of polymorphonuclear leukocytes across human brain microvessel endothelial cells are differentially regulated by endothelial cell adhesion molecules and modulate monolayer permeability. J Neuroimmunol. 2007;184:136–48. doi: 10.1016/j.jneuroim.2006.12.003. [DOI] [PubMed] [Google Scholar]
- 36.Brechard S, Tschirhart EJ. Regulation of superoxide production in neutrophils: role of calcium influx. J Leukoc Biol. 2008;84:1223–37. doi: 10.1189/jlb.0807553. [DOI] [PMC free article] [PubMed] [Google Scholar]
- 37.Matsuoka Y, Okazaki M, Kitamura Y. Induction of inducible heme oxygenase (HO-1) in the central nervous system: is HO-1 helpful or harmful? Neurotox Res. 1999;1:113–7. doi: 10.1007/BF03033275. [DOI] [PubMed] [Google Scholar]
- 38.Syapin PJ. Regulation of haeme oxygenase-1 for treatment of neuroinflammation and brain disorders. Br J Pharmacol. 2008;155:623–40. doi: 10.1038/bjp.2008.342. [DOI] [PMC free article] [PubMed] [Google Scholar]
- 39.Emerson MR, LeVine SM. Heme oxygenase-1 and NADPH cytochrome P450 reductase expression in experimental allergic encephalomyelitis: an expanded view of the stress response. J Neurochem. 2000;75:2555–62. doi: 10.1046/j.1471-4159.2000.0752555.x. [DOI] [PubMed] [Google Scholar]
- 40.Hickey WF. Basic principles of immunological surveillance of the normal central nervous system. Glia. 2001;36:118–24. doi: 10.1002/glia.1101. [DOI] [PubMed] [Google Scholar]
- 41.Tiller-Borcich JK, Fike JR, Phillips TL, Davis RL. Pathology of delayed radiation brain damage: an experimental canine model. Radiat Res. 1987;110:161–72. [PubMed] [Google Scholar]
- 42.Kureshi SA, Hofman FM, Schneider JH, Chin LS, Apuzzo ML, Hinton DR. Cytokine expression in radiation-induced delayed cerebral injury. Neurosurgery. 1994;35:822–9. doi: 10.1227/00006123-199411000-00004. discussion 29–30. [DOI] [PubMed] [Google Scholar]
- 43.Yamaguchi N, Yamashima T, Yamashita J. A histological and flow cytometric study of dog brain endothelial cell injuries in delayed radiation necrosis. J Neurosurg. 1991;74:625–32. doi: 10.3171/jns.1991.74.4.0625. [DOI] [PubMed] [Google Scholar]
- 44.Hopewell JW, van der Kogel AJ. Pathophysiological mechanisms leading to the development of late radiation-induced damage to the central nervous system. Front Radiat Ther Oncol. 1999;33:265–75. doi: 10.1159/000061239. [DOI] [PubMed] [Google Scholar]
- 45.Stichel CC, Luebbert H. Inflammatory processes in the aging mouse brain: participation of dendritic cells and T-cells. Neurobiol Aging. 2007;28:1507–21. doi: 10.1016/j.neurobiolaging.2006.07.022. [DOI] [PubMed] [Google Scholar]
- 46.Aloisi F. Immune function of microglia. Glia. 2001;36:165–79. doi: 10.1002/glia.1106. [DOI] [PubMed] [Google Scholar]
- 47.Hanisch UK. Microglia as a source and target of cytokines. Glia. 2002;40:140–55. doi: 10.1002/glia.10161. [DOI] [PubMed] [Google Scholar]
- 48.Limoli CL, Rola R, Giedzinski E, Mantha S, Huang TT, Fike JR. Cell-density-dependent regulation of neural precursor cell function. Proc Natl Acad Sci U S A. 2004;101:16052–7. doi: 10.1073/pnas.0407065101. [DOI] [PMC free article] [PubMed] [Google Scholar]
- 49.Fukuda H, Fukuda A, Zhu C, Korhonen L, Swanpalmer J, Hertzman S, et al. Irradiation-induced progenitor cell death in the developing brain is resistant to erythropoietin treatment and caspase inhibition. Cell Death Differ. 2004;11:1166–78. doi: 10.1038/sj.cdd.4401472. [DOI] [PubMed] [Google Scholar]
- 50.Simard AR, Rivest S. Bone marrow stem cells have the ability to populate the entire central nervous system into fully differentiated parenchymal microglia. FASEB J. 2004;18:998–1000. doi: 10.1096/fj.04-1517fje. [DOI] [PubMed] [Google Scholar]
- 51.CBTRUS Statistical Report Primary Brain and Central Nervous System Tumors Diagnosed in the United States in 2004–2006 [database on the Internet] [accessed May 7th, 2010];Central Brain Tumor Registry of the United States. 2010 Available from: http://www.cbtrus.org.
- 52.Clarke J, Butowski N, Chang S. Recent advances in therapy for glioblastoma. Arch Neurol. 2010;67:279–83. doi: 10.1001/archneurol.2010.5. [DOI] [PubMed] [Google Scholar]
- 53.Kamrava M, Bernstein MB, Camphausen K, Hodge JW. Combining radiation, immunotherapy, and antiangiogenesis agents in the management of cancer: the Three Musketeers or just another quixotic combination? Mol Biosyst. 2009;5:1262–70. doi: 10.1039/b911313b. [DOI] [PMC free article] [PubMed] [Google Scholar]
- 54.Grauer OM, Wesseling P, Adema GJ. Immunotherapy of diffuse gliomas: biological background, current status and future developments. Brain Pathol. 2009;19:674–93. doi: 10.1111/j.1750-3639.2009.00315.x. [DOI] [PMC free article] [PubMed] [Google Scholar]
- 55.Demaria S, Bhardwaj N, McBride WH, Formenti SC. Combining radiotherapy and immunotherapy: a revived partnership. Int J Radiat Oncol Biol Phys. 2005;63:655–66. doi: 10.1016/j.ijrobp.2005.06.032. [DOI] [PMC free article] [PubMed] [Google Scholar]
- 56.Okada H, Kohanbash G, Zhu X, Kastenhuber ER, Hoji A, Ueda R, et al. Immunotherapeutic approaches for glioma. Crit Rev Immunol. 2009;29:1–42. doi: 10.1615/critrevimmunol.v29.i1.10. [DOI] [PMC free article] [PubMed] [Google Scholar]
- 57.Mitchell DA, Fecci PE, Sampson JH. Immunotherapy of malignant brain tumors. Immunol Rev. 2008;222:70–100. doi: 10.1111/j.1600-065X.2008.00603.x. [DOI] [PMC free article] [PubMed] [Google Scholar]
- 58.Persson BR, Koch CB, Grafstrom G, Ceberg C, Rosenschold PM, Nittby H, et al. Radiation immunomodulatory gene tumor therapy of rats with intracerebral glioma tumors. Radiat Res. 2010;173:433–40. doi: 10.1667/RR1733.1. [DOI] [PubMed] [Google Scholar]
Associated Data
This section collects any data citations, data availability statements, or supplementary materials included in this article.