Abstract
Activation of the aryl hydrocarbon receptor (AHR) by 2,3,7,8-tetrachlorodibenzo-p-dioxin (TCDD) is required for AHR dependent transcriptional activation and TCDD toxicity. We previously reported that aqueous tryptophan exposed to sunlight through window glass (aTRP) contains multiple photoproducts, including the well characterized 6-formylindolo[3,2-b]carbazole (FICZ), capable of activating the AHR and inducing CYP1A and CYP1A-mediated enzyme activities. We report here the isolation from aTRP and chemical characterization and synthesis of 1-(1H-indol-3-yl)-9H-pyrido[3,4-b]indole (IPI), a compound previously identified as a natural product of marine ascidia and now shown to be a TRP photoproduct with AHR-inducing properties. IPI, FICZ and TCDD produced equieffective induction of CYP1A-mediated 7-ethoxyresorufin deethylase (EROD) activity in chick embryo primary hepatocytes and mammalian Hepa1c1c7 cells. EROD induction by IPI was markedly curtailed in AHR-defective c35 cells, supporting the AHR dependence of the IPI response. Although IPI had a higher EC50 for EROD induction than FICZ, the much larger amount of IPI than FICZ in aTRP makes IPI a prominent contributor to EROD induction in aTRP. IPI was detected in TRP-containing culture medium under ambient laboratory conditions but not in TRP-free medium, consistent with its production from TRP. Cotreatment of hepatocytes with submaximal EROD-inducing doses of IPI and FICZ or TCDD produced additive increases in EROD without synergistic or inhibitory interactions. IPI and FICZ were readily metabolized by cultured hepatocytes. In addition to increasing CYP1A4 mRNA and EROD, IPI and FICZ decreased hepatocyte phosphoenolpyruvate carboxykinase mRNA expression and glucose output, biological effects associated with TCDD metabolic dysregulation. The findings underscore a role for sunlight in generating AHR-activating bioactive molecules.
Keywords: tryptophan photoproduct, aryl hydrocarbon receptor, cytochrome P4501A, mass spectrometry, 1-(1H-indol-3-yl)-9H-pyrido[3, 4-b]indole (IPI), 6-formylindolo[3, 2-b]carbazole (FICZ)
1. Introduction
The environmental toxin and industrial by-product TCDD (2,3,7,8- tetrachlorodibenzo-p-dioxin, dioxin) is the most potent and best studied activator of the aryl hydrocarbon receptor (AHR), a ligand activated transcription factor and member of the Per-Arnt-Sim (PAS) protein family [1, 2]. Activation of the AHR by TCDD elicits diverse pathological effects, including tumor promotion and metabolic dysregulation leading to a wasting syndrome [1–3].
Ligand activation causes the AHR to migrate from cytosol to the nucleus and form a complex with the aryl hydrocarbon nuclear translocator (ARNT) that can bind dioxin-responsive elements (DREs) in the promoter regions of target genes including xenobiotic-metabolizing cytochrome P450 (CYP1A) enzymes and TCDD-inducible poly [ADP-ribose] polymerase (TiPARP, PARP7) [4]. In addition to environmental toxins like TCDD, some natural products have recently been shown to activate the AHR, among which tryptophan (TRP) derivatives comprise a large group [5]. These include TRP derivatives ingested in the diet or produced by metabolism in vivo, such as indolo[3,2-b]carbazole (ICZ) [6], and photoproducts formed by exposure of TRP to UV or visible light [7–9], among which 6-formylindolo[3,2-b]carbazole (FICZ) is the best characterized [10]. The discovery of natural compounds that can bind and activate the AHR has stimulated a search for diverse AHR ligands that may elicit pathologic effects (e.g., tumorigenesis, metabolic dysregulation) or as yet unrecognized physiologic activities of the AHR.
We previously reported that exposure of an aqueous solution of TRP to sunlight passing through window glass (aTRP) produces multiple photoproducts capable of activating the AHR and inducing CYP1A-mediated enzyme activities, including arachidonic acid epoxygenation and 7-ethoxyresorufin deethylation (EROD) [8]. FICZ was identified in one of fourteen fractions obtained by separation of aTRP by reverse phase high pressure liquid chromatograph (RP-HPLC), all of which exhibited CYP1A inducing capacity. That prior study showed that photoactivated TRP contains many AHR inducers in addition to FICZ. We report here the identification, chemical characterization and synthesis of a novel photoproduct present in aTRP that induces CYP1A with high efficacy: 1-(1H-indol-3-yl)-9H-pyrido[3,4-b]indole (IPI).
2. Material and methods
2.1. Materials
Chemicals were from Sigma-Aldrich, (St. Louis, MO), TCI (Portland, OR) or Alfa Aesar (Ward Hill, MA) and were used without further purification. Tissue culture medium and additives were from GIBCO BRL Life Technologies (Gaithersburg, MD). HPLC chemicals were of HPLC or LC/MS grade. Fertilized White Leghorn chicken eggs were obtained from Burr Farm (Hampton, CT), TCDD was from the NCI Chemical Carcinogen Repository, (Kansas City, MO) and FICZ was from Biomol/Enzo Life Sciences (Plymouth Meeting, PA).
2.2. Cell culture, EROD (7-ethoxyresorufin deethylase) and glucose output assays
Chick embryo hepatocytes (CEH) were cultured as previously described [4, 8]. Briefly, livers were removed from 15 or 16 day old chick embryos, minced and disaggregated with 0.05% collagenase. Cell suspensions were centrifuged three times (1,000 rpm, 4 °C, 7 min). The combined pellets were suspended in standard Ham’s medium with 2% FBS (Std. Ham’s). Hepatocytes were plated in 96-well microtiter plates (Costar white-walled clear-bottom, Corning Inc.) at 80,000 cells per well in 0.16 ml of medium or in 24-well plates at 0.5 × 10⁶ cells per well in 1 ml of medium for measurement of EROD activity, or in 6-well plates at 3 × 10⁶ cells in 3 ml of medium for measurement of glucose output. Cultured cells were allowed to rest for 48 h before medium change and treatment. All treatments of CEH or Hepa1c1c7 cells were in custom-prepared TRP-free medium (Millipore, Billerica, MA) as previously described [8]. Hepa1c1c7 cells and AHR defective c35 cells were obtained from ATCC (Manassas, VA) and grown in MEMα medium with 10% FBS.
EROD was measured as previously described [8] using a GeminiXS fluorescence plate reader for 96-well plates (Molecular Devices, Sunnyvale, CA) or a Hitachi F-4500 fluorescence spectrophotometer for 24-well plates, (excitation λ=558 nm, emission λ=590 nm).
Production of glucose by CEH (glucose output, GO) was measured as described [4]. Briefly, after removing treatment medium, hepatocytes were washed with phosphate buffered saline and medium was replaced with 1.5 ml of GO medium (DMEM without glucose and with 2 mM pyruvate and 20 mM lactate). After incubation for 3 h at 37 °C, the medium was collected, centrifuged at 3,000 rpm for 10 min to remove cell debris and assayed for glucose using a Glucose (GO) assay kit (GAGO-20; Sigma-Aldrich, Co., St. Louis, MO). The amount of glucose in the medium was calculated with reference to a glucose standard curve, and values were corrected for cellular protein content.
2.3. Photoactivation of TRP
Aqueous solutions of TRP were prepared at a concentration of 1.42 mg/ml of TRP, designated 100X (14.2 μg/ml, 1X, is the physiologic concentration of TRP and the TRP concentration in Std. Ham’s medium), and exposed to sunlight passing through window glass for 7 days as described previously [8]. TRP solutions at equivalent concentrations, wrapped in tin foil to prevent exposure to light, were also placed at the window, as controls. Sunlight-exposed TRP is referred to as aTRP (activated tryptophan).
2.4. HPLC resolution of the major AHR inducing component in fraction F7
Reverse phase HPLC separations were performed using a Denali C18 monomeric, 100Å, 5μm particle size reversed-phase column (4.6 mm × 250 mm; Vydac, Hesperia, CA) and the gradients and flow rates described in Results. Absorbance at 254 nm was monitored using a Waters 486 UV detector (Waters Corporation, Milford, MA). The signal was transmitted from the UV detector through a Flo-One Beta detector (Packard Instrument Company, Downers Grove, IL) using the auxiliary hardware option that converts the absorbance signal to “CTS” as the readout. Eluates of interest were collected, dried under N2, reconstituted in DMSO and water as above and diluted in TRP-free medium for addition to cultured cells to measure EROD induction. The major EROD activity-inducing peak in fraction 7 of 14 original fractions separated on HPLC from a solution of aTRP [8] was isolated as described in Results.
2.5. Characterization of F7 by mass spectrometry
The purified F7 was evaporated to dryness and reconstituted in 1 ml of 2% acetonitrile in ddH2O containing 0.1% formic acid (solvent A), vortexed and then centrifuged at 16,000 × g for 5 min to remove particulates. Sample supernatants were further diluted 1:9 (vol:vol) with solvent A and were transferred to an autosampler vial to determine the accurate molecular mass and formula of purified F7 by on-line LC-MS analysis. The LC system comprised a Zorbax SB-AQ C18 column (2.1 × 100 mm, 1.8 μm particle size, Agilent Technologies, Santa Clara, CA) and a 1200 rapid resolution system containing a binary pump, on-line degasser, thermostat dual 54-well plate autosampler and a thermostat column compartment (Agilent Technologies, Santa Clara, CA). A rapid resolution cartridge (Eclipse XDB-C8, Agilent Technologies) was placed in front of the column to prevent clogging. The LC flow was introduced into an Agilent 6220 accurate mass TOF (time-of-flight) mass spectrometer, equipped with a dual spray electrospray ionization (ESI) source. A separate isocratic pump was set to deliver an internal reference mass solution to the ESI source for continuous mass calibration during sample analysis. LC parameters were set as follows: 5 μl injection volume, 0.4 ml/min mobile phase flow rate, 40 °C column temperature and 8 °C autosampler temperature. The mobile phase consisted of 0.1% formic acid in ddH2O (mobile phase A) and 0.1% formic acid in acetonitrile (mobile phase B). The gradient was: 0–2 min, 2% B; 2–17 min, to 98% B; 17–22 min, 98% B; 22 to 27 min, to 2% B. Mass spectra were acquired in 4 GHz (high resolution) mode with 1.41 spectra/sec sampled over a mass/charge (m/z) range of 50–1000. The TOF capillary voltage was set at 4000 V and the fragmentor at 175 V. The nebulizer pressure was 35 psi, and the N2 drying gas was maintained at a flow rate of 12 L/min at 250 °C. MS spectra were collected over the range of 50–1000 m/z in positive ion mode and then processed using Agilent MassHunter Qualitative Analysis Software (version B.03).
For molecular structure identification, MS/MS spectra were acquired using an Agilent Q-TOF tandem mass spectrometer by varying collision energies from 15–45 eV. For pseudo MS3, fragment ions were generated in the ESI source by increasing the fragmentor voltage to 275 V and used as precursor ions for collision-induced dissociation (CID) with N2 as the collisional gas and varying collision energies from 5–35 eV. The instrumental parameters used for the Q-TOF were analogous to those used for the TOF. Briefly, the [M+H]+ ions and fragment ions generated in the ion source were selected by the first (quadrupole) mass analyzer, subjected to fragmentation in a collision cell and resulting product ions were detected by a second (TOF) mass analyzer.
2.6. Synthesis of 1-(1H-indol-3-yl)-9H-pyrido[3,4-b]indole (IPI)
For the synthesis of IPI as described in Results, microwave-based reactions were performed on a CEM-Discover Microwave irradiator, using the dynamic heating mode with a power limit of 250 W and pressure limit of 17 psi. Flash chromatography was performed on silica gel 60 (230–400 mesh) for product purification. For product characterization, 1H and 13C NMR spectra were acquired on a Bruker DRX-500 spectrometer at 500 MHz for 1H and 125 MHz for 13C.
2.7. Measurement of IPI and FICZ in aTRP solutions and in tissue culture medium
The concentrations of IPI and FICZ in 1X aTRP were calculated based on extrapolations from measurements made in more concentrated solutions using an Agilent 6460 Triple Quad LC/MS system equipped with a JetStream ESI source and operated in the multiple reaction monitoring (MRM) mode. LC parameters were the same as described above except that the gradient used was: 0–2 min, 30% B; 2–12 min to 65% B; 12–12.5 min, to 95% B; 12.5–14.5 min, 95% B; 14.5–15 min, to 30% B; 15–20 min, 30% B. Heated N2 gas (12 L min−1 at 400 °C) was used as the sheath gas to facilitate evaporation of solvent from the ionization chamber. MRM analysis was performed in the positive ion mode. The MRM settings included the following transitions: m/z 284 → 167, 115 for IPI and m/z 285 → 257 for FICZ using unit resolution for both quadruple 1 and 3 (Q1 and Q3) mass analyzers. The data were processed using Agilent Mass Hunter Quantitative Analysis Software. To quantify IPI, 90 μl of a 100X solution of aTRP was mixed with 10 μl of acetonitrile, while for FICZ, an aliquot of aTRP was dried under nitrogen gas and resuspended in 10% acetonitrile to obtain a concentration of 1125X. A more concentrated solution was required to measure FICZ because of its weaker MS signal. Standard curves contained serial dilutions of a mixture of IPI and FICZ, at concentrations in the linear range for detection of each.
For experiments examining levels of IPI and FICZ in tissue culture medium or metabolism of IPI and FICZ, the compounds were measured as described above in medium obtained before and after incubation with CEH, without concentration or dilution.
2.8. cDNA preparation and Quantitative Reverse Transcriptase-Polymerase Chain Reaction (qRT-PCR)
Total RNA was extracted from CEH (3×10⁶ cells per well from 6-well dishes) using RNA STAT-60 (Tel-Test “B,” Friendswood, TX) following the manufacturer’s directions. cDNA was prepared as follows: 1 μg of total RNA, 4 μl of qScript cDNA SuperMix (Quanta Biosciences, Gaithersburg, MD) and water, to a final volume of 20 μl, were mixed together and incubated for 5 min at 25 °C, 40 min at 42 °C, 5 min at 85 °C. cDNA was diluted with 80 μl of water before using it for RT-PCR. For RT-PCR, primers and annealing temperatures were the following: CYP1A4, 5′-ggacggaggctgacaaggtg-3′, 5′-tgctgcaggatggtggtgag-3′, 59 °C; PEPCK, 5′-actggtgagcaggggttatg-3′ and 5′-tgcatgcaagtgacagatca-3′, 55 °C. Reaction mixtures contained: 2μl of cDNA, 10 μl of PerfeCTa SYBR Green FastMix (Quanta Biosciences), 1 ul of each primer (10 μM) and 6 μl of nuclease free water. An Eppendorf Mastercycler epgradient machine was used for 40 cycles of amplification. The fold-changes in mRNA were calculated using the standard 2−ΔΔCt method [11] with actin mRNA serving as a control for normalization.
2.9. Statistics and data analysis
Statistical significance of differences in group means was evaluated using unpaired t tests (Graph Pad Prism 4 software, San Diego CA), with p<0.05 as the criterion for significance. Concentration-response curves were compared using four-parameter logistic regression, assessed using Graph Pad Prism 4 software. EC50 values were obtained from these equations. To measure additive effects of IPI and TCDD or FICZ on EROD we compared the observed effects of the combinations to theoretical best fit curves for additive agonists based on the model of Poch and Pancheva [12]. Statistical comparisons of theoretical and best-fit curves were performed using the extra sum-of-squares F test.
3. Results
3.1. Isolation of the main EROD inducing peaks in fraction 7 of 14 fractions collected from RP-HPLC separation of an aTRP solution exposed to sunlight for 7 days
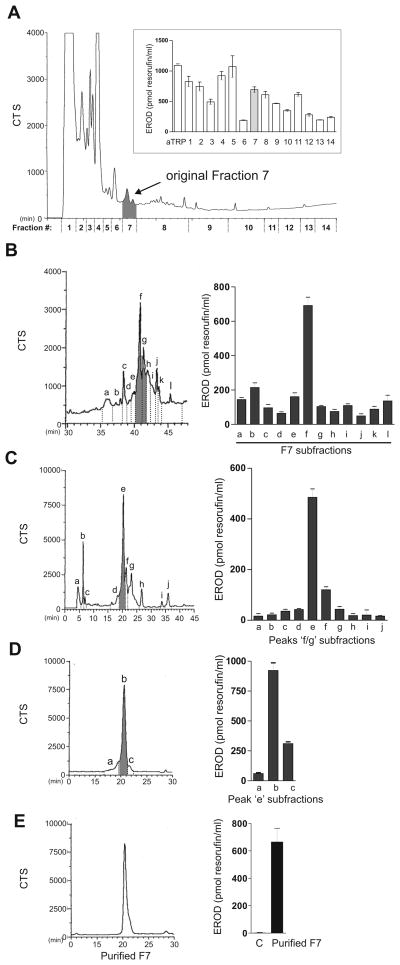
We previously reported [8] the separation by HPLC of 14 UV-absorbing fractions in a solution of activated tryptophan (aTRP) after a 7-day exposure to sunlight and found that all of the fractions induced EROD activity to varying extents (Fig. 1A). Since Fraction 7 (F7) produced substantial EROD induction with fewer UV absorbing peaks than prior eluting fractions, it seemed likely to contain a prominent and effective EROD inducer. Therefore, we set out to identify the main EROD-inducing molecular species in F7.
Fig. 1. Purification of the main CYP1A inducer in Fraction 7.
A, Adaptation of Fig. 5 from [8] showing UV absorption for 14 fractions collected from RP-HPLC separation of 22.5X (250 μl of a 1.42 mg/ml aTRP solution) on a gradient of 35–85% acetonitrile in TFA-acidified water at 1 ml per min for 40 min. EROD induction for the 14 fractions, shown in insert. B, RP-HPLC separation of Fraction 7 from 1A by a gradient of 5–85% acetonitrile in acidified water for 80 min at 1 ml per min (left panel). EROD induction by the 12 UV-absorbing peaks (right bar graph). C, Resolution of peaks ‘f+g’ from 1B on a gradient of 35–85% acetonitrile in acidified water for 200 min at 0.5 ml per min (left panel). EROD activity of the 10 peaks (right bar graph). D, Peak ‘e’ collected from several RP-HPLC runs (1C) resolved by RP-HPLC on a gradient of 35–85% acetonitrile in acidified water for 400 min at 0.4 ml per min into 3 peaks (left panel). EROD induction by the peaks (right bar graph). E, Peak ‘b’ from 1D was resolved again on the same gradient as in D. A single peak, purified F7 (left panel) was used to assay EROD activity (right bar graph) and for further characterization.
F7, which eluted between 10 and 12 min [8], was collected from several independent HPLC separations of 0.25 ml of 100X aTRP, dried, dissolved in 5% acetonitrile and subjected to a second HPLC separation on a gradient of 5–85% acetonitrile in TFA-acidified water for 80 min at 1 ml per min. Twelve UV absorbing peaks were obtained from this second HPLC separation (Fig. 1B, left panel), each of which was separately tested for induction of EROD activity in CEH (Fig. 1B, bar graph). Subfraction ‘f’, which elicited the highest EROD activity, along with the neighboring peak ‘g’ were collected from multiple HPLC separations, pooled and then resolved by a third HPLC gradient of 35–85% acetonitrile (200 min, 0.5 ml/min). Ten new peaks were obtained (Fig. 1C, left panel), among which peak ‘e’ was the main EROD inducer (Fig. 1C, bar graph). Further resolution of peak ‘e’, collected from several HPLC runs, on a HPLC gradient of 35–85% acetonitrile:water, 400 min, 0.4 ml/min (Fig. 1D, left panel) resulted in a single major peak ‘b’ and two shoulders. Peak ‘b’ which elicited the highest EROD activity (Fig. 1D, bar graph) was resolved again using the same gradient. A single peak with EROD activity (Fig. 1E) was obtained. This purified F7 was used for further characterization.
3.2. Identification of purified F7 by mass spectrometry
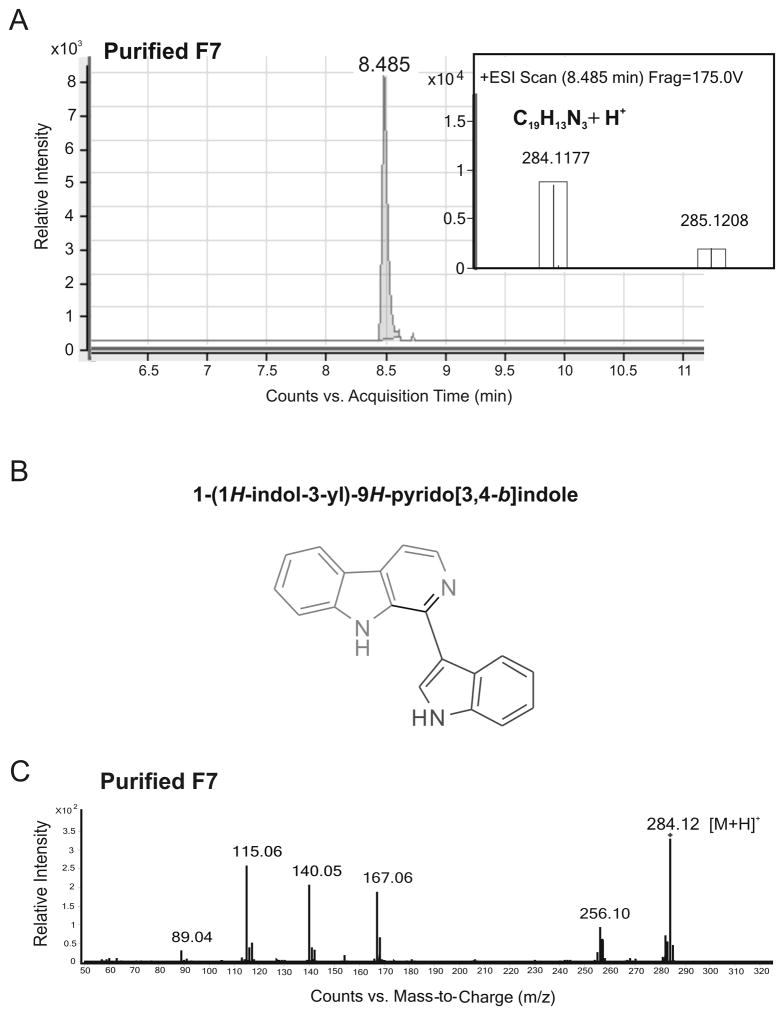
As shown in Fig. 2A, accurate mass measurement of the major ion at m/z 284.1177 [M+H]+ in the LC-ESIMS spectrum of the purified F7 provided the empirical formula C19H13N3 (calculated [M+H]+: 284.1182; Δ=1.7 ppm). A data base search (http://www.chemspider.com) using formula C19H13N3 yielded 53 candidates. One of them, 1-(1H-indol-3-yl)-9H-pyrido[3,4-b]indole (ChemSpider ID 8509482) (Fig. 2B) was consistent with the observed fragmentation pattern in the MS/MS product ion spectrum of the purified F7, showing three major fragment ions at m/z 167, 140 and 115 (Fig. 2C).
Fig. 2. Accurate mass, proposed chemical structure and MS/MS spectrum of purified F7.
A, Extracted ion chromatogram from the reverse phase LC/MS analysis of purified F7. Purified F7 eluted at 8.5 min. The inset shows the [M+H]+ ion at m/z 284.1177 (accurate mass) for purified F7, which corresponds to an empirical molecular formula of C19H13N3 with 1.7 ppm mass accuracy. The observed isotopes are depicted in boxes showing goodness of fit to the assigned formula based on predicted isotope ratios. B, Proposed chemical structure of purified F7. C, MS/MS product ion spectrum of the m/z= 284.12 [M+H]+ ion for purified F7 (collision energy, 40 eV).
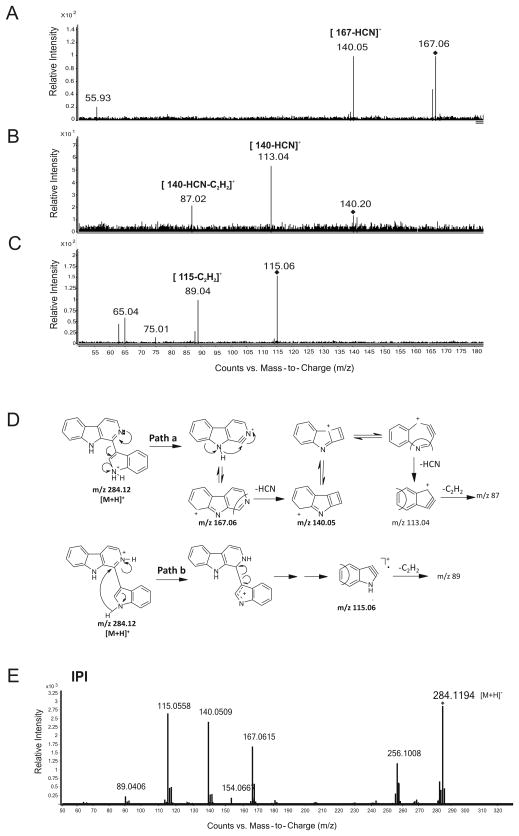
The pseudo MS3 spectra of the m/z 167, 140 and 115 ions are shown in Fig. 3A–C, and their putative formation and major fragmentation pathways are illustrated in Fig. 3D. In the pseudo MS3 product ion spectrum of the m/z 167 ion (Fig. 3A), the m/z 140 ion was observed as the only major product ion indicating a structural linkage between the two ions. The 27 Da mass difference between them indicated that the m/z 140 ion was formed by the loss of a neutral molecule of HCN from the m/z 167 ion, which is most likely to result from the m/z 284 precursor ion through heterolytic cleavage of the bond linking the β-carboline and the indole rings (see Fig. 3D, Path a). In the pseudo MS3 product ion spectrum of the m/z 140 ion (Fig. 3B), the two major product ions at m/z 113 and 87 are likely to be formed from the m/z 140 ion by the sequential loss of HCN (27 Da) and C2H2 (26 Da) molecules. Both m/z 167 and 140 ions would be expected to be stabilized by charge delocalization due to the presence of multiple resonance structures (as shown in Fig. 3D). The m/z 115 ion is interpreted as a stable radical ion resulting from fragmentation of the m/z 284 precursor ion via Path b in Fig. 3D. This is supported by the pseudo MS3 product ion spectrum of the m/z 115 ion (Fig. 3C) in which the m/z 89 ion is likely to be formed by the loss of C2H2 (26 Da) molecule. On the basis of the above mass spectrometric evidence, the purified F7 was tentatively identified as IPI.
Fig. 3. Identification of purified F7.
A–C, Pseudo MS3 product ion spectra for the F7 m/z 167 (collision energy, 15 eV) (A), 140 (collision energy, 25 eV) (B) and 115 (collision energy, 25eV) (C) ions. D, Scheme for the formation and the fragmentation of the major product ions (m/z 167.06, 140.05 and 115.06) shown in Fig. 2C and Fig. 3A–C. E, MS/MS analysis of the synthesized IPI (m/z= 284.1194).
3.3. Chemical synthesis of 1-(1H-indol-3-yl)-9H-pyrido[3,4-b]indole (IPI)
The putative structure for F7, 1-(1H-indol-3-yl)-9H-pyrido[3,4-b]indole, also known previously as Eudistomin U [13] and here given the acronym IPI for simplicity, was chemically synthesized using a single step procedure (Supplementary Fig. 1). A mixture of tryptamine (160 mg, 1 mmol), 1H-indole-3-carboxylic acid (161 mg, 1 mmol), and triphenylphosphite (315 μl, 1.2 mmol) in pyridine (1 ml/l) was heated to 200 °C for 10 min under microwave irradiation and then rapidly cooled to ambient temperature. The reaction mixture was condensed under vacuum and purified by column chromatography (methanol 0–20% in dichloromethane) to provide a yellow powder (161 mg, 57% yield) which in chloroform/hexane formed fine yellow needle-like structures. This one-step procedure is novel and has the advantage of avoiding multi-step sequences involving harsh reaction conditions, transition metals and/or toxic organic oxidants such as DDQ (2,3-dichloro-5,6-dicyano-p-benzoquinone), used in previously reported synthetic procedures for this compound [14–17].
1H and 13C NMR spectra of the synthesized IPI (Supplementary Fig. 2 and 3) agreed with the spectra reported by Badre et al. [13]. The MS/MS spectrum of the synthesized IPI (Fig. 3E), revealed a CID fragmentation pattern essentially indistinguishable from that of the purified F7 from the sunlight-exposed aTRP mixture (Fig. 2C), confirming that IPI is indeed the molecular identity of the purified F7.
3.4 Comparison of EROD induction by IPI, FICZ and TCDD
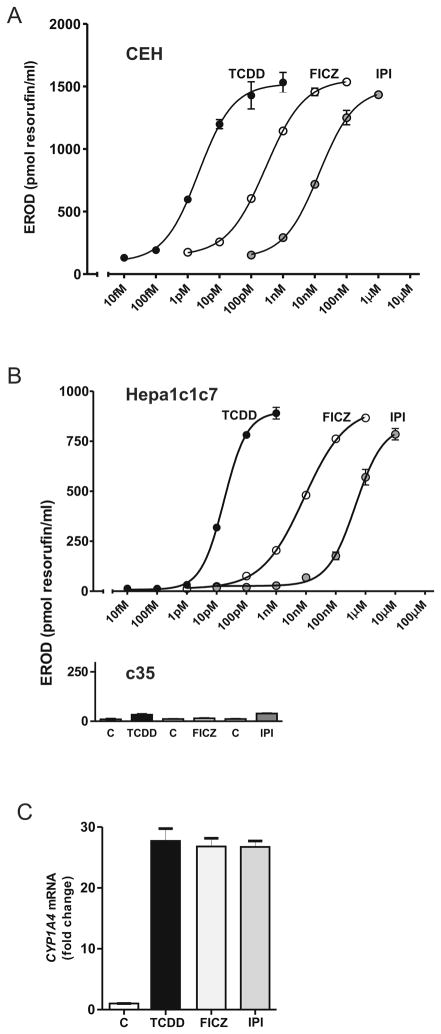
Dose response curves for induction of CYP1A4-dependent EROD activity in avian hepatocytes (CEH) treated with IPI, FICZ or TCDD for 24 h are shown in Fig. 4A. The three agents elicited equieffective EROD induction but differed in relative potencies. Mean EC50 values (nM ± SE) from six independent experiments each for IPI, FICZ and TCDD were 16.7 ± 2.4, 1.1 ± 0.3, and 0.003 ± 0.0005, respectively. Those mean values correspond to relative potencies compared to TCDD (assigned a potency =1) of 1.7 × 10⁻⁴ for IPI and 3 × 10⁻³ for FICZ.
Fig. 4. Comparison of effects of IPI, FICZ and TCDD on CYP1A4 mediated EROD activity.
A, Representative dose-response curves for EROD induction in CEH treated for 24 h with IPI, FICZ or TCDD at the concentrations shown. B, Representative dose-response curves for EROD induction at 24 h in Hepa1c1c7 cells (upper panel). EROD induction in AHR-defective c35 cells at 24 h by IPI (1 μM), FICZ (100 nM) or TCDD (1nM) (lower panel). C, CYP1A4 expression measured by RT-qPCR using total RNA from CEH treated with IPI (1 μM), FICZ (100 nM) or TCDD (1 nM) for 6 h or solvent control (C).
IPI, FICZ and TCDD also elicited equieffective EROD induction in murine Hepa1c1c7 cells and had the same potency order as in the avian hepatocytes, showing that the compounds elicited similar responses in a mammalian cell line as in primary CEH (Fig. 4B, upper panel). The mean EC50 values were higher in Hepa1c1c7 cells than in CEH: 458, 8.5 and 0.017 nM, for IPI, FICZ and TCDD, respectively, indicating lower potencies for all three compounds in the Hepa1c1c7 cells than in the primary hepatocytes. EROD activity in response to IPI, FICZ and TCDD in Hepa1c1c7 derived AHR-defective c35 cells was reduced by more than 90 % (Fig. 4B, lower panel), consistent with AHR dependence of the EROD induction. Consistent with the increase in EROD, IPI, like FICZ and TCDD, increased mRNA expression of the AHR target gene CYP1A4 (Fig. 4C), the cytochrome P450 responsible for EROD induction in CEH [18].
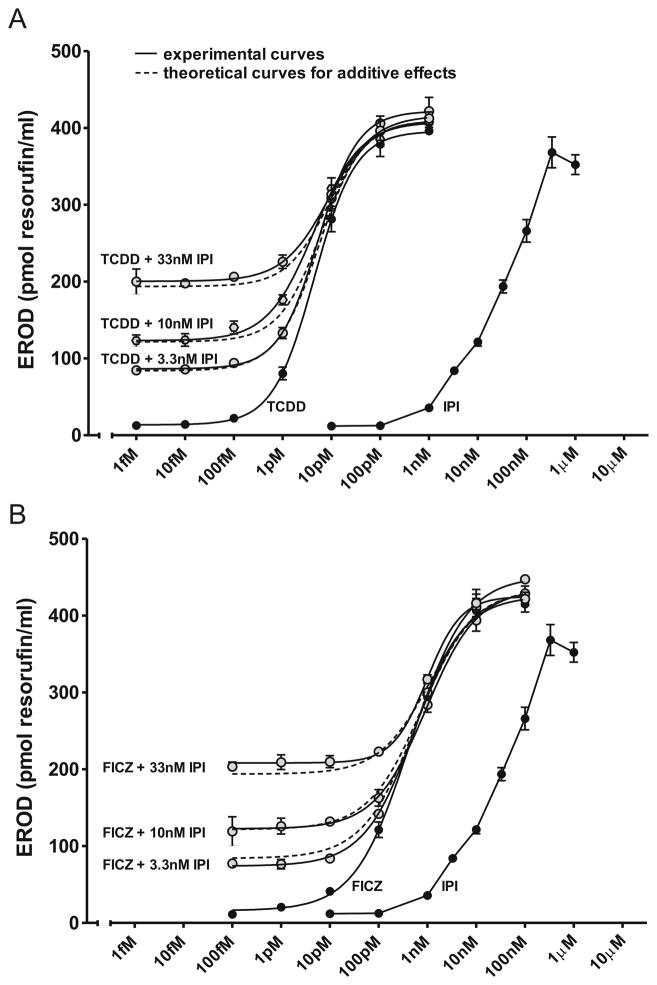
To determine whether synergistic or inhibitory effects were observed when IPI or FICZ were added to CEH cultures together or combined with TCDD, we examined the effects of submaximal concentrations of IPI and TCDD (Fig. 5A) or FICZ (Fig. 5B) on EROD. Best-fit curves of the experimental data were compared to theoretical curves for additive effects as described in Material and Methods. No synergistic or inhibitory interactions were observed. Rather, EROD results were precisely what would be expected for additive induction responses, indicating that the AHR response to a mixture of these compounds at submaximal AHR activating concentrations of each would be expected to reflect the sum of the components in the mixture.
Fig. 5. Additive effects on EROD induction by IPI when combined with TCDD or FICZ.
Dose response curves for EROD activity in CEH treated for 24 h with IPI, FICZ, TCDD or a combination of IPI and TCDD (A) or of IPI and FICZ (B) at the concentrations shown in the figure. Analysis as described in Material and Methods.
3.5. Relative amounts of IPI and FICZ in sunlight-exposed TRP
The concentrations of IPI and FICZ in 1X aTRP exposed to sunlight for 7 days were measured by MRM as described in Materials and Methods (Section 2.7). For two separate solutions of aTRP exposed to sunlight in April, the concentrations of IPI were 6.5 and 7.3 nM and for FICZ 112 and 102 pM, respectively. For a solution of aTRP exposed in January, a period with less sunlight, the concentrations were 1.5 nM for IPI and 38 pM for FICZ.
3.6. Detection of IPI in tissue culture media
FICZ was reported to be detected in tissue culture medium after experimental exposure of the medium to light for 24 h [19]. We examined whether IPI could be detected in tissue culture medium simply under normal laboratory handling in ambient light. IPI was detected in two TRP-containing media, Std. Ham’s and DMEM but not in TRP-free medium, consistent with the production of IPI from tryptophan in tissue culture medium (Supplementary Fig. 4). We infer that ambient laboratory light conditions were sufficient to generate IPI from TRP in medium. FICZ was not detected (data not shown), probably because it was below detection limits under these conditions. The findings underscore the presence in tissue culture medium of AHR-inducing TRP photoproducts, as first shown by Kocarek et al. [20], and identify one of the components as IPI.
3.7. IPI, like FICZ, is metabolized by cells
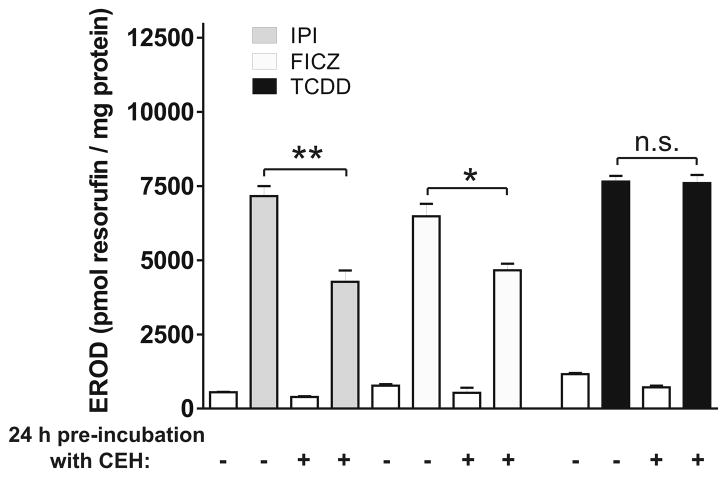
The EC50 values for EROD induction by IPI and FICZ were lower in experiments in which EROD levels were examined at 5 h after treatment (not shown) compared to 24 h after treatment, while those for TCDD were the same at 5 h and 24 h post treatment. To determine whether the change in EC50 levels for IPI or FICZ reflected metabolism by the cells, CEH were treated with IPI, FICZ or TCDD for 24 h and the conditioned medium was added to a second set of CEH and tested for EROD–inducing activity after an additional 24 h. Some groups in the second set were also treated with medium containing freshly prepared IPI, FICZ or TCDD. EROD induction was reduced for IPI or FICZ that had been preexposed to CEH for 24 h (Fig. 6) consistent with metabolism of those compounds by CEH. In contrast, EROD induction by TCDD, a compound resistant to metabolism [21], was unaffected by prior exposure to CEH.
Fig. 6. Evidence for metabolism of IPI and FICZ by hepatocytes.
EROD activity in CEH treated with fresh IPI, FICZ or TCDD, or medium containing IPI, FICZ or TCDD that had been preexposed to CEH for 24 h. IPI, FICZ and TCDD were used at submaximal EROD-inducing doses (100, 1 and 0.1 nM respectively). *, p<0.05; **, p<0.01, n.s., not significant.
To further investigate the cellular metabolism of IPI and FICZ, we measured their concentrations by MRM as described in Materials and Methods (Section 2.6) in CEH culture medium to which IPI and FICZ had been added. At zero time, IPI and FICZ were present in the medium at 1.2 and 0.15 μM, respectively, close to the concentrations intended for addition to the cell culture medium (1 and 0.1 μM, respectively). After 24 h of incubation with CEH the levels of IPI and FICZ, decreased by 98% and 81%, respectively. Nevertheless, the residual IPI and FICZ were sufficient to induce EROD substantially as shown in Fig. 6.
3.8. Effects of IPI and FICZ on gluconeogenesis
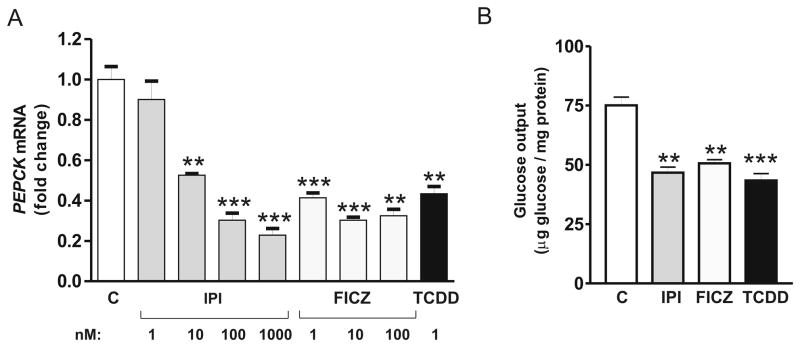
IPI and FICZ diminished mRNA levels for PEPCK (Fig. 7A) and attenuated hepatocyte glucose production (Fig. 7B), two hallmarks of AHR actions on cellular nutrient metabolism, as previously reported for TCDD [4]. Notably, IPI elicited 50% and 80% suppression of PEPCK mRNA, at 10 nM and 1 μM, respectively. FICZ at 10 nM suppressed PEPCK mRNA similarly, by ≈70%. At maximal EROD-inducing concentrations, IPI (1 μM), FICZ (100 nM) and TCDD (1 nM), each suppressed glucose output by 35–40%, as previously reported for TCDD (3).
Fig. 7. Suppression of PEPCK expression and glucose production by IPI, FICZ and TCDD.
A, PEPCK expression measured by RT-qPCR using total RNA from CEH treated with IPI, FICZ, TCDD or solvent (control (C)) at the doses shown in the Figure for 6 h. B, Glucose output by CEH after treatment for 24 h with IPI, FICZ or TCDD at doses of 1μM, 100nM and 1nM, respectively. Glucose production was measured as described in Material and Methods. **, p<0.01; ***, p<0.001 vs. the controls.
4. Discussion
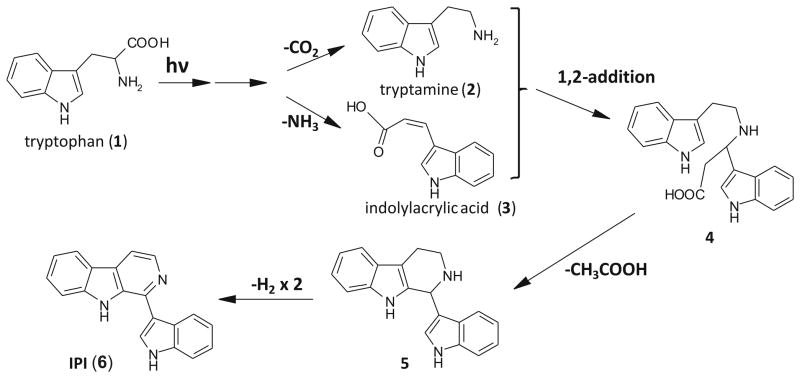
We report here the discovery of a novel TRP photoproduct with AHR-inducing properties generated by exposure of an aqueous solution of TRP to sunlight passing through window glass. The compound was purified from a mixture of photoproducts, the chemical formula was assigned by accurate mass measurement and a putative structure 1-(1H-indol-3-yl)-9H-pyrido[3,4-b]indole (to which we have assigned the acronym “IPI”), was proposed on the basis of extensive MS/MS and pseudo MS3 analyses. IPI was synthesized and its MS fragmentation pattern was confirmed to match that of the corresponding AHR-activating peak in aTRP (purified F7). Fig. 8 presents a theoretical scheme for how IPI might be expected to result from photoactivation of TRP: Photoexcitation of TRP (1) has been previously reported to lead to two common photoproducts, tryptamine (2) [22, 23] and indolylacrylic acid (3) [24]. These two compounds, after a 1,2-addition reaction, would be expected to yield structure 4, and with the loss of acetic acid, structure 5. A further loss of two molecules of H2, through oxidation, is predicted to yield IPI (6).
Fig. 8. Hypothetical scheme for the production of IPI from tryptophan by photooxidation.
See Discussion for explanation.
1-(1H-indol-3-yl)-9H-pyrido[3,4-b]indole (IPI) was previously identified as Eudistomin U, one of a group of β-carboline derivatives found in the marine invertebrate family of ascidians [13] which share a structural relationship to tryptophan [25]. Beyond a mention that Eudistomin U (IPI) may have some DNA binding activity [13, 25] there are very limited biologic data for it or the rest of the Eudistomin family. We now show that IPI (a) can be generated directly from tryptophan by photoactivation by sunlight (a finding that may be related to its original identification in Caribbean waters [13]), (b) has AHR activating activity, as evidenced by induction of EROD in diverse hepatic type cells and (c) can suppress glucose production by hepatocytes, evidence that it has biological activity related to that of other AHR activators.
At least four additional aspects of these findings warrant comment: (1) We show here that FICZ and IPI at submaximal EROD-inducing doses of each, have simple additive effects on EROD induction in cells without synergistic or inhibitory interactions. That finding, together with our previous evidence that sunlight generates multiple AHR inducing compounds in aqueous TRP, and that fractions of aTRP separated on reverse phase HPLC, when combined, produced additive EROD induction [8], indicates that the net effect of sunlight-activated TRP on AHR activity is likely to reflect the sum of many AHR inducing compounds in the aTRP mixture. Further, depending on their concentrations in aTRP, photoproducts that are less potent as AHR inducers than FICZ may contribute as much or more to the AHR-inducing effects of aTRP. The concentrations of FICZ measured here by MRM in solutions of aTRP exposed to sunlight for 7 days, 100 pM and 112 pM, are remarkably close to the value we previously found by fluorescence measurement for a different solution of aTRP exposed to sunlight for 7 days at the same time of year (72 pM) [8], supporting the validity of the MRM measurements. Although FICZ is about 20 times more potent than IPI, aTRP contained about 70 times more IPI than FICZ (7.3 and 6.5 nM for IPI vs. 100 and 112 pM for FICZ), making the contribution of IPI to AHR induction in an aTRP mixture likely to be about three times greater than that of FICZ. The important point here is that aTRP contains multiple inducing compounds most of which have yet to be chemically identified, that are likely also to contribute to its AHR activating effect.
(2) The finding that commonly used tissue culture media contain detectable amounts of IPI even under normal ambient light conditions, underscores the fact that tissue culture medium containing the amino acid TRP, can be expected also to contain AHR inducing compounds, even without the intentional addition of such inducers. Further, IPI is likely to be a major contributor to the transient AHR activation commonly observed with medium change alone [8, 19, 20], and a potential confounding factor in studying biochemical effects in tissue culture.
(3) These findings show that FICZ is extensively metabolized by primary hepatocytes as reported for other cells [10]. We found that IPI too is rapidly metabolized by hepatocytes. These metabolic findings are consistent with our previous observation that, of the original 14 fractions isolated from a solution of aTRP, fraction 7 (which contained IPI) and fraction 11 (which contained FICZ) are readily metabolized by hepatocytes, whereas some fractions seemed to be metabolism-resistant [8]. Thus, aTRP appears to contain both long- and short-lived AHR-activating photo-induced species. Accordingly, the contribution of multiple individual components in a mixture of aTRP to AHR activation may vary with time in biologic systems, depending on the extent of metabolism of the components.
Rapid metabolism has several consequences. First, as recognized for FICZ, the induction effects of aTRP compounds may be relatively short-lived, especially as compared to TCDD [10]. However, even with extensive metabolism, if initial concentrations are high, the duration of action may be sustained. Also, since sunlight in the natural environment may continuously generate TRP photoproducts, it remains to be determined whether resistance develops in sensitive biologic systems to AHR induction by repeated exposure to short-lived metabolites or whether repeated exposure to newly generated tryptophan photoproducts in response to sunlight exposure might generate new and repeated waves of AHR activation in responsive tissues. Another consequence of the rapid metabolism of compounds like IPI and FICZ is that relative potencies change with time and should be recognized as being time dependent. Lastly, investigations of the robustness of in vivo AHR inducing effects of IPI and other rapidly metabolized TRP photoproducts will be needed for understanding the physiologic implications of these findings in AHR biology.
(4) Finally, the findings are relevant to the biological effects of tryptophan photoproducts as compared to TCDD. The evidence here that IPI and FICZ not only induce CYP1A4 mRNA and CYP1A4 dependent enzyme activity, part of the “adaptive” response to AHR activation [26, 27], but also suppress PEPCK expression and glucose production, hallmarks of disrupted metabolism associated with the TCDD wasting syndrome, suggests that these compounds have at least some of the toxic potential of TCDD.
This last point leads to the important question whether “natural” AHR ligands with different structures and chemical properties from TCDD produce the same downstream effects as TCDD (and other toxic AHR ligands). Both beneficial and detrimental effects have been reported for “natural” AHR ligands. Kawajiri et al. [28] suggested that activation of AHR E3 ubiquitin ligase activity by indole-3 carbinol and the consequent degradation of β-catenin, may prevent the initiation of intestinal cancer. In a Chinese population with a high incidence of hepatocarcinoma from exposure to environmental carcinogens, dietary supplementation with broccoli sprouts, containing high concentrations of glucosinolates, precursors of AHR ligands, doubled the excretion of food and airborne pollutants [29], indicating possible chemopreventive strategies for AHR natural ligands for preventing some environmentally-induced cancers. On the other hand, increased benzo(a)pyrene adducts were produced in keratinocytes by aTRP [30] and the TRP-associated product of the Malassezia yeast (malassezin/pityriacitrin) has been associated with the pathogenesis of basal cell skin carcinoma [31]. Additionally, opposite effects have been reported for TCDD and FICZ in T-cell differentiation, wherein AHR activation by TCDD induced Treg cells that suppressed experimental autoimmune encephalomyelitis (EAE), AHR activation by FICZ interfered with Treg cell differentiation and increased inflammation-related TH17 cells [32, 33].
While we make no claims for the possible toxico/biological significance of photoactivation of aTRP by sunlight, it is interesting to consider that many plant and animal tissues contain TRP in an aqueous milieu and that photoactivation of TRP by sunlight in the natural environment could lead to ingestion of such TRP photoproducts by animals and humans. TRP photoproducts might even be generated in human blood or tissues by sunlight exposure through the eye or skin. These possibilities for TRP photoproducts as determinants of human health merit further investigation.
Supplementary Material
Highlights.
Sunlight has an important role in generating bioactive molecules that can activate the AHR
Identification of 1-(1H-indol-3-yl)-9H-pyrido[3,4-b]indole (IPI) as a new AHR-inducing tryptophan (TRP) photoproduct
IPI induces AHR-mediated P450 activity (EROD) and suppresses glucose output
IPI, a prominent component of photoactivated TRP, induces EROD additively with FICZ or TCDD
IPI was detected in tissue culture medium in ordinary ambient light conditions
Acknowledgments
This work was supported by NIH grants ES03606 (ABR), HL87062 (SSG) and RR27305 (SSG) and by a grant from the Winston Foundation (ABR). TCDD was provided by the National Cancer Institute’s Chemical Carcinogen Reference Standards Repository operated under contract by Midwest Research Institute, Kansas City, MO, NO2-CB-666000. We thank Dr. Ivan Haller for his helpful input and discussions during the initial phase of this work.
Abbreviations
- AHR
aryl hydrocarbon receptor
- aTRP
sunlight-activated tryptophan
- CEH
chick embryo hepatocytes
- CID
collision-induced dissociation
- CYP
cytochrome P450
- EROD
7-ethoxyresorufin deeethylase
- ESIMS
electrospray ionization mass spectrometry
- FICZ
6-formylindolo[3,2-b]carbazole
- GO
glucose output
- LC/MS
liquid chromatography/mass spectrometry
- MRM
multiple reaction monitoring
- MS
mass spectrometry
- MS/MS
tandem mass spectrometry
- IPI
1-(1H-indol-3-yl)-9H-pyrido[3,4-b]indole
- RP-HPLC
reverse phase high pressure liquid chromatography
- TCDD
2,3,7,8-tetrachlorodibenzo-p-dioxin
- TOF
time-of-flight
- TRP
tryptophan
References
- 1.Abel J, Haarmann-Stemmann T. An introduction to the molecular basics of aryl hydrocarbon receptor biology. Biol Chem. 2010;391:1235–48. doi: 10.1515/BC.2010.128. [DOI] [PubMed] [Google Scholar]
- 2.Fujii-Kuriyama Y, Kawajiri K. Molecular mechanisms of the physiological functions of the aryl hydrocarbon (dioxin) receptor, a multifunctional regulator that senses and responds to environmental stimuli. Proc Jpn Acad Ser B Phys Biol Sci. 2010;86:40–53. doi: 10.2183/pjab.86.40. [DOI] [PMC free article] [PubMed] [Google Scholar]
- 3.Poland A, Knutson JC. 2,3,7,8-tetrachlorodibenzo-p-dioxin and related halogenated aromatic hydrocarbons: examination of the mechanism of toxicity. Annu Rev Pharmacol Toxicol. 1982;22:517–54. doi: 10.1146/annurev.pa.22.040182.002505. [DOI] [PubMed] [Google Scholar]
- 4.Diani-Moore S, Ram P, Li X, Mondal P, Youn DY, Sauve AA, Rifkind AB. Identification of the aryl hydrocarbon receptor target gene TiPARP as a mediator of suppression of hepatic gluconeogenesis by 2,3,7,8-tetrachlorodibenzo-p-dioxin and of nicotinamide as a corrective agent for this effect. J Biol Chem. 2010;285:38801–10. doi: 10.1074/jbc.M110.131573. [DOI] [PMC free article] [PubMed] [Google Scholar]
- 5.Denison MS, Nagy SR. Activation of the aryl hydrocarbon receptor by structurally diverse exogenous and endogenous chemicals. Annu Rev Pharmacol Toxicol. 2003;43:309–34. doi: 10.1146/annurev.pharmtox.43.100901.135828. [DOI] [PubMed] [Google Scholar]
- 6.Chen YH, Riby J, Srivastava P, Bartholomew J, Denison M, Bjeldanes L. Regulation of CYP1A1 by indolo[3,2-b]carbazole in murine hepatoma cells. J Biol Chem. 1995;270:22548–55. doi: 10.1074/jbc.270.38.22548. [DOI] [PubMed] [Google Scholar]
- 7.Fritsche E, Schafer C, Calles C, Bernsmann T, Bernshausen T, Wurm M, Hubenthal U, Cline JE, Hajimiragha H, Schroeder P, Klotz LO, Rannug A, Furst P, Hanenberg H, Abel J, Krutmann J. Lightening up the UV response by identification of the arylhydrocarbon receptor as a cytoplasmatic target for ultraviolet B radiation. Proc Natl Acad Sci U S A. 2007;104:8851–6. doi: 10.1073/pnas.0701764104. [DOI] [PMC free article] [PubMed] [Google Scholar]
- 8.Diani-Moore S, Labitzke E, Brown R, Garvin A, Wong L, Rifkind AB. Sunlight generates multiple tryptophan photoproducts eliciting high efficacy CYP1A induction in chick hepatocytes and in vivo. Toxicol Sci. 2006;90:96–110. doi: 10.1093/toxsci/kfj065. [DOI] [PubMed] [Google Scholar]
- 9.Mukai M, Tischkau SA. Effects of tryptophan photoproducts in the circadian timing system: searching for a physiological role for aryl hydrocarbon receptor. Toxicol Sci. 2007;95:172–81. doi: 10.1093/toxsci/kfl126. [DOI] [PubMed] [Google Scholar]
- 10.Wei YD, Helleberg H, Rannug U, Rannug A. Rapid and transient induction of CYP1A1 gene expression in human cells by the tryptophan photoproduct 6-formylindolo[3,2-b]carbazole. Chem Biol Interact. 1998;110:39–55. doi: 10.1016/s0009-2797(97)00111-7. [DOI] [PubMed] [Google Scholar]
- 11.Livak KJ, Schmittgen TD. Analysis of relative gene expression data using real-time quantitative PCR and the 2(−Delta Delta C(T)) Method. Methods. 2001;25:402–8. doi: 10.1006/meth.2001.1262. [DOI] [PubMed] [Google Scholar]
- 12.Poch G, Pancheva SN. Calculating slope and ED50 of additive dose-response curves, and application of these tabulated parameter values. J Pharmacol Toxicol Methods. 1995;33:137–45. doi: 10.1016/1056-8719(94)00068-f. [DOI] [PubMed] [Google Scholar]
- 13.Badre A, Boulanger A, Abou-Mansour E, Banaigs B, Combaut G, Francisco C. Eudistomin U and isoeudistomin U, new alkaloids from the Caribbean ascidian Lissoclinum fragile. J Nat Prod. 1994;57:528–33. doi: 10.1021/np50106a016. [DOI] [PubMed] [Google Scholar]
- 14.Panarese JD, Waters SP. Room-temperature aromatization of tetrahydro-beta-carbolines by 2-iodoxybenzoic acid: utility in a total synthesis of eudistomin U. Org Lett. 2010;12:4086–9. doi: 10.1021/ol101688x. [DOI] [PMC free article] [PubMed] [Google Scholar]
- 15.Molina P, Fresneda PM, Garcia-Zafra S. An iminophosphorane-mediated efficeint synthesis of the alkaloid Eudistomin U of marine origin. Tetrahedron Lett. 1995;36:3581–3582. [Google Scholar]
- 16.Rocca P, Marsais F, Godard A, Queguiner G, Adams L, Alo B. New syntheses of the marine alkaloids eudistomins D and U. Tetrahedron Lett. 1995;36:7085–7088. [Google Scholar]
- 17.Massiot G, Nazabadioko S, Bliard C. Structural revision of isoeudistomin U by total synthesis. J Nat Prod. 1995;58:1636–1639. [Google Scholar]
- 18.Nakai K, Ward AM, Gannon M, Rifkind AB. Beta-naphthoflavone induction of a cytochrome P-450 arachidonic acid epoxygenase in chick embryo liver distinct from the aryl hydrocarbon hydroxylase and from phenobarbital-induced arachidonate epoxygenase. J Biol Chem. 1992;267:19503–12. [PubMed] [Google Scholar]
- 19.Oberg M, Bergander L, Hakansson H, Rannug U, Rannug A. Identification of the tryptophan photoproduct 6-formylindolo[3,2-b]carbazole, in cell culture medium, as a factor that controls the background aryl hydrocarbon receptor activity. Toxicol Sci. 2005;85:935–43. doi: 10.1093/toxsci/kfi154. [DOI] [PubMed] [Google Scholar]
- 20.Kocarek TA, Schuetz EG, Guzelian PS. Transient induction of cytochrome P450 1A1 mRNA by culture medium component in primary cultures of adult rat hepatocytes, In Vitro. Cell Dev Biol. 1993;29A:62–6. doi: 10.1007/BF02634372. [DOI] [PubMed] [Google Scholar]
- 21.Geyer HJ, Schramm KW, Feicht EA, Behechti A, Steinberg C, Bruggemann R, Poiger H, Henkelmann B, Kettrup A. Half-lives of tetra-, penta-, hexa-, hepta-, and octachlorodibenzo-p-dioxin in rats, monkeys, and humans--a critical review. Chemosphere. 2002;48:631–44. doi: 10.1016/s0045-6535(02)00030-9. [DOI] [PubMed] [Google Scholar]
- 22.Creed D. The photophysics and photochemistry of the near-UV absorbing amino acids. 1. Tryptophan and its simple derivatives. Photochem Photobiol. 1984;39:537–562. [Google Scholar]
- 23.Lucas B, Barat M, Fayeton JA, Perot M, Jouvet C, Gregoire G, Brondsted Nielsen S. Mechanisms of photoinduced Calpha[Single Bond]Cbeta bond breakage in protonated aromatic amino acids. J Chem Phys. 2008;128:164302. doi: 10.1063/1.2899648. [DOI] [PubMed] [Google Scholar]
- 24.Marklova E. Where does indolylacrylic acid come from? Amino Acids. 1999;17:401–13. doi: 10.1007/BF01361665. [DOI] [PubMed] [Google Scholar]
- 25.Cao R, Peng W, Wang Z, Xu A. beta-Carboline alkaloids: biochemical and pharmacological functions. Curr Med Chem. 2007;14:479–500. doi: 10.2174/092986707779940998. [DOI] [PubMed] [Google Scholar]
- 26.McIntosh BE, Hogenesch JB, Bradfield CA. Mammalian Per-Arnt-Sim proteins in environmental adaptation. Annu Rev Physiol. 2010;72:625–45. doi: 10.1146/annurev-physiol-021909-135922. [DOI] [PubMed] [Google Scholar]
- 27.Furness SG, Lees MJ, Whitelaw ML. The dioxin (aryl hydrocarbon) receptor as a model for adaptive responses of bHLH/PAS transcription factors. FEBS Lett. 2007;581:3616–25. doi: 10.1016/j.febslet.2007.04.011. [DOI] [PubMed] [Google Scholar]
- 28.Kawajiri K, Kobayashi Y, Ohtake F, Ikuta T, Matsushima Y, Mimura J, Pettersson S, Pollenz RS, Sakaki T, Hirokawa T, Akiyama T, Kurosumi M, Poellinger L, Kato S, Fujii-Kuriyama Y. Aryl hydrocarbon receptor suppresses intestinal carcinogenesis in ApcMin/+ mice with natural ligands. Proc Natl Acad Sci U S A. 2009;106:13481–6. doi: 10.1073/pnas.0902132106. [DOI] [PMC free article] [PubMed] [Google Scholar]
- 29.Kensler TW, Chen JG, Egner PA, Fahey JW, Jacobson LP, Stephenson KK, Ye L, Coady JL, Wang JB, Wu Y, Sun Y, Zhang QN, Zhang BC, Zhu YR, Qian GS, Carmella SG, Hecht SS, Benning L, Gange SJ, Groopman JD, Talalay P. Effects of glucosinolate-rich broccoli sprouts on urinary levels of aflatoxin-DNA adducts and phenanthrene tetraols in a randomized clinical trial in He Zuo township, Qidong, People’s Republic of China. Cancer Epidemiol Biomarkers Prev. 2005;14:2605–13. doi: 10.1158/1055-9965.EPI-05-0368. [DOI] [PubMed] [Google Scholar]
- 30.Nair S, Kekatpure VD, Judson BL, Rifkind AB, Granstein RD, Boyle JO, Subbaramaiah K, Guttenplan JB, Dannenberg AJ. UVR exposure sensitizes keratinocytes to DNA adduct formation. Cancer Prev Res (Phila Pa) 2009;2:895–902. doi: 10.1158/1940-6207.CAPR-09-0125. [DOI] [PMC free article] [PubMed] [Google Scholar]
- 31.Gaitanis G, Magiatis P, Stathopoulou K, Bassukas ID, Alexopoulos EC, Velegraki A, Skaltsounis AL. AhR ligands, malassezin, and indolo[3,2-b]carbazole are selectively produced by Malassezia furfur strains isolated from seborrheic dermatitis. J Invest Dermatol. 2008;128:1620–5. doi: 10.1038/sj.jid.5701252. [DOI] [PubMed] [Google Scholar]
- 32.Veldhoen M, Hirota K, Westendorf AM, Buer J, Dumoutier L, Renauld JC, Stockinger B. The aryl hydrocarbon receptor links TH17-cell-mediated autoimmunity to environmental toxins. Nature. 2008;453:106–9. doi: 10.1038/nature06881. [DOI] [PubMed] [Google Scholar]
- 33.Quintana FJ, Basso AS, Iglesias AH, Korn T, Farez MF, Bettelli E, Caccamo M, Oukka M, Weiner HL. Control of T(reg) and T(H)17 cell differentiation by the aryl hydrocarbon receptor. Nature. 2008;453:65–71. doi: 10.1038/nature06880. [DOI] [PubMed] [Google Scholar]
Associated Data
This section collects any data citations, data availability statements, or supplementary materials included in this article.


