Abstract
Background:
Impedance spectroscopy has been shown to be a candidate for noninvasive continuous glucose monitoring in humans. However, in addition to glucose, other factors also have effects on impedance characteristics of the skin and underlying tissue.
Method:
Impedance spectra were summarized through a principal component analysis and relevant variables were identified with Akaike's information criterion. In order to model blood glucose, a linear least-squares model was used. A Monte Carlo simulation was applied to examine the effects of personalizing models.
Results:
The principal component analysis was able to identify two major effects in the impedance spectra: a blood glucose-related process and an equilibration process related to moisturization of the skin and underlying tissue. With a global linear least-squares model, a coefficient of determination (R2) of 0.60 was achieved, whereas the personalized model reached an R2 of 0.71. The Monte Carlo simulation proved a significant advantage of personalized models over global models.
Conclusion:
A principal component analysis is useful for extracting glucose-related effects in the impedance spectra of human skin. A linear global model based on Solianis Multisensor data yields a good predictive power for blood glucose estimation. However, a personalized linear model still has greater predictive power.
Keywords: basis functions, dielectric characterization, functional data analysis, multiple regression, personal calibration, variable selection
Introduction
Diabetes is one of the most widespread global diseases (with approximately 246 million patients worldwide as estimated by the International Diabetes Federation in 2007). Diabetes patients must measure their blood glucose level (BGL) regularly in order to control it. Therefore, a noninvasive continuous blood glucose measurement device would be highly desirable. It would reduce the patient's discomfort associated with the invasive finger pricks and improve the information on trends of the BGL available to the patient.
It has been shown that noninvasive continuous glucose monitoring based on impedance spectroscopy (IS) is possible under controlled experimental conditions.1,2 The BGL has an influence on the impedance spectra of the skin and underlying tissue (SUT) in a certain frequency range. However, the skin impedance spectra are also affected by many other factors that significantly perturb the glucose-related information, especially in daily-life situations. Relevant perturbing factors are temperature fluctuations, variations of skin moisture and sweat, changes in perfusion characteristics, as well as body movements affecting the sensor-skin contact.3-5 These perturbing factors need to be compensated for to determine BGL in systems that use IS as the primary glucose-related signal.6 In order to be able to correct for such perturbing factors, a multisensor glucose monitoring system (MGMS) has been developed7 that measures BGLs both noninvasively and continuously. The bases for this MGMS are the measured effects of changes in the BGL on the impedance spectra that have been discussed in other work,8 as well as the ability of secondary sensors to track the perturbing effects.9
In this article, we address two important questions for this approach to noninvasive continuous blood glucose monitoring. First, we investigate how spectral measurements can be summarized into meaningful physiological information that can then be used for statistical modeling of the BGL. Second, we explore the merit of personalized models allowing for different coefficients for each patient. The work here does not represent a clinical validation of the multisensor concept. Using these selected data evaluation methods, a more advanced multisensor has been tested in an experimental study with a prospective global model application.10
Methods
Materials
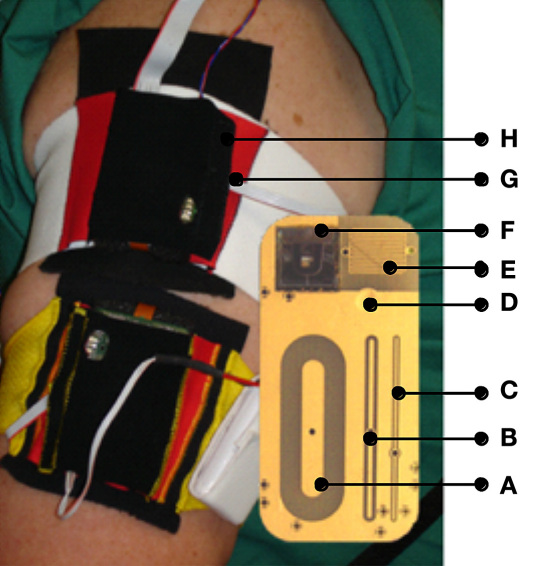
The impedance spectra of SUT are determined with a capacitive fringing field sensor (Figure 1) by measuring the response of the SUT to an externally applied alternating electric field with frequencies in the range of 0.1–100 MHz.
Figure 1.
Two Multisensors attached to the upper arm of a subject with a zoom of the Multisensor substrate holding sensors and electrodes. Fringing field sensors: (A) deep, (B) mid, and (C) shallow penetration of the electromagnetic field; (D) temperature sensor; (E) interdigitated sweat sensor (0.05 mm) for galvanic skin response for superficial sweat monitoring; (F) silicon wafer-based optical reflection sensor with three wavelengths (568/660/880 nm) and two differently shaped photodiodes for skin blood perfusion measurement; (G) humidity sensor, and (H) three-axes acceleration sensor.
The sensor features the ability to achieve different penetration depths of the electromagnetic field (EMF) into the various tissue layers by utilizing three electrodes with different characteristic geometries. Each of these electrodes provides a spectrum of the complex dielectric impedance. The impedance is transformed into admittance (1/impedance) whose real [conductance (G)] and imaginary [capacitance (C)] parts are treated separately. These signals can be associated with the physiological conductivity and permittivity of the SUT.11
The electrodes associated with the deep, mid, and shallow penetration range of the EMF are referred to as the long [A], middle [B] and short [C] electrodes, respectively (as shown in Figure 1). The EMFs of the long and middle electrodes penetrate the upper skin layers as well as the lower ones, which are well microvascularized and therefore affected by BGL changes. Thus, glucose variations are particularly seen in the long and middle signals, which are regarded as our primary signals. The short electrode penetrates only the upper skin layers. Their signals may still contain information about perturbing effects due to nonglucose-related variations of the dielectric properties of the upper skin layers, which also contribute to the long and middle signals. In principle, it can therefore be used to compensate these signals for the perturbing effects of the upper skin layers.
A silicon wafer-based optical reflection sensor with three light-emitting diodes (LEDs) at three wavelengths (568/660/880 nm) and two differently shaped photodiodes were used for skin blood perfusion measurement [F]. Skin and superficial hydration levels, which also affect the primary signals, are monitored with a sweat/moisture sensor comprising an interdigitated electrode utilizing a galvanic skin response-based measuring technique [E]. The acceleration and position relative to the centre of gravity of the device are continuously monitored using an integrated accelerometer [H]. Finally, the skin surface temperature [D] and ambient humidity [G] close to the device are monitored as well. One set of sensor signals measured each minute are used in the analysis.
The Multisensor (Solianis Monitoring AG, Zurich, Switzerland) is attached to the upper arm of the patient with an elasticated cloth armband and is powered with a battery pack. Figure 1 shows two devices in use and a zoom of the substrate of the Multisensor to indicate the positions of the sensors and electrodes located on the sensor substrate.
Data
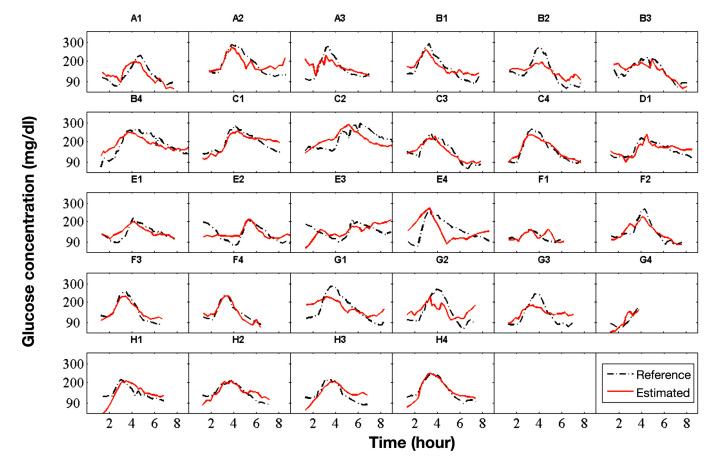
The data was acquired during an experimental clinical study that included four male patients with type 1 diabetes mellitus (age 43 ± 9 years; body mass index 26.1 ± 2.9 kg/m2, duration of diabetes 22 ± 14 years; hemoglobin A1c 7.4 ± 0.9%) and 4 male patients with type 2 diabetes mellitus (66 ± 2 years; 30.6 ± 1.8 kg/m2; 10 ± 8 years; 6.9 ± 0.3%). The study protocol was approved by the local ethical committee and the patients gave informed consent for their participation in the study. Each patient performed up to four study visits (runs). There was data from 28 study visits available for the derivation of a predictive statistical model. One study visit (visit G4, see Figure 2) contained an incomplete dataset because of a data collection problem with the device after the first 4 hours of measurement.
Figure 2.
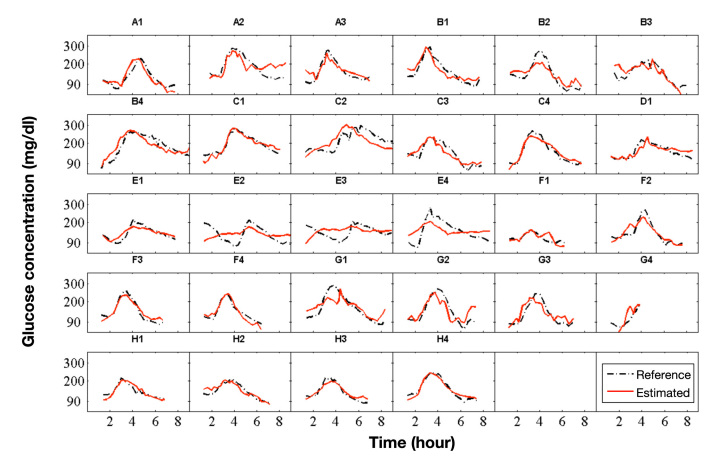
Plots with results of all runs (study visits). Time series of the invasively measured BGL (dashed line) and the estimation of the BGL (solid line) of the global model. Letters were used to identify the different patients (A, B, …) and numbers to count the runs (study visits) of patients (A1, A2, …). The time is given in hours from the start of the run.
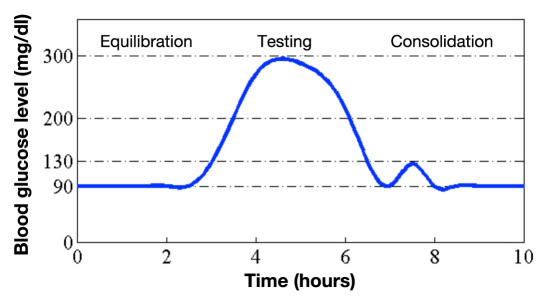
The BGL of a patient was varied during a 10-hour study visit according to a predetermined target profile including one hyperglycemic event to a target level of 300 mg/dl (Figure 3), which was induced by a standardized meal (nutrition drink with 54% carbohydrates, 32% proteins, 14% fat). Euglycemia was reestablished by subcutaneous insulin administration. Meal and insulin injections were varied from study visit to study visit in order to reach the target profile as accurately as possible. To ensure close monitoring of the BGL, it was measured from intravenous blood samples with a reference standard technique, HemoCue Glucose Analyzer (HemoCue AG, Wetzikon, Switzerland), approximately every 15 minutes and whenever necessary for medical purposes.
Figure 3.
Proposed BGL profile of a patient during a study visit (run). The approximate profile was realized with a standardized meal and subcutaneous insulin administration.
The study included several elements that stimulate perturbing effects. Ten-minute movement blocks were randomly distributed during the study visit. They included periods of cycling, walking, and regular deskwork. In addition, in every second study visit, the patients drank 3 liters of water over a 3-hour period of time in order to include potential dielectric effects from significant water intake into the model generation and data processing methods.
The measurements of the first 75 minutes after the Multisensor was attached to the skin were not taken into account for modeling and evaluation because they suffer from artifacts due to physiological adjustment of the skin to the presence of the Multisensor.
Statistical Analysis
The task of relating observed functions in spectra to a target variable belongs to the theme of functional data analysis.12 In principle, the function values—here the spectral values at many frequencies—can be used independently as potential predictors. This leads to a huge number of potential predictors. Because the spectral values at neighbouring frequencies are highly redundant, it is sensible to reduce the dimensionality while still preserving the spectral features. This can be achieved by expressing the functions (spectra) in terms of basis functions.
A simple type of basis function is determined as follows: partition the range of frequencies into a small number of intervals; then, use the averages of the functional values over the respective intervals—also called bands—as coefficients of the basis functions. This is a simple version of a kind of wavelet basis. We have used three bands—low, medium, and high—for all spectra in our study.
A more sophisticated set of basis functions consists of principal components.13 The principal component analysis (PCA) is performed on the spectral data of each electrode, separately for G and C, but for all runs of all patients together.
The final goal is to estimate the target variable Y from a large set of potential predictors x(j). Since there is no quantitative theory to be used, a regression model for calculating the estimation Ŷ needs to be developed based on the data. The natural way to develop such a model is by finding a multiple linear regression model through dimension reduction and variable selection techniques.
The principal components of the various impedance spectra were chosen as basis functions for reducing the dimensionality of the spectra. Together with the other signals from the Multisensor, they were taken as a set of potential explanatory variables for a linear regression. The BGL values of the reference method (HemoCue) were used as reference values Y.
When developing the model on the basis of the experimental dataset, it is important to avoid overfitting, which occurs when the coefficients of certain variables are overadjusted to the data and partly reflect peculiarities that are not useful for prediction in new data. Therefore, it is an important step to select a subset of the most relevant variables. We have applied one of the most popular criteria that measures the merit of any model that might be considered, namely Akaike's information criterion (AIC),14 AIC = n log(SSE/n) + 2p, where SSE is the sum of squares error of the residuals (deviations Yi -Ŷi), n is the number of observations, and p is the number of variables in the model.
An additive constant (offset) per run was added to the model. Considering practical applications for estimation, this means that a baseline adjustment will be needed in practice for a real-time application of the model. Measurements of the BGL by traditional methods will be needed for each person and repeated in a regular time pattern to calibrate the model. A model that is calibrated for all patients (having the same set of coefficients for all patients) is called a global model.
In contrast to the global model, a personalized model can have different sets of coefficients for different patients, thereby accounting for individual physiological mechanisms or properties of each patient. In practice, the use of such a model would require a training period for each patient, during which the model would be calibrated. We have taken the global model and reestimated the coefficients for each patient separately to obtain a personalized model.
Using personalized coefficients, the model becomes more flexible and can adjust better to the data on which it is estimated. However, this additional flexibility does not necessarily increase the predictive power of a model (overfitting). In order to quantify the benefit of the personalized model, we compared its outcome with the outcome of models that had reestimated coefficients for randomly chosen subsets of runs, which do not correspond to the patients. We drew eight random subsets of runs 1000 times. We ensured that these subsets had equal numbers of runs as the personal subsets and estimated the model coefficients separately for these subsets. This ensemble of 1000 models was then compared to the personalized model. With this comparison, it was possible to distinguish between the random effects of a more flexible model and the improvements achieved by personalized coefficients.
Results
Basis Functions
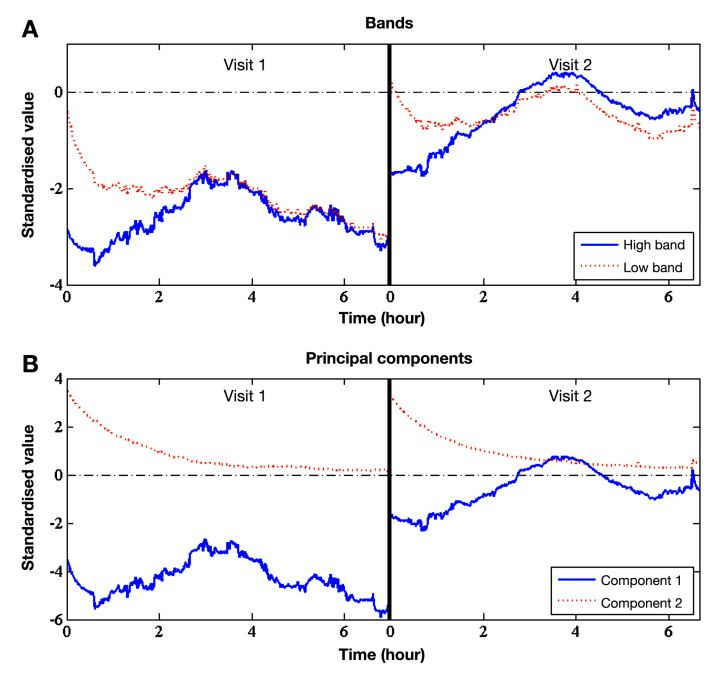
The time series of the low and high band of two representative runs (study visits) for the conductance spectrum of the long electrode can be seen in Figure 4A, and the time series of the first two principal components of the same spectral data is given in Figure 4B. By comparing the relatively simple bands to the more sophisticated principal components, it can be seen that the principal components better extract glucose-related effects from the spectrum.
Figure 4.
Time series of (A) bands and (B) principal components of the conductance of the long electrode spectrum for two representative runs (study visits). The level of principal component 1 (solid line) depends on the attachment and placement of the device. Component 1 is related to dielectric changes of the skin tissue triggered by changes in the BGL. Component 2 (dotted line) reflects sweat and skin moisturization effects.
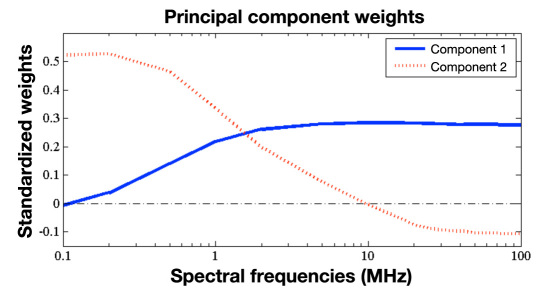
The principal components are weighted averages of the function values, and the weights can be displayed as a spectrum. Figure 5 shows the weights (loadings) obtained for the first two principal components of the long conductance in our study.
Figure 5.
Weights of the first two principal components of the conductance of the long electrode spectrum.
Linear Model
We have derived a model by selecting a subset of variables from the set of the principal components and other scalar variables with AIC variable selection. This led us to the following model:
| Yi = β0 + β1 × lC.pc1i + β2 × mG.pc2i + β3 × sGlf.pc2i + εi | |
| Yi | BGL |
| β0 | additive constant per run |
| β1, β2, β3 | coefficients to be determined |
| lC.pc1 | first principal component (PC) of the capacitance of the long electrode (high frequencies) |
| mG.pc2 | second PC of the conductance of the electrode (high frequencies) |
| sGlf.pc2 | second PC of the conductance of the electrode (low frequencies) |
| εi | disturbance term |
In fact, lC.pc1 (capacitance of the long electrode) is the main blood glucose information carrier. The numerical performance can be further improved with one variable of the middle electrode (mG.pc2) and with one variable at low frequencies (sGlf.pc2). Note that the study has been performed at a constant room temperature in the hospital (24.0 ± 1.1 °C). As a result, the skin temperature is not included in the model because no relevant temperature changes occurred.
Glucose estimations of the suggested global model (solid line) are compared with actual invasively measured BGL values of the target variable (dashed line) in Figure 2. The invasively measured BGL values have been linearly interpolated in Figure 2 for better readability.
An overall coefficient of determination (R2) of 0.60 and a root mean square error (RMSE) of 36.4 mg/dl are achieved. Further key indicators of the global model are given in Table 1. The mean absolute difference is MAD = avgi[abs(Yi – Ŷi)] and summarizes the absolute deviations of the model estimations from the reference measurements. The mean absolute relative difference is MARD = avgi[abs((Yi – Ŷi)/Yi].
Table 1.
Comparison of Key Indicators of the Global and Personalized Modelsa
| Global model | Personalized model | |
|---|---|---|
| R2 | 0.60 | 0.71 |
| MAD | 28.6 mg/dl | 24.2 mg/dl |
| MARD | 21.5% | 17.9% |
| RMSE | 36.4 mg/dl | 31.0 mg/dl |
R2, Pearson coefficient of determination; MAD, mean absolute difference; MARD, mean absolute relative difference; RMSE, root mean square error.
Personalized Model
Using personalized coefficients increases the model's performance significantly and leads to an R2 of 0.71 and a RMSE of 31.0 mg/dl. The corresponding time series can be seen in Figure 6. Table 1 shows a comparison to the global model of the most important key indicators.
Figure 6.
As in Figure 2 but for the personalized model.
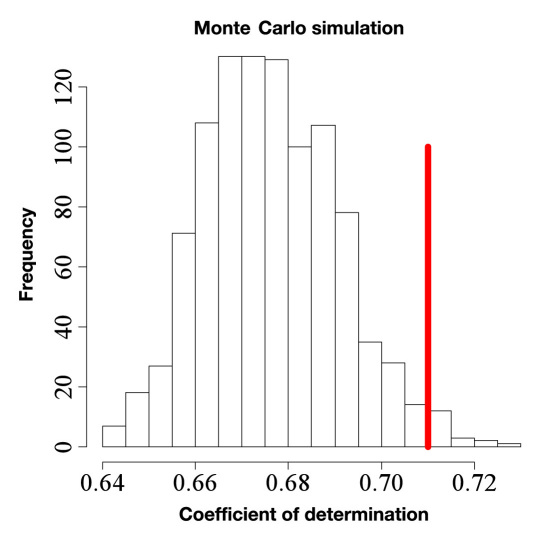
The Monte Carlo simulation15 with separate coefficients for random subsets of runs that are equivalent to the personal subsets provides a set of 1000 corresponding coefficients of determinations. These R2 values are higher than the R2 of the global model due to the increased flexibility (overfitting). However, Figure 7 shows that only 1.8% of the models obtained in the set of models with random subset of runs reached an R2 marginally higher than the personalized model (0.71).
Figure 7.
Simulated coefficients of determination (R2) of models with individual coefficients for randomly chosen subsets of runs (same sizes as the personal subsets). The vertical line shows the R2 of the personalized model (0.71). For the Monte Carlo simulated models, 1.8% have a higher R2 than the personalized model.
Discussion
Basis Functions
Glucose-relevant and perturbing effects are closely related to the first and second principal component of the conductance spectrum of the long electrode. This can be seen clearly in the time series of the same two representative runs (Figure 4B). In fact, the second principal component tends toward zero for all runs. It is related to the process of the moisturization of the SUT. Moisturization can for instance be caused by the attach-ment of the Multisensor on the skin surface and the relocation of fluids within the skin due to the well-known occlusion effect and the inhibition of transepidermal water loss from the skin.16,17
The first principal component appears to be related to the dielectric changes of the microvascularized skin layers and therefore contains glucose-relevant information. It shows different mean levels from run to run. These levels are assumed to be caused by different attachment pressure and placement of the device.
Linear Model
Only a few variables were chosen by the AIC to be relevant for blood glucose estimation. This proves that the PCA was able to concentrate the glucose-relevant effects in a few variables only. An adequate statistical agreement with the reference BGL was attained by the global model despite the perturbations introduced during the study visits. This has also been shown when different blood glucose profiles are realized.18
However, there were some episodes with larger discrep-ancies in our data. Patient E had systematically worse model glucose estimations than the other patients. A global model was not able to adequately estimate the BGL in that case.
Personalized Model
The fitting of the personalized model improves, especially at the beginning of the runs when the model needs to correct for equilibration effects. Additionally, the amplitude of the personalized fit is in better agreement with invasively measured blood glucose.
The improvements of the fit obtained for the models with random subsets of runs are clearly inferior to the improvement obtained for the personalized model. Therefore, we conclude that the predictive power of glucose estimation with the presented device can be improved with personalized coefficients in linear regression models. This is explained by the interpersonal variations in the physical structure of the patient's skin19 and metabolic sensitivity.
Conclusions
The presented data analysis is based on sensor signals from the Solianis Multisensor. The study included elements to trigger perturbations in the main glucose-related signals (e.g., cycling, walking, regular deskwork, and drinking 3 liters of water). A data processing approach and model derivation procedure was suggested and successfully tested. It proved feasible to track the effects of blood glucose variations with the presented MGMS.
Preprocessing of the impedance spectra using PCA proved to be useful for our data. For the most important spectra, it separated well the dominating effects that contributed to the spectra. Furthermore, it provided meaningful physiological signals for subsequent modeling.
It is possible to use a global model with three explanatory variables to track the effects of blood glucose variations with the MGMS. Care is needed to avoid overfitting of the model to the experimental data and to achieve predictive power. Variable selection based on AIC leads to a robust and powerful model.
We have also shown that personalized coefficients in the model not only improve the fit but also increase the predictive power of the model with the technical setting of the Multisensor used for this study.
An improved attachment method of the sensor substrate to the skin as well as filtering and outlier detection is expected to further improve the model performance. In the next phase, improved optical sensors will also be incorporated into the Multisensor, which is a noninvasive CGM that employs IS technology to track changes in BGLs, in order to better account and compensate for perturbing effects associated with changes in skin blood perfusion. It will then be established whether further improvements can be achieved to move closer toward real-time noninvasive continuous glucose monitoring under conditions closer to daily life.
Acknowledgments
The authors are grateful to the development team at Solianis Monitoring AG for the preparation of the Multisensor, the clinical team for providing the experimental data, and the research team for useful discussions.
Abbreviations
- (AIC)
Akaike's information criterion
- (BGL)
blood glucose level
- (C)
capacitance
- (EMF)
electromagnetic field
- (G)
conductance
- (IS)
impedance spectroscopy
- (LED)
light-emitting diode
- (MAD)
mean absolute difference
- (MARD)
mean absolute relative difference
- (MGMS)
multisensor glucose monitoring system
- (PCA)
principal component analysis
- (R2)
coefficient of determination
- (RMSE)
root mean square error
- (SSE)
sum of squares error
- (SUT)
skin and underlying tissue
Disclosures:
Martin Mueller, Mark S. Talary, Lisa Falco, Oscar De Feo, and Andreas Caduff are full-time employees of Solianis Monitoring AG. This work was funded by Solianis Monitoring AG.
References:
- 1.Arnold MA, Small GW. Noninvasive glucose sensing. Anal Chem. 2005;77(17):5429–5439. doi: 10.1021/ac050429e. [DOI] [PubMed] [Google Scholar]
- 2.Larin KV, Eledrisi MS, Motamedi M, Esenaliev RO. Noninvasive blood glucose monitoring with optical coherence tomography: a pilot study in human subjects. Diabetes Care. 2002;25(12):2263–2267. doi: 10.2337/diacare.25.12.2263. [DOI] [PubMed] [Google Scholar]
- 3.Pfützner A, Caduff A, Larbig M, Schrepfer T, Forst T. Impact of posture and fixation technique on impedance spectroscopy used for continuous and noninvasive glucose monitoring. Diabetes Technol Ther. 2004;6(4):435–441. doi: 10.1089/1520915041705839. [DOI] [PubMed] [Google Scholar]
- 4.Forst T, Caduff A, Talary M, Weder M, Brändle M, Kann P, Flacke F, Friedrich C, Pfützner A. Impact of environmental temperature on skin thickness and microvascular blood flow in subjects with and without diabetes. Diabetes Technol Ther. 2006;8(1):94–101. doi: 10.1089/dia.2006.8.94. [DOI] [PubMed] [Google Scholar]
- 5.Caduff A, Talary MS, Zakharov P. Cutaneous blood perfusion as a perturbing factor for noninvasive glucose monitoring. Diabetes Technol Ther. 2010;12(1):1–9. doi: 10.1089/dia.2009.0095. [DOI] [PubMed] [Google Scholar]
- 6.Caduff A, Dewarrat F, Talary M, Stalder G, Heinemann L, Feldman Y. Non-invasive glucose monitoring in patients with diabetes: a novel system based on impedance spectroscopy. Biosens Bioelectron. 2006;22(5):598–604. doi: 10.1016/j.bios.2006.01.031. [DOI] [PubMed] [Google Scholar]
- 7.Caduff A, Donath M, Talary M, Haug S, Huber D, Stahel W, Dewarrat F, Jonasson LS, Krebs H-J, Klisic J. Multisensor concept for non-invasive physiological monitoring. Instrumentation and Measurement Technology Conference Proceedings; 2007 May 1-3; Warsaw, Poland. IEEE; 2007. p. 1-4. [Google Scholar]
- 8.Caduff A, Hirt E, Feldman Y, Ali Z, Heinemann L. First human experiments with a novel non-invasive, non-optical continuous glucose monitoring system. Biosens Bioelectron. 2003;19(3):209–217. doi: 10.1016/s0956-5663(03)00196-9. [DOI] [PubMed] [Google Scholar]
- 9.Talary MS, Dewarrat F, Huber D, Caduff A. In vivo life sign application of dielectric spectroscopy and non-invasive glucose monitoring. JNCS. 2007;353(47-51):4515–4517. [Google Scholar]
- 10.Caduff A, Mueller M, Megej A, Dewarrat F, Suri R, Klisic J, et al. Characteristics of a Multisensor System for non invasive glucose monitoring with external validation and prospective evaluation. Biosens Bioelectron. doi: 10.1016/j.bios.2011.02.034. In press 2011. [DOI] [PubMed] [Google Scholar]
- 11.Foster KR, Schwan HP. Dielectric properties of tissues and biological materials: a critical review. Crit Rev Biomed Eng. 1989;17(1):25–104. [PubMed] [Google Scholar]
- 12.Ramsay JO, Silverman BW. New York: Springer; 2005. Functional data analysis. [Google Scholar]
- 13.Jolliffe IT. New York: Springer; 2002. Principal component analysis. [Google Scholar]
- 14.Hastie T, Tibshirani R, Friedman JH. Berlin: Springer; 2001. The elements of statistical learning: data mining, inference, and prediction. [Google Scholar]
- 15.Metropolis N, Ulam S. The Monte Carlo method. J Am Stat Assoc. 1949;44(247):335–341. doi: 10.1080/01621459.1949.10483310. [DOI] [PubMed] [Google Scholar]
- 16.Gioia F, Celleno L. The dynamics of transepidermal water loss (TEWL) from hydrated skin. Skin Res Technol. 2002;8(3):178–186. doi: 10.1034/j.1600-0846.2002.10342.x. [DOI] [PubMed] [Google Scholar]
- 17.Friebe K, Effendy I, Löffler H. Effects of skin occlusion in patch testing with sodium lauryl sulphate. Br J Dermatol. 2003;148(1):65–69. doi: 10.1046/j.1365-2133.2003.04851.x. [DOI] [PubMed] [Google Scholar]
- 18.Caduff A, Talary MS, Mueller M, Dewarrat F, Klisic J, Donath M, Heinemann L, Stahel WA. Non-invasive glucose monitoring in patients with type 1 diabetes: a Multisensor system combining sensors for dielectric and optical characterisation of skin. Biosens Bioelectron. 2009;24(9):2778–2784. doi: 10.1016/j.bios.2009.02.001. [DOI] [PubMed] [Google Scholar]
- 19.Zakharov P, Talary MS, Kolm I, Caduff A. Full-field optical coherence tomography for the rapid estimation of epidermal thickness: study of patients with diabetes mellitus type 1. Physiol Meas. 2010;31(2):193–205. doi: 10.1088/0967-3334/31/2/006. [DOI] [PubMed] [Google Scholar]


