

Abstract
We establish an appropriate thermodynamic framework for determining the optimal genome length in electrostatically driven viral encapsidation. Importantly, our analysis includes the electrostatic potential due to the Donnan equilibrium, which arises from the semipermeable nature of the viral capsid, i.e., permeable to small mobile ions but impermeable to charged macromolecules. Because most macromolecules in the cellular milieu are negatively charged, the Donnan potential provides an additional driving force for genome encapsidation. In contrast to previous theoretical studies, we find that the optimal genome length is the result of combined effects from the electrostatic interactions of all charged species, the excluded volume and, to a very significant degree, the Donnan potential. In particular, the Donnan potential is essential for obtaining negatively overcharged viruses. The prevalence of overcharged viruses in nature may suggest an evolutionary preference for viruses to increase the amount of genome packaged by utilizing the Donnan potential (through increases in the capsid radius), rather than high charges on the capsid, so that structural stability of the capsid is maintained.
Keywords: polyelectrolyte, viral assembly
The most prevalent viruses in nature are single-stranded RNA viruses with the genetic material enclosed in icosahedral-shaped capsids made up of 60 T protein units, where the T-number is a small integer index. The protein units (capsomers) often contain highly basic peptide arms that extend into the capsid interior and, under physiological conditions, are positively charged. Electrostatic attraction provides the driving force for encapsidating the negatively charged RNA, which, in turn, helps overcome the electrostatic repulsion among the capsomers during the capsid assembly.
In a series of classic experiments, Bancroft and coworkers (1, 2) demonstrated that certain viruses can encapsidate nonnative RNA and even generic polyanions. Dominance of the electrostatics as the driving force for viral assembly has led to the expectation of a simple relationship between the total capsid charge QP and the genome charge QR, as every nucleotide carries one unit of negative charge. Belyi and Muthukumar (3) compiled data for 19 wild type viruses from several viral families and found an apparent “universal” charge ratio of QR/QP ≈ 1.6, which they explained by combining the ground-state dominance approximation for polyelectrolyte binding to an oppositely charged polymer brush with the Manning condensation theory (4). The former predicts a 1∶1 charge ratio and the latter is used as a qualitative argument for the actual charge on the RNA being less than the nominal charge. Hu, et al. (5), however, assumed that the RNA winds around individual peptide arms and found that the viruses are most stable when the total contour length of the RNA is close to the total length of the peptide arms; this roughly gives a charge ratio of 2. In other works that ignore the peptide arms completely, there is additional disagreement for the charge ratio. For example, van der Schoot and Bruinsma (6) obtained a charge ratio of 2, whereas the work of Angelescu, et al. (7) yielded a ratio of 1 as the most favorable condition (but predicted that encapsidation can remain favorable up to a ratio of 3.5). Implicit in any expected relationship between the total capsid charge QP and the genome charge QR is the assumption that at a given QP, there exists an optimal genome length N∗ that can be encapsidated. However, the definition of N∗ has not been clearly articulated in the literature, and the issue of a “universal” charge ratio remains unresolved.
In this article, we first clarify the meaning of an optimal genome length N∗. The determination of N∗ requires a clearly defined thermodynamic setup from which minimization of an appropriate free energy can emerge in a way that is consistent with the assembly mechanism under typical in vitro or in vivo conditions. We then use self-consistent field (SCF) theory (8) to calculate the free energy required to determine N∗. We find that N∗ is not uniquely determined by the total charge of the capsid QP, but depends on the placement of the capsid charges, the excluded volume effects and, most significantly, the negative electrostatic potential outside the viral capsid. This Donnan potential (9) has been neglected in all previous theoretical and computational studies. We find that this contribution is essential for obtaining overcharged viruses.
By including the Donnan potential, we are able to vary the parameters in our model—the charge density and length of the peptide arms, and the charge density and radius of the capsid shell—to generate a set of hypothetical viruses for which the behavior of the genome length vs. the total capsid charge resembles data on real overcharged viruses from ref. 3. On the basis of our analysis, the prevalence of overcharged viruses in nature may suggest an evolutionary preference for viruses that primarily utilize the Donnan potential, rather than highly charged capsomers, to increase the amount of genome packaged, while still maintaining the structural stability of the capsid shell.
Clarification of the Optimal Genome Length
Bancroft, et al. (2) showed that viral assembly occurs by a nucleation and growth mechanism, with the RNA acting as the nucleating agent. If the RNA are sufficiently large, and on account of their electrostatic repulsion with each other, the likelihood of multiple RNA nucleating one capsid is low and, for the optimal length question, we may confine ourselves to the population of single RNA-encapsidated viral particles. Also, following previous theoretical works (3, 5–7, 10–15), we treat the RNA as a linear polyelectrolyte, and ignore the secondary structures (16). This approximation is in part a computational necessity and in part guided by the motivation to elucidate the generic features of electrostatically driven viral assembly by using simple models. It will be shown that changing the polyelectrolyte from a linear chain to a multiarmed star (which considerably reduces its physical dimension, one of the main effects of the secondary structure) has little effect on the results. As depicted in Fig. 1, we consider two scenarios for the encapsidation. Under reasonable conditions, these two scenarios yield identical results.
Fig. 1.

Two scenarios for viral assembly giving rise to an optimal genome length. Scenario I: a monodisperse solution of RNA of length N0 > N∗, where the optimal length N∗ corresponds to the largest population of viral particles containing N∗ segments inside the capsid. Here, the outside fragment of RNA can be removed by nucleases, as represented by scissors. Scenario II: a polydisperse solution of RNA, where viruses containing fully encapsidated molecules of length N∗ dominate the population of singly encapsidated viral particles.
Scenario I.
Consider a monodisperse solution of sufficiently long RNA (N0 > N∗) mixed with capsomers. Upon nucleation around the RNA, the capsomers aggregate to form viruses of various T-number sizes with N segments inside and N0 - N segments outside. It has been suggested that the outside fragments can be removed by nucleases (17, 18). We focus on the subpopulation of singly encapsidated viral particles of a particular T-number. Treating viral assembly as an equilibrium system subject to the laws of mass action (see ref. 6 and references therein), the number concentration of viral capsids containing a genome length N inside is
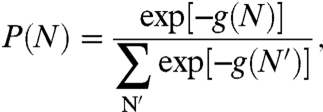
| [1] |
Here f(N) is the free energy of interaction between the RNA and the capsid, Δfcap is the free energy of formation for an empty capsid, μ and λ are the chemical potentials of the free RNA and the free capsomers, respectively, and Cref is a reference concentration that is assumed to be independent of N. f(N) and Δfcap are really semigrand free energies, as the capsid is open with respect to small salt ions and solvent. However, for notational conciseness, we do not explicitly include the chemical potentials of these species in the expression. Throughout this work, we take the thermal energy kT as the energy unit. Clearly, the fraction of viral particles with N segments inside is given by  , where the summation runs from Nmin, as required to nucleate the capsid (2), to N0. Importantly, the free energy of formation of the capsid and the concentrations of RNA and capsomers, while determining the concentration of the viral particles, play no role in P(N). If we ignore the connectivity between the inside and outside portions of the RNA, then the free energy of interaction may be separated into f(N) = fin(N) + fout(N0 - N). The main contribution to fout arises from the external osmotic pressure Π and the finite electrostatic potential difference Δψ, i.e., the Donnan potential. The former is due to the presence of other macromolecules, such as proteins and nucleic acids or added osmolytes (19), and the latter due to the fact that these macromolecules are usually charged. Thus, we have fout(N0 - N) = (N0 - N)(vRΠ + eΔψ), where vR is the monomer volume of a nucleotide and e is the elementary charge. Under usual solution conditions, vRΠ ≪ kT so that we can safely ignore the osmotic pressure term. Substituting the free energy back into P(N), we get
 |
[2] |
where g(N) = fin(N) - eNΔψ. It is now clear that the largest population corresponds to the minimum of this free energy.
Scenario II.
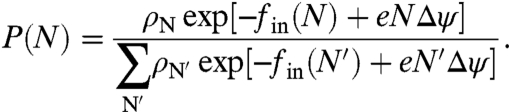
We envision a polydisperse solution of RNA mixed with capsomers. Once packaged we assume that the RNA molecules reside entirely within the viral capsid. Again, we focus on the subpopulation of singly encapsidated viral particles of a particular T-number. Following arguments similar to those in Scenario I, the fraction of viral particles with chain length N is given by  . Here μN is the chemical potential of free RNA of length N. Assuming ideal solution behavior for the free RNA,
  , where
  is a reference concentration and
  is its respective chemical potential. These reference terms contain contributions from the momentum and conformation integration of the reference Gaussian chain and exactly cancel those implicit in fin. The distribution then becomes
 |
[3] |
When the concentrations of RNA with different chain lengths are the same, the ρN exactly cancel and Eq. 3 becomes identical to Eq. 2. In fact, because the free energy in the exponential is O(N) (see Fig. 2), its contribution will dominate the distribution and the concentration prefactors can be safely ignored. Therefore, for all practical purposes, the determination of N∗ is again a minimization of the free energy, g(N).
Fig. 2.

T = 4 virus with QP = 1,847e in the presence (solid) and absence (dashed) of the Donnan potential.
We note that it is possible to include the part-in, part-out configuration of Scenario I in Scenario II. Here, chain lengths longer than N∗ will likely have some fragments outside the capsid that can be removed by nucleases. Including such a configuration will make the distribution P(N) even more dominated by N∗, but the determination of N∗ remains unchanged. Also, for long enough chains, g(N) is primarily determined by the total number of nucleotides in the capsid and is insensitive to the actual number of chains nR or the architecture of the polyelectrolyte; see Fig. 2. In particular, the results for a 12-arm star and for a linear chain with the same number of nucleotides are essentially identical, indicating that packaging is insensitive to the radius of gyration or degree of branching—two main effects of the RNA secondary structure (16). In what follows, we briefly describe the components of our SCF model used to obtain g(N), but refer the reader to the Appendix for details, including the model parameters.
Model
We approximate the icosahedral viral capsid by a spherical shell of some finite thickness with inner radius rcap, uniform charge density of magnitude ccap, and np = 60 T peptide arms grafted to the inner surface. The capsid is treated as a semipermeable shell, open with respect to solvent and ions, but closed with respect to the RNA and peptide arms. We represent the flexible RNA molecule, whose persistence length l ∼ 1 nm is an order of magnitude smaller than the capsid radius, by a discrete Gaussian chain of N monomers, each carrying a unit negative charge and having a volume vR. The capsid proteins are represented by end-grafted polyelectrolyte chains of uniform charge distribution and are similarly modeled by a discrete Gaussian chain of Np monomers, each with volume vp and charge cp. The solvent molecules are represented by monomers of volume vs and the monovalent salt ions are taken to be point charges of the elementary charge e. The essential contributions to the model are the chain connectivity, the excluded volume effects, and the electrostatic interactions from all charged species, with total charge density 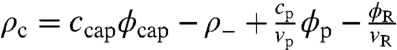 . Here ρ- is the charge density, assumed to be uniform, of the negatively charged macromolecules outside the capsid. Following the usual SCF derivation (see Appendix), we obtain the semigrand free energy:
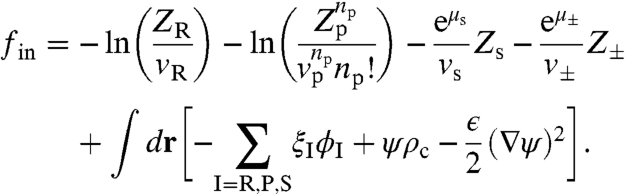 |
[4] |
In this expression, the Zα (α = R, P, S, ± ) are the single-molecule partition functions in their respective self-consistent fields ξI, ψ is the electrostatic potential (measured in reference to a monovalent salt solution when ρ- = 0), and the dielectric constant ϵ depends on the local volume fraction of the species.
Results
To understand how each of the different capsid parameters affects the optimal genome length N∗, we begin by varying one parameter at a time, holding all else fixed. For different ways of changing the capsid charges, we obtain the optimal genome charge QR = eN∗ from the free energy minimization with respect to N. In Fig. 3 we show the relationship between QR and the total capsid charge QP. In all cases, an approximately linear relationship is obtained in the range of charges considered, with a slope k = ΔQR/ΔQP.
Fig. 3.

k = ΔQR/ΔQP without the Donnan potential (filled): k1 = 0.67[NP], k2 = 0.82[cP], k3 = 0.33[ccap], k4 = 0.38[rcap]; and with the Donnan potential (empty): k5 = 0.80[NP], k6 = 0.84[cP], k7 = 0.41[ccap], k8 = 1.69[rcap]. The method of varying Qp is given in brackets; see Appendix for details.
We first examine the situation in the absence of the Donnan potential, when ρ- = 0 mM and c± = 130 mM (filled markers). Changing the charge density of the capsid shell ccap has the smallest effect (k3 = 0.33) on the optimal genome charge, while changing the charge density of the peptide arms cp has the largest effect (k2 = 0.82). Intermediate to these slopes, we find k4 = 0.38 for increasing the radius of the capsid shell rcap (at fixed grafting density) and k1 = 0.67 for increasing the length of the peptide arms Np. To understand these different dependencies, we consider a reference T = 4 capsid with a total charge QP = 1,440e distributed only on the np = 240 peptide arms. In Fig. 4A, we plot (solid line) the radial density profile for the optimal genome with QR = 769e. We observe, as expected, a region of RNA density near the capsid surface, with most of the capsid interior devoid of genome. In this case, the main contribution comes from the electrostatic interactions with the peptide arms grafted to the inner surface of the capsid. We subsequently double QP by changing Np, cp, ccap and rcap individually. From the density profiles, it is clear that increasing ccap (dashed) has a local effect and the resulting optimal genome only increases to QR = 1,171e. The region where the genome can benefit from additional electrostatic interactions is limited to a concentrated shell at the inner surface of the capsid, where additional layers are hindered by excluded volume from the genome and peptide arms. In contrast, delocalizing the charges onto the peptide arms allows the genome to interact with the entire region of the peptide brush and we find QR = 2,011e or QR = 1,802e, depending on whether we increase cp (dotted) or Np (dot-dashed), respectively. The discrepancy between the two can be understood again from the excluded volume effect. Increasing Np increases the volume fraction of the protein arms and therefore the excluded volume effect, while increasing cp does not. Finally, one could double the capsid charge by doubling the number of peptide arms at fixed grafting density, thus increasing rcap (note that this is a hypothetical case, because the number of peptide arms is restricted by the T-number). We find that the density profile is largely the same, except for a shift in position with the capsid shell. Not surprisingly, the optimal genome has approximately doubled with the number of peptide arms, where we find QR = 1,488e. In all cases considered, we find undercharged viruses, where QR/QP < 1.
Fig. 4.

Radial density profiles (nm) corresponding to the optimal genome length for a T = 4 virus. (A) For np = 240, Np = 36, cp = 0.167, and ccap = 0.0 (solid), we double the charge by changing one of the following: Np = 72 (dot-dashed), cp = 0.33 (dotted), and ccap = 0.177 (dashed). (B) For Np = 36 and cp = 0.083, we increase the capsid charge density: ccap = 0.00 (solid), 0.05 (dotted), 0.10 (dashed). (C) For ccap = 0.10 without protein arms (solid), with neutral protein arms Np = 36 (dotted), and with charged protein arms Np = 36, cp = 0.083 (dashed).
We next consider the effect of negatively charged macromolecules outside the viral capsid and set ρ- = 100 mM, c+ = 130 mM, and c- = 30 mM (20). As usual, the small ions, which can diffuse freely, maintain charge neutrality subject to equality of chemical potential for each of the small ion species across the viral capsid. This combination of charge neutrality with equality of chemical potential gives rise to a negative electrostatic potential (relative to a neutral monovalent salt solution) that makes it favorable for an RNA molecule to be inside the viral capsid. The optimal genome length occurs when the potential inside the capsid becomes comparable to this Donnan potential. In Fig. 3 (empty markers), we show that increasing rcap at constant grafting density now has the greatest effect on increasing the optimal genome length, where k8 = 1.69. In contrast, the optimal genome lengths for changing Np, cp, or ccap have primarily shifted by a constant, while the slopes ΔQR/ΔQP remain largely unchanged. These observations can be explained from the density profiles in Fig. 4B, where we note that accounting for the negative background charge fills the capsid interior with RNA. When we increase ccap, the concentrated density of RNA near the surface increases (as is the case when ρ- = 0 mM), while the density in the interior remains unchanged. We note that it is possible to increase QR simply by increasing the volume of the capsid so that even negative slopes can be obtained, e.g., by increasing rcap while decreasing QP.
Lastly, in Fig. 4C, we demonstrate the combined effects of the excluded volume, electrostatics, and Donnan potential. We start with a charged capsid shell without protein arms (solid). As expected, we find a concentrated density of RNA near the inner surface of the capsid and a lower density throughout the interior of the capsid. We next add neutral protein arms (dotted) to isolate the effect of the excluded volume, and find that the peptide arms repel the RNA from the surface of the capsid, resulting in a decrease in QR. If we add back charges to the peptide arms (dashed), we find that the favorable electrostatic interactions overcome the excluded volume effect and, as before, the delocalization of the capsid charges creates an extended region of enhanced RNA density.
From these results, it is clear that no universal relationship exists between the optimal genome length and the total capsid charge. The optimal genome length depends in a nontrivial way on the placement of charges, the peptide arm length and, importantly, the capsid radius (through the Donnan potential). In real viruses, the variation in the total capsid charge from one virus to another almost certainly occurs by a combination of these parameters. Therefore, very different genome vs. capsid charge relationships can be obtained. To illustrate, in Fig. 5A we generate three datasets designated by the green circles, blue squares, and purple triangles, corresponding, respectively, to hypothetical small, medium, and large T = 4 viruses at different values of the total capsid charge. Here the size refers to rcap = 17, 22, and 25 nm for small, medium, and large, respectively. Several interesting observations can be made. First, even at zero capsid charge, there is a finite QR that depends on the volume of the capsid available to the genome. This result is a direct consequence of the negative Donnan potential outside the capsid, which fills the interior with a nearly constant density of genome (see Fig. 4 B and C). Second, it is obvious that the same total capsid charge QP can correspond to multiple values of the optimal genome charge QR. Finally, there are multiple ways to connect these 12 data points, each defining a different genome to capsid charge relationship. In fact, there is essentially a continuum of points in the general area covered by these 12 points, corresponding to different combinations of Np, cp, ccap and rcap.
Fig. 5.

(A) QR as a function of QP for hypothetical small (green circles), medium (blue squares), and large (purple triangles) T = 4 viruses obtained from our model. For a given T-number, QP is increased by varying NP, cP and/or ccap using no particular methodology. Also shown is a set of overcharged viruses (red circles) with a slope of 1.1 and intercept 1192. (B) QR as a function of QP for a selection of WT virus obtained from (3) (red circles) and (5) (blue triangles), with a combined slope of 1.1 and intercept 1214.
Discussion
We have developed a thermodynamic framework for viral assembly and clarified the notion of the optimal genome length as the minimization of an appropriate free energy, which we obtain using SCF theory. Importantly, we have accounted for the Donnan potential due to the presence of charged macromolecules outside the viral capsid and find it to be essential for obtaining overcharged viruses. Based on the minimization of the free energy defined in our work, we find that the optimal genome length depends in a nontrivial way on the placement of the capsid charges, the excluded volume inside the capsid and, significantly, the Donnan potential. We conclude that there is no universal genome to capsid charge ratio.
What, then, can be made of the apparent linear relationship QR ≈ 1.6QP that was obtained from 19 wild type viruses in ref. 3? To address this question, we first note that if we exclude the three obvious outliers in the data used in that study, a slope of 1.3 with an intercept of 668 is obtained instead. On the other hand, another set of viruses chosen by Hu, et al. (5), when fitted to a linear function, yields a slope of 0.3 and an intercept of 3,275. If we combine both sets of data, an apparent linear relationship with slope 1.1 and intercept 1,214 is obtained (see Fig. 5B). These data therefore suggest that a fitted linear relationship between the genome and capsid charge is quite sensitive to the choice of which viruses to include in a set; this is consistent with our discussion of Fig. 5A in the last section. Whether an apparent linear relationship can be obtained if data on all available viruses are compiled remains an open question. However, it is safe to say that there is nothing particularly meaningful about 1.6 being the genome to capsid charge ratio.
Nevertheless, it can be seen from Fig. 5B that all the viruses selected in refs. 3 and 5 are overcharged. Indeed, overcharged viruses are prevalent in nature (21). To understand this observation, we have generated a set of hypothetical viruses by tuning the parameters (peptide arm length NP and charge density cP; and capsid shell radius rcap and charge density ccap) in our model so that only overcharged viruses are obtained. It is in fact possible to make the genome vs. capsid charge relationship for these hypothetical viruses appear similar to real viruses; see Fig. 5 A and B, red circles. A common attribute of these hypothetical viruses is that the charges on the peptide arms and capsid shell are relatively low. The primary driving force for packaging comes from the Donnan potential, which fills the capsid volume with genome (the finite positive offset in QR at QP = 0 for both the real viruses and our hypothetical viruses is also consistent with this). Thus, the greatest increases in QR come from increasing the capsid radius. We emphasize that without the Donnan potential, we cannot obtain overcharged viruses because the genome is limited to electrostatic interactions near the inner surface of the capsid, where the excluded volume effects become an issue. We recognize that many factors contribute in the evolutionary pressure on the genome to capsid ratio in naturally occurring viruses. However, in light of our thermodynamic analysis, the prevalence of overcharged viruses in nature suggests that there may be an evolutionary advantage for viruses that primarily use the Donnan potential, and not the electrostatic attraction between the RNA and the capsomers, for increasing the amount of genome encapsidated. The charges on the capsomers should be just enough to nucleate viral assembly (2), but not so large as to compromise the structural stability of the capsid.
In conclusion, our study offers a resolution to the issue of a universal charge ratio, highlights the importance of the negative Donnan potential in viral assembly, and provides an explanation for the prevalence of overcharged viruses in nature. The thermodynamic framework developed in this study should be useful for interpreting results from experimental studies of in vitro assembly of viruses and virus-like particles (22–26), as well as for the design of viral vectors for gene therapy, where, in addition to minimizing toxicity, a major goal is to successfully deliver the appropriate amount of therapeutic gene (27). More generally, because the presence of charged macromolecules in cells is ubiquitous, we expect the associated Donnan effects, much like the well known crowding effects (28), to significantly influence a wide range of biomacromolecular behaviors and cellular processes.
Appendix: The Model and Self-Consistent Field Theory
Consider a spherical capsid shell with uniform charge density of magnitude ccap, whose density profile we define
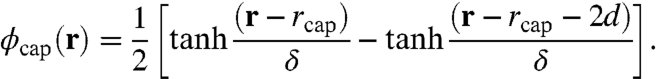 |
In this expression, rcap is the capsid radius at the inner surface, 2d is the thickness of the shell, and δ is the characteristic width of the interface. The RNA is represented by a polyanion of N identical monomers, each carrying a unit negative charge and having a volume vR = 0.22 nm3 (29). The peptide arms are represented by end-grafted polycation chains of Np monomers, each with volume vp = 0.065 nm3 (29) and charge magnitude (per monomer) cp, where cp is allowed to vary. The solvent molecules are represented by monomers of volume vs = vp and the salt ions are taken to be simply point charges of elementary charge e and valency z± = 1. Outside the capsid, we account for the negatively charged macromolecules by setting ρ- = 100 mM. As usual, the salt ions maintain charge neutrality, where c+ = 130 mM and c- = 30 mM (when ρ- = 0 mM we set c± = 130 mM).
The particle-based Hamiltonian for the model, which captures the essential contributions to viral encapsidation, is
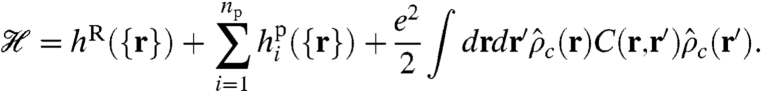 |
The first and second terms account for the chain connectivity of the RNA and peptide arms, respectively. The third term is the Coulomb energy of the system, accounting for the long ranged electrostatic interactions from the total charge density of all charged species, including the capsid shell, peptide arms, RNA, salt ions, and negatively charged macromolecules outside the capsid. C(r,r′) is the Coulomb operator satisfying -∇·[ϵ(r)∇C(r,r′)] = δ(r - r′), where ϵ(r) is the dielectric constant, which is spatially varying and depends on the volume fractions of the different species. We set ϵcap = ϵp = 12 for the capsid (30), ϵR = 2 for the RNA (31), and, as usual, ϵs = 80 for the solvent.
The semigrand canonical partition function is obtained by summing over all particle degrees of freedom, including the position of each solvent and ion molecule, as well as the position and conformation of each polyelectrolyte:
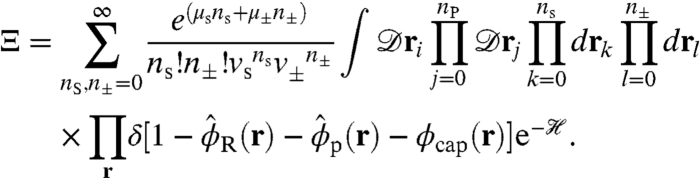 |
Here,  and
and  are the instantaneous volume fractions of the peptide arms and RNA molecule, respectively, and the delta functional accounts for the incompressibility (excluded volume) at all positions r within the system volume.
In SCF theory, the first step is to replace the above particle-based model with a field-theoretic model, using a series of techniques related to Hubbard-Stratonovich transformations (8), which decouples the interactions among particles and replaces them with interactions between single particles and effective fields. The final result for the field-theoretic partition function can be generically written in the form Ξ = ∫Dω exp(-F[ω]), where F is an effective Hamiltonian that is complex and depends on the (multidimensional) field variable ω. In general, the field-theoretic partition function cannot be evaluated in closed form. The mean-field, or self-consistent field approximation, amounts to assuming that a single field configuration ω∗ dominates the functional integral, i.e., Ξ ≈ exp(-F[ω∗]), where F[ω∗] in our model is given by Eq. 4. Here, the partition functions are for a single particle in its respective field and are given by  for the ions, Zs(ξs) = ∫dr exp{-vsξs} for the solvent, and ZI(ξI) = ∫drqI(r; NI), where I = R,P, for the RNA and protein arms. Z±(ψ) contains the Born self-energy of the ions
  , where ϵ is the spatially varying dielectric constant. This term cannot be absorbed into a redefinition of the chemical potential for a spatially varying dielectric medium (32). Although the volume of the salt ions does not enter into the incompressibility, with respect to the self-energy of an ion, we specify a± = 0.18 nm as the radius. We have introduced the chain propagator qI(r; i), where i is the monomer index, to obtain the single-chain statistics of the polyelectrolytes. The propagator accounts for the chain connectivity and the Boltzmann weight due to the self-consistent potential field, with the initial conditions that qR(r; 1) = exp[-vRξR(r)] and qp(r; 1) = exp[-vpξp(r)]δ(r - rcap). Here the delta function accounts for the fact that the initial monomer of the peptide arm must be grafted to the inner surface of the capsid shell at r = rcap. Because of the lack of inversion symmetry of the peptide arm, it is necessary to introduce a complimentary chain propagator
  that propagates from the free end of the protein arm with the initial condition
  .
.
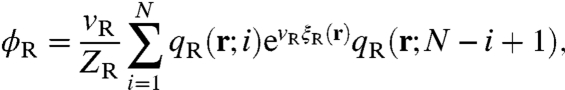
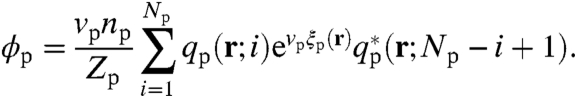
The self-consistent field equations are obtained by requiring that Eq. 4 is stationary with respect to variations in the fields. Variation with respect to the volume fraction fields ϕI gives,
 |
[5] |
 |
[6] |
Here,  is the ion distribution. Variation with respect to ψ gives,
 |
[7] |
with respect to ξs gives,
| [8] |
and with respect to ξR and ξp gives,
 |
[9] |
 |
[10] |
To correct for overcounting the monomer when the propagators are joined, we include an extra exponential factor in the expressions for ϕR and ϕp. Numerical SCF theory requires solving the set of equations [5–10], together with the chain propagators, iteratively until convergence. From these solutions, the free energy is obtained from Eq. 4.
Finally, additional parameters used in Fig. 3 are given in Table 1.
Table 1.
Additional parameters used for Fig. 3
| Variable parameter | Fixed parameters | |
| k1 | Np = 12, 24, 36 | cp, rcap, ccap = 1/3, 17, 0.10 |
| k2 | cp = 1/6, 1/3, 1/2 | Np, rcap, ccap = 12, 17, 0.10 |
| k3 | ccap = 0.05, 0.10, 0.20 | Np, cp, rcap = 12, 1/6, 17 |
| k4 | rcap = 10, 12.8, 17 | Np, cp, ccap = 24, 1/6, 0.10 |
| k5 | Np = 12, 20, 24 | cp, rcap, ccap = 1/6, 17, 0.10 |
| k6 | cp = 1/12, 1/6, 1/4 | Np, rcap, ccap = 12, 20, 0.05 |
| k7 | ccap = 0.05, 0.10, 0.20 | Np, cp, rcap = 12, 1/6, 12.8 |
| k8 | rcap = 12.8, 17, 20 | Np, cp, ccap = 12, 1/6, 0.10 |
Acknowledgments.
Z.-G.W. and C.L.T. acknowledge support from the Jacobs Institute for Molecular Engineering for Medicine at Caltech. C.L.T. is thankful for financial support from an National Institute of Health (NIH) training grant.
Footnotes
The authors declare no conflict of interest.
*This Direct Submission article had a prearranged editor.
References
- 1.Hiebert E, Bancroft JB, Bracker CE. Assembly in vitro of some small spherical viruses, hybrid viruses, and other nucleoproteins. Virology. 1968;34:492–508. doi: 10.1016/0042-6822(68)90069-x. [DOI] [PubMed] [Google Scholar]
- 2.Bancroft JB, Hiebert E, Bracker CE. Effects of various polyanions on shell formation of some spherical viruses. Virology. 1969;39:924–930. doi: 10.1016/0042-6822(69)90029-4. [DOI] [PubMed] [Google Scholar]
- 3.Belyi VA, Muthukumar M. Electrostatic origin of the genome packing in viruses. Proc Natl Acad Sci USA. 2006;103:17174–17178. doi: 10.1073/pnas.0608311103. [DOI] [PMC free article] [PubMed] [Google Scholar]
- 4.Manning GS. Limiting laws and counterion condensation in polyelectrolyte solutions I. Colligative properties. J Chem Phys. 1969;51:924–933. [Google Scholar]
- 5.Hu T, Zhang R, Shklovskii BI. Electrostatic theory of viral self-assembly. Physica A. 2008;387:3059–3064. [Google Scholar]
- 6.van der Schoot P, Bruinsma R. Electrostatics and the assembly of an RNA virus. Phys Rev E. 2005;71:061928. doi: 10.1103/PhysRevE.71.061928. [DOI] [PubMed] [Google Scholar]
- 7.Angelescu DG, Bruinsma R, Linse P. Monte Carlo simulations of polyelectrolytes inside viral capsids. Phys Rev E. 2006;73:041921. doi: 10.1103/PhysRevE.73.041921. [DOI] [PubMed] [Google Scholar]
- 8.Fredrickson GH. The equilibrium theory of inhomogeneous polymers. Oxford: Oxford University Press; 2006. [Google Scholar]
- 9.Kurbel S. Are extracellular osmolality and sodium concentration determined by Donnan effects of intracellular protein charges and of pumped sodium? J Theor Biol. 2008;252:769–772. doi: 10.1016/j.jtbi.2008.02.022. [DOI] [PubMed] [Google Scholar]
- 10.Angelescu DG, Linse P. Monte Carlo simulations of flexible polyelectrolytes inside viral capsids with dodecahedral charge distribution. Phys Rev E. 2007;75:051905. doi: 10.1103/PhysRevE.75.051905. [DOI] [PubMed] [Google Scholar]
- 11.Siber A, Podgornik R. Nonspecific interactions in spontaneous assembly of empty versus functional single-stranded RNA viruses. Phys Rev E. 2008;78:051915. doi: 10.1103/PhysRevE.78.051915. [DOI] [PubMed] [Google Scholar]
- 12.Zandi R, van der Schoot P. Size regulation of ss-RNA viruses. Biophys J. 2009;96:9–20. doi: 10.1529/biophysj.108.137489. [DOI] [PMC free article] [PubMed] [Google Scholar]
- 13.Forrey C, Muthukumar M. Electrostatics of capsid-induced viral RNA organization. J Chem Phys. 2009;131:105101. [Google Scholar]
- 14.Elrad OM, Hagen MF. Encapsulation of a polymer by an icosahedral virus. Phys Biol. 2010;7:045003. doi: 10.1088/1478-3975/7/4/045003. [DOI] [PMC free article] [PubMed] [Google Scholar]
- 15.Kivenson A, Hagen MF. Mechanisms of capsid assembly around a polymer. Biophys J. 2010;99:619–628. doi: 10.1016/j.bpj.2010.04.035. [DOI] [PMC free article] [PubMed] [Google Scholar]
- 16.Yoffe AM, et al. Predicting the sizes of large RNA molecules. Proc Natl Acad Sci USA. 2008;105:16153–16158. doi: 10.1073/pnas.0808089105. [DOI] [PMC free article] [PubMed] [Google Scholar]
- 17.Ostrow KM, Loeb DD. Underrepresentation of the 3′ region of the capsid pregenomic RNA of duck hepatitis B virus. J Virol. 2004;78:2179–2186. doi: 10.1128/JVI.78.5.2179-2186.2004. [DOI] [PMC free article] [PubMed] [Google Scholar]
- 18.Le Pogam S, Chua PK, Newman M, Shih C. Exposure of RNA templates and encapsidation of spliced viral RNA are influenced by the arginine-rich domain of human hepatitis B virus core antigen (HBcAg 165173) J Virol. 2004;79:1871–1877. doi: 10.1128/JVI.79.3.1871-1887.2005. [DOI] [PMC free article] [PubMed] [Google Scholar]
- 19.Evilevitch A, Castelnovo M, Knobler CM, Gelbart WM. Measuring the force ejecting DNA from phage. J Phys Chem B. 2004;108:6838–6843. [Google Scholar]
- 20.Alberts B, et al. Molecular Biology of the Cell. New York and Abingdon: Garland Science; 2007. [Google Scholar]
- 21.Ackermann HW, Dobow MS. Viruses of Prokaryotes. Boca Raton: CRC Press; 1987. [Google Scholar]
- 22.Hu Y, Zandi R, Anavitarte A, Knobler CM, Gelbart WM. Packaging of a polymer by a viral capsid: the interplay between polymer length and capsid size. Biophys J. 2008;94:1428–1436. doi: 10.1529/biophysj.107.117473. [DOI] [PMC free article] [PubMed] [Google Scholar]
- 23.Mukherjee S, Thorsteinsson MV, Johnston LB, DePhillips PA, Zlotnick A. A quantitative description of in vitro assembly of human papillomavirus 16 virus-like particles. J Mol Biol. 2008;381:229–237. doi: 10.1016/j.jmb.2008.05.079. [DOI] [PubMed] [Google Scholar]
- 24.Abedin MJ, Liepold L, Suci P, Young M, Douglas T. Synthesis of a cross-linked branched polymer network in the interior of a protein cage. J Am Chem Soc. 2009;131:4346–4354. doi: 10.1021/ja8079862. [DOI] [PMC free article] [PubMed] [Google Scholar]
- 25.Porterfield JZ, et al. Full-length hepatitis B virus core protein packages viral and heterologous RNA with similarly high levels of cooperativity. J Virol. 2010;84:7174–7184. doi: 10.1128/JVI.00586-10. [DOI] [PMC free article] [PubMed] [Google Scholar]
- 26.Cadena-Nava RD, et al. Exploiting fluorescent polymers to probe the self-assembly of virus-like particles. J Phys Chem B. 2011;115:2386–2391. doi: 10.1021/jp1094118. [DOI] [PubMed] [Google Scholar]
- 27.Kay MA, Glorioso JC, Naldini L. Viral vectors for gene therapy: the art of turning infectious agents into vehicles of therapeutics. Nat Med. 2001;7:33–40. doi: 10.1038/83324. [DOI] [PubMed] [Google Scholar]
- 28.Zimmerman SB, Minton AP. Macromolecular crowding: biochemical, biophysical, and physiological consequences. Annu Rev Biophys Biomol Struct. 1993;22:27–65. doi: 10.1146/annurev.bb.22.060193.000331. [DOI] [PubMed] [Google Scholar]
- 29.Jiang T, Wang ZG, Wu JZ. Electrostatic regulation of genome packaging inhuman Hepatitis B Virus. Biophys J. 2009;96:3065–3073. doi: 10.1016/j.bpj.2009.01.009. [DOI] [PMC free article] [PubMed] [Google Scholar]
- 30.Tan ZJ, Chen SJ. Nucleic acid helix stability: effects of salt concentration, cation valence and size, and chain length. Biophys J. 2006;90:1175–1190. doi: 10.1529/biophysj.105.070904. [DOI] [PMC free article] [PubMed] [Google Scholar]
- 31.Dwyer JJ, et al. High apparent dielectric constants in the interior of a protein reflect water penetration. Biophys J. 2000;79:1610–1620. doi: 10.1016/S0006-3495(00)76411-3. [DOI] [PMC free article] [PubMed] [Google Scholar]
- 32.Wang ZG. Fluctuation in electrolyte solutions: the self energy. Phys Rev E. 2010;81:021501. doi: 10.1103/PhysRevE.81.021501. [DOI] [PubMed] [Google Scholar]