Abstract
Microsomal prostaglandin E synthase-1 (mPGES-1) is a key enzyme that couples with cyclooxygenase-2 (COX-2) for the production of PGE2. Although COX-2 is known to mediate the growth and progression of several human cancers including hepatocellular carcinoma (HCC), the role of mPGES-1 in hepatocarcinogenesis is not well established. This study provides novel evidence for a key role of mPGES-1 in HCC growth and progression. Forced overexpression of mPGES-1 in two HCC cell lines (Hep3B and Huh7) increased tumor cell growth, clonogenic formation, migration and invasion, whereas knockdown of mPGES-1 inhibited these parameters, in vitro. In a SCID mouse tumor xenograft model, mPGES-1 overexpressed cells formed palpable tumors at earlier time points and developed larger tumors when compared to the control (p<0.01); in contrast, mPGES-1 knockdown delayed tumor development and reduced tumor size (p<0.01). Mechanistically, mPGES-1-induced HCC cell proliferation, invasion and migration involve PGE2 production and activation of early growth response 1 (EGR1) and β-catenin. Specifically, mPGES-1-derived PGE2 induces the formation of EGR1-β-catenin complex, which interacts with TCF4/LEF1 transcription factors and activates the expression of β-catenin downstream genes. Our findings depict a novel crosstalk between mPGES-1/PGE2 and EGR1/β-catenin signaling that is critical for hepatocarcinogenesis.
Keywords: Microsomal prostaglandin E synthase-1 (mPGES-1), β-catenin, early growth response 1 (EGR1), hepatocellular carcinoma (HCC), liver
INTRODUCTION
Hepatocellular carcinoma (HCC) is a primary malignancy of the liver with high mortality and its incidence is rising across the globe(El-Serag and Mason 1999, El-Serag 2004, Farazi and DePinho 2006, Llovet and Bruix 2008). The tumor often develops in the background liver with chronic hepatitis and cirrhosis. Consistent with the strong association between chronic inflammation and hepatocarcinogenesis, studies have shown that mediators of inflammation, such as prostaglandins (PGs), play an important role in hepatocarcinogenesis (Wu 2006). Increased cyclooxygenase-2 (COX-2) expression has been found in human and animal HCCs and in dysplastic hepatocytes (Bae et al 2001, Cheng et al 2004, Koga et al 1999, Kondo et al 1999, Leng et al 2003, Rahman et al 2001, Shiota et al 1999). In cultured human HCC cells, forced overexpression of COX-2 increases tumor cell growth and invasiveness(Han et al 2006, Leng et al 2003). The cyclooxygenase inhibitors, nonsteroidal anti-inflammatory drugs (NSAIDs), inhibit the proliferation and induce apoptosis in cultured HCC cells and in animal models of hepatocarcinogenesis (Wu 2006), although these inhibitors are known to mediate effects through both COX-dependent and -independent mechanisms. These findings provide important preclinical evidence for targeting COX-2 to prevent human hepatic carcinogenesis. However, in light of the increased cardiovascular side effect associated with some COX-2 inhibitors (Baron et al 2006, Couzin 2004, Grosser et al 2006, Vanchieri 2004), it is imperative to identify specific molecular targets downstream of COX-2 for effective and safer anti-tumor therapy.
The synthesis of prostaglandins in human cells is controlled by several key enzymes including cyclooxygenases that convert arachidonic acid to PGH2 (Kang et al 2007, Smith et al 2000, Smith and Langenbach 2001) and prostaglandin E synthase that coverts PGH2 to PGE2 (Murakami et al 2000, Samuelsson et al 2007, Stichtenoth DO 2001, Thoren et al 2003). Similar to COX-2, mPGES-1 is an inducible enzyme that is upregulated during inflammatory conditions and catalyzes the synthesis of PGE2 under basal as well as inflammatory conditions (Murakami et al 2000, Samuelsson et al 2007, Stichtenoth DO 2001, Thoren et al 2003). Elevated expression of mPGES-1 has also been found in several human cancers including HCC (Takii Y 2007). Consistent with the documented role of mPGES-1 for PGE2 synthesis, mPGES-1 knockdown has been shown to inhibit PGE2 production and reduce tumor cell proliferation and/or invasiveness in several tumor cell types including the Lewis lung carcinoma (LLC) cells (Kamei et al 2010), human prostate cancer cell line DU145 and non-small cell lung cancer cell line A549 (Hanaka et al 2009). However, in contrast to the established role of COX-2 in the development and progression of human cancers, the role of mPGES-1 in hepatocellular carcinoma has not been investigated. Given the functional coupling between COX-2 and mPGES-1 for PGE2 synthesis (Murakami et al 2000, Murakami and Kudo 2006), we postulated that mPGES-1 may represent a potential effective COX-2 downstream target for the chemoprevention and treatment of hepatic cancers. An important advantage of targeting mPGES-1 is to achieve effective anti-tumor therapy without COX-2-inhibitor associated cardiovascular side effect.
Besides prostaglandin signaling, Wnt/β-catenin activation has also been implicated in various stages of hepatic tumorigenesis(Branda and Wands 2006, Giles et al 2003, Merle et al 2004, Monga 2006, Satoh et al 2000, Thompson and Monga 2007, Zucman-Rossi et al 2006). β-catenin functions as a transcription co-factor of the T-cell factor/lymphoid enhancer factor (TCF/LEF) family and leads to the activation of Wnt target genes such as c-myc, cyclin D1 and Akt(Clevers 2006, Dihlmann et al 2005, Gordon and Nusse 2006, Hoppler and Kavanagh 2007, Moon et al 2004, Tetsu and McCormick 1999). In the absence of Wnt ligands, cytoplasmic β-catenin associates in a complex with glycogen synthase kinase-3β (GSK-3β), Axin and APC, where β-catenin is phosphorylated and targeted for proteosomal degradation. Activation of Wnt signaling causes dissociation of the β-catenin degradation complex, leading to β-catenin accumulation in the nucleus, where it binds TCF/LEF that induce transcription of important downstream target genes implicated in cell proliferation, differentiation, and apoptosis (Clevers 2006, Gordon and Nusse 2006, Hoppler and Kavanagh 2007, Moon et al 2004).
This study was designed to investigate the biological function and molecular mechanism of mPGES-1 in hepatocellular carcinoma cells. Our data provide novel evidence for a key role of mPGES-1 in human HCC cell growth and progression. We show herein that mPGES-1 enhances HCC cell growth through PGE2-mediated activation of EGR1 and β-catenin signaling pathway. Overexpression of mPGES-1 or treatment with PGE2 induces the formation of EGR1-β-catenin complex, which interacts with TCF4/LEF1 transcription factors and activates the expression of β-catenin downstream genes. Our findings in this study disclose a novel mPGES1/PGE2-induced activation of EGR1/β-catenin signaling cascade that is crucial for hepatocarcinogenesis.
RESULTS
mPGES-1 enhances HCC growth parameters, in vitro
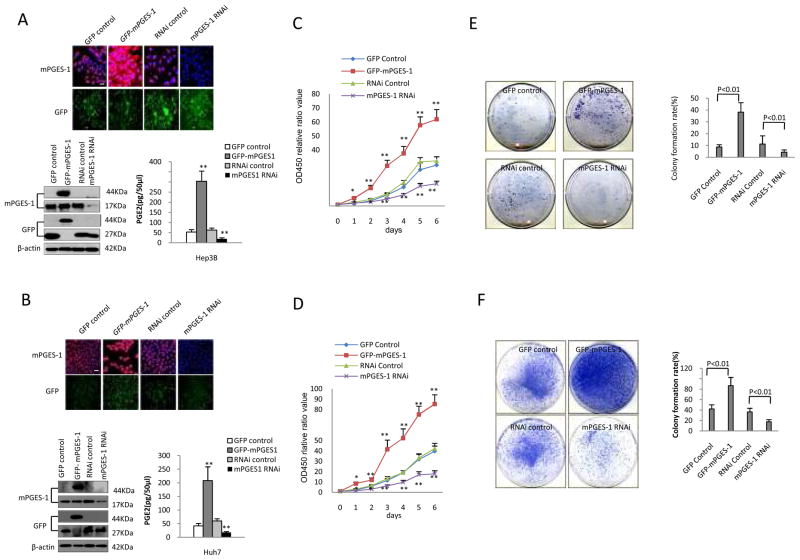
To determine the effect of mPGES-1 on hepatocellular carcinoma cell growth, we constructed human HCC cell lines (Hep3B and Huh7) with forced overexpression or depletion of mPGES-1. Hep3B and Huh7 cells were transfected with mPGES-1 expression vector (pCMV6-AV-GFP-mPGES-1), GFP control vector (pCMV6-AC-GFP), mPGES-1 RNAi vector (pGFP-V-RS-mPGES-1), or RNAi control vector (pGFP-V-RS), respectively. Successful alterations of mPGES-1 expression in these stably transfected cells were confirmed by both immunofluorescence and Western blotting analyses. As highlighted by immunofluorescence (Fig 1A & B), the level of GFP-mPGES-1 was increased in cells transfected with the GFP-mPGES-1 expression vector but decreased in cells transfected with the mPGES-1 RNAi vector. Western blotting analysis showed increased mPGES-1-GFP fusion protein (44KD) in mPGES-1 overexpressed cells, and decreased mPGES-1 protein (17KD) in mPGES-1 knockdown cells. The synthesis of PGE2 was significantly increased in mPGES-1 overexpressed cells, but decreased in mPGES-1 knockdown cells. The levels of COX-2, cPGES, mPGE-2 were not significantly altered in cells with mPGES-1 overexpression or knockdown (Supplementary Fig S1). Overexpression of mPGES-1 significantly increased the growth of Hep3B and Huh7 cells when compared to the GFP control cells; in contrast, RNAi knockdown of mPGES-1 significantly inhibited tumor cell growth (Fig 1C & D).
Figure 1. mPGES-1 promotes human HCC cell growth, in vitro.
A & B. Immunofluorescence staining and Western blotting for mPGES-1 in Hep3B (A) and Huh7 (B) cells stably transfected with four different vectors: GFP control (pCMV6-AC-GFP); GFP-mPGES-1 overexpression (pCMV6-AV-GFP-mPGES-1); RNAi control (pGFP-V-RS); and mPGES-1 RNAi (pGFP-V-RS-mPGES-1 RNAi). Upper panels: Immunofluorescence staining of mPGES-1 in four stable cell lines (TRITC staining with DAPI counterstaining) and the corresponding GFP fluorescence (original magnification ×100; scale bars 10μm). Lower Left: Western blotting of mPGES-1 in four stable cell lines. The level of mPGES-1 is increased in mPGES-1 overexpressed cell line (44KD, GFP-mPGES-1 fusion protein) and decreased in mPGES-1 RNAi cell line (17KD). β-actin was used as the loading control. Lower Right: The synthesis of PGE2 in cells stably transfected with the mPGES-1 overexpression vector or RNAi vector. Cell culture supernatants were collected to measure PGE2 level by using the PGE2 enzyme immunoassay system (GE Healthcare). The data are presented as mean ± SEM (** p<0.01 compared to the corresponding vector control cells).
C & D. Cell proliferation assay (WST-1) in HCC cells with altered mPGES-1 expression. Hep3B (C) and Huh7 (D) cells were synchronized in G0 phase by serum deprivation and then released from growth arrest by re-exposure to complete medium containing 10% fetal bovine serum. The cell proliferation and viability were determined by the WST-1 assay in 96-well plates. Each sample was assayed in triplicates for 6 consecutive days. Cell growth curve was determined on the relative values of OD450 and each point represents the mean ± SEM from three independent experiments (* p<0.05; ** p<0.01).
E-F. Colony formation assays in cell culture plates (E - Hep3B; F - Huh7). Representative photographs of colony formation from different stable cell lines are shown at the left panels. The colony formation rate (%) is shown in the right panels (calculated by dividing the colony numbers by 1 × 10³ plated cells). The data (mean ± SEM) were obtained from three independent experiments.
We next performed colony-formation assays in Hep3B and Huh7 cells with altered mPGES-1 expression. As shown in Fig 1E & F, mPGES-1 overexpressed cells showed significantly higher colony formation under the culture plate assay, whereas mPGES-1 knockdown cells exhibited lower colony-formation efficiency. In Hep3B cells, mPGES-1 overexpression resulted in 38.25±8.4% colony formation, whereas mPGES-1 knockdown led to 4.27±1.1% (p<0.01). In Huh7 cells, mPGES-1 overexpression resulted in 86.68±16.98% colony formation, whereas mPGES-1 knockdown led to 17.64±4.47% colony formation (p<0.01). Similar findings were also observed under the soft-agar assay (Supplementary Fig S2). Thus, mPGES-1 signaling enhances colony-formation capacity in HCC cells.
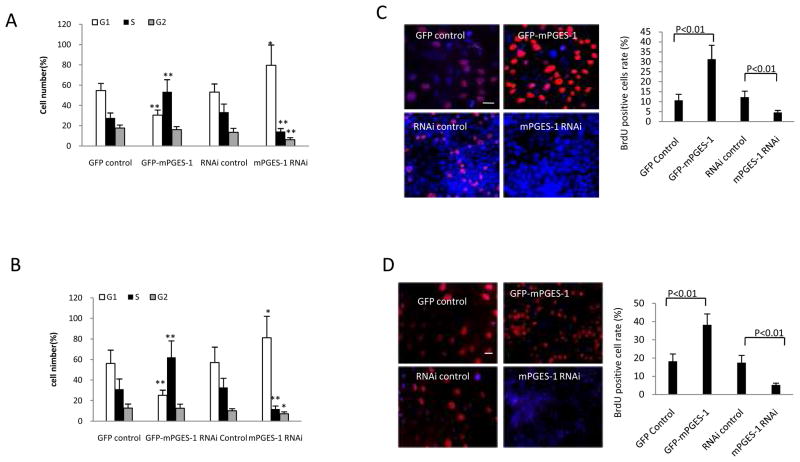
Flowcytometry was next performed to examine the impact of mPGES-1 on cell cycle progression. In Hep3B cells, when mPGES-1 was overexpressed, 52.4% cells entered into S phase with 30.5% of cells staying at G1 phase; in contrast, when mPGES-1 was knocked down, 14.2 % cells entered into S phase with 79.6% cells remaining at G1 phase (Fig 2A and Supplementary Fig S3A). In Huh7 cells, when mPGES-1 was overexpressed, 62.2% cells entered into S phase with 25.2% of cells staying at G1 phase; when mPGES-1 was knocked down, 11.8 % cells entered into S phase with 81.1% cells remaining at G1 phase (Fig 2B and Supplementary Fig S3B). These data suggest that mPGES-1 signaling promotes cell cycle progression at G1/S transit. Accordingly, BrdU labeling experiments showed higher BrdU positive Hep3B and Huh7 cells when mPGES-1 was overexpressed and lower BrdU positive cells when mPGES-1 was knocked down (Fig 2C&D); these findings indicate that mPGES-1 signaling regulates DNA synthesis in human HCC cells.
Figure 2. The effect of mPGES-1 on cell cycle progression, BrdU labeling, cell invasion and injury repair.
A & B. Cell cycle analysis by flow cytometry in Hep3B (A) and Huh7 (B) cells with altered expression of mPGES-1. The percentage of cells in S, G0/G1, and G2/M phases of the cell cycle was determined using the standard cell cycle analysis software. All experiments were conducted in triplicate, and the results were evaluated blindly. Data are presented as mean ± SEM (*p<0.05; **p<0.01).
C & D. BrdU immunofluorescence staining in Hep3B (C) and Huh7 (D) cells with altered expression of mPGES-1. Representative photographs of BrdU positive cells from different groups are shown at the left panels (scale bars 10 μm). Quantitative analysis of BrdU positive cells are shown at the right panels. The frequency of BrdU positive cells was determined by counting the positive stained cells and the total number of cells in randomly selected magnification fields. The BrdU positive cell rate (%) was calculated by dividing the numbers of BrdU positive cells by the total numbers of cells. The data are presented as mean ± SEM (** p<0.01).
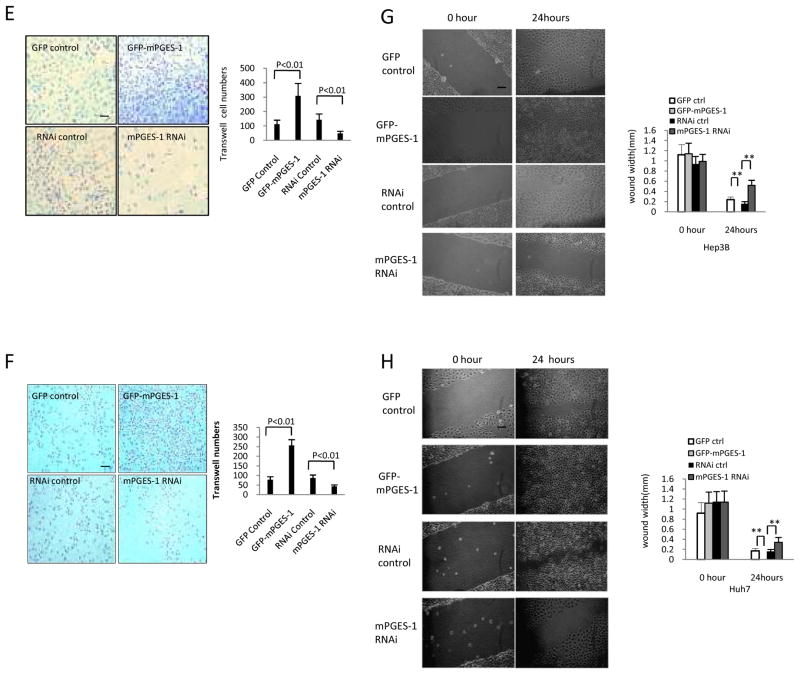
E & F. Transwell assay (E - Hep3B cells; F - Huh7 cells). Representative photographs of invaded cells from independent groups are shown at the left panels (scale bar 10 μm). Quantitative analysis of invaded cells is shown at the right panels. The data are presented as mean ± SEM from three different experiments.
G & H. Wound healing assay (G - Hep3B cells; H - Huh7 cells). Representative photographs of cell migration/injury repair from different cell lines are shown at the left panels (0 and 24 hours after scratch) (scale bar 10μm). The average wound width is shown at the right panels; the data are presented as Mean ± SEM (** p<0.01).
We performed further experiments to determine whether mPGES-1 expression might influence cell invasion, migration, and injury repair ability. Under transwell assay, the invasive cells were significantly higher in mPGES-1 overexpressed cells compared to vector control cells (309.1±87.2 versus 112.4±28.1 for Hep3B cells; 256.9 ±31.4 versus 78.3±15.1 for Huh7 cells) and lower in mPGES-1 knockdown cells (48.2±15.9 versus 143.2±41.3 for Hep3B cells; 43.3±8.2 versus 86.7±16.9 for Huh7 cells) (Fig 2E&F). Under wound healing assay, the average wound width (mm) were significantly lower in mPGES-1 overexpression group but higher in mPGES-1 RNAi group (Fig 2G&H). These findings suggest that mPGES-1 enhances cell invasion, migration and injury repair ability in human HCC cells.
mPGES-1 enhances hepatocarcinogenesis, in vivo
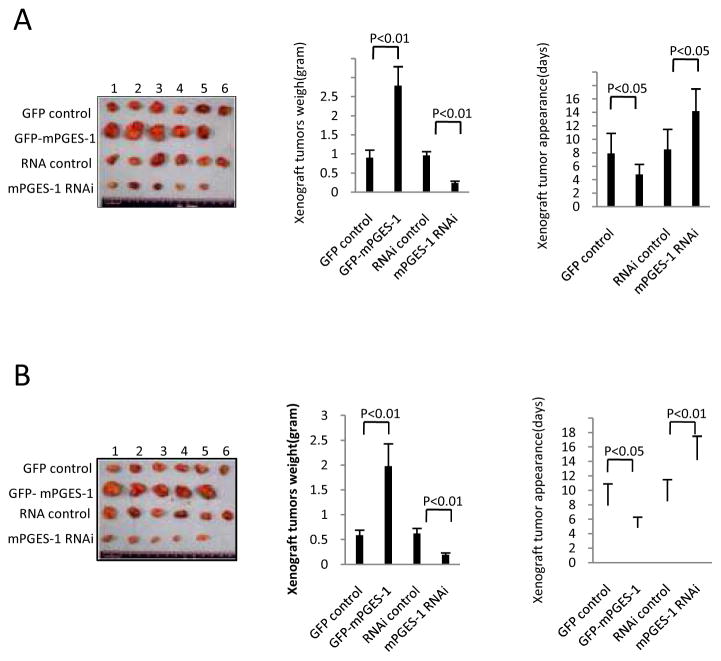
To investigate the effect of mPGES-1 on hepatocarcinogenesis in vivo, the Hep3B and Huh7 stable cell lines with altered expression of mPGES-1 were injected subcutaneously into SCID (severe combined immunodeficiency) mice. As shown in Fig 3, when mPGES-1 was overexpressed, the tumor weight increased approximately three folds when compared to the corresponding control group (2.788±0.498 grams versus 0.902±0.214 grams for Hep3B tumors; 1.979±0.451g versus 0.589±0.114 grams for Huh7 tumors). On the other hand, when mPGES-1 was knocked down, the average tumor weight decreased to approximately 1/4 to 1/3 of the control weight (0.239±0.059 grams versus 0.965±0.147 grams for Hep3B tumors; 0.193±0.048 grams versus 0.625±0.132 grams for Huh7 tumors). mPGES-1 overexpression resulted in early tumor formation compared to the control group (4.81 ±1.56 days versus 7.92±2.87 days for Hep3B tumors; 5.11±1.24 days versus 10.23±2.98 days for Huh7 tumors) (p<0.01). In contrast, the time of tumor appearance was prolonged in the mPGES-1 RNAi group compared to the control group (14.21±3.13 days versus 8.54±3.46 days for Hep3B tumors; 16.12±4.07days versus 9.64±3.11days for Huh7 tumors) (p<0.01). As shown in Supplementary Fig S4, the proliferation index (calculated as percentage of PCNA [proliferating cell nuclear antigen]-positive cells) was significantly higher in mPGES-1 overexpressed tumors compared to the vector control (94.12±23.79% versus 25.93±5.12 for Hep3B tumors; 82.42±15.22% versus 33.53±10.78 for Huh7 tumors) (p<0.01). Conversely, the percentage of PCNA positive cells was significantly lower in mPGES-1 knockdown tumors (12.71±2.03% versus 31.35±4.21% for Hep3B tumors; 10.6±2.98% versus 29.15±7.36 for Huh7 tumors) (p<0.01). These findings demonstrate that mPGES-1 enhances HCC progression in vivo.
Figure 3. mPGES-1 promotes HCC growth in SCID mice.
Hep3B and Huh7 cells stably transfected with mPGES-1 expression or siRNA vectors were injected subcutaneously at armpit of SCID mice (100 μl cell suspension at a concentration of 1 × 10⁸ cells per ml in PBS). The mice were monitored for tumor formation (5 or 6 mice for each group) and the tumors were recovered 4 weeks after inoculation (A - Hep3B tumor; B - Huh7 tumor). The wet weight of each tumor and tumor appearance time (days) were determined for each mouse. The photographs of the transplanted tumors are shown at the left panels. The average weight of the xenograft tumors are shown at the mid panels (the data represent mean ± SEM, n = 5–6). The average onset time (days) of the xenograft tumors (days) are shown at the right panels (the data represent mean ± SEM, n = 5–6).
mPGES-1 induces β-catenin and EGR1 accumulation in HCC cells
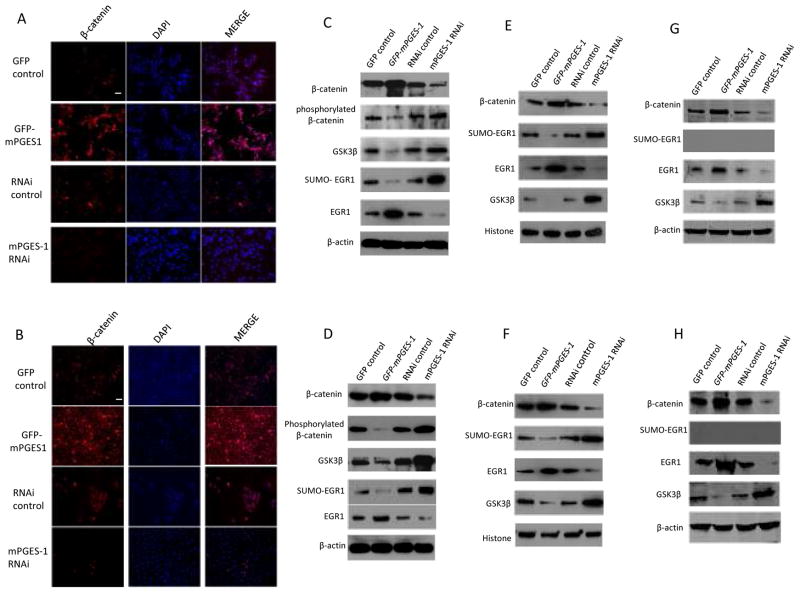
As both prostaglandin and Wnt/β-catenin signaling pathways are active in human HCC(Branda and Wands 2006, Monga 2006, Satoh et al 2000, Wu 2006, Zucman-Rossi et al 2006), we examined whether mPGES-1 might regulate β-catenin in our system. Confocal microscopy showed that the nuclear level of β-catenin was increased when mPGES-1 was overexpressed, but decreased when mPGES-1 was knocked down in both Hep3B and Huh7 stable cell lines (Fig 4A & B). These findings are consistent with the observations that PGE2 induces β-catenin accumulation in hepatic and colon cancer cells(Castellone et al 2005, Lim et al 2008, Lim et al 2009, Shao et al 2005).
Figure 4. mPGES-1 increases β-catenin and EGR1 in human HCC cells.
A & B. Confocal microscopy showing immunofluorescence staining of β-catenin in Hep3B (A) and Huh7 (B) stable cell lines (with TRITC staining and DAPI counterstaining; original magnification×200; scale bar 10μm). The level of β-catenin was increased in mPGES-1 overexpressed cells but decreased in mPGES-1 knockdown cells.
C & D. Western blotting using whole cellular proteins from Hep3B (C) and Huh7 (D) cells stably transfected with mPGES-1 expression vector or RNAi vector. mPGES-1 overexpression increases β-catenin with concurrent reduction of GSK-3β and phosphorylated β-catenin. In contrast, mPGES-1 knockdown reduces β-catenin with concurrent increase of GSK-3β and phosphorylated β-catenin. Furthermore, mPGES-1 overexpression also increases EGR1 with simultaneous reduction of SUMO-EGR1, whereas mPGES-1 knockdown reduces EGR1 but increases SUMO-EGR1.
E & F. Western blotting using nuclear proteins from Hep3B (E) and Huh7 (F) cells stably transfected with mPGES-1 expression vector or RNAi vector. mPGES-1 overexpressed cells show increased nuclear levels of β-catenin and EGR1 but decreased nuclear levels of GSK-3β and SUMO-EGR1. An opposite pattern was seen in cells with mPGES-1 depletion.
G & H. Western blotting using cytoplasmic proteins from Hep3B (G) and Huh7 (H) cells stably transfected with mPGES-1 expression vector or RNAi vector. mPGES-1 overexpression increases β-catenin with concurrent reduction of GSK-3β. In contrast, mPGES-1 knockdown reduces β-catenin with concurrent increase of GSK-3β. Furthermore, mPGES-1 overexpression also increases EGR1, whereas mPGES-1 knockdown reduces EGR1. SUMO-EGR1 was not detected in cytoplasmic protein.
We observed that the level of early growth response 1 (EGR1) was increased when mPGES-1 was overexpressed but decreased when mPGES-1 was knocked down (Supplementary Fig S5). This finding is noteworthy, given that EGR1 is a key transcription factor involved in the regulation of cell proliferation and apoptosis(Gitenay D 2009, Lee KH 2009, Ma et al 2009, Parra E 2009, Thiel et al 2010, Virolle et al 2001). Since both β-catenin and EGR1 are transcription factors/cofactors, we further examined their levels in the nuclei isolated from the Hep3B and Huh7 stable cell lines.
As shown in Fig 4C-H, the nuclear and cytoplasmic levels of β-catenin and EGR1 were increased in mPGES-1 overexpressed cells but decreased in mPGES-1 knockdown cells. Thus, both β-catenin and EGR1 are downstream targets of mPGES-1. It is of note that the level of β-catenin is inversely correlated with GSK-3β, whereas the level of EGR1 is inversely correlated with sumoylated EGR1 (SUMO-EGR1 is not detectable in the cytoplasmic extracts). The inverse correlation between β-catenin and GSK-3β/phosphorylated β-catenin suggests involvement of GSK-3β in mPGES-1-mediated regulation of β-catenin. This observation is not surprising, given that GSK-3β is known to play an essential role in the canonical Wnt signal-transduction pathway, initiating proteasomal degradation of β-catenin by phosphorylating β-catenin on key residues(BR. 2000, Itoh et al 2005). Interestingly, GSK-3β can also enter the nucleus where it binds β-catenin and inhibits β-catenin activity (does not result in β-catenin phosphorylation or degradation)(Bijur and Jope 2001, Caspi et al 2008, Diehl et al 1998, Morisco C 2001). In this study, we found that the level of GSK-3β in the nucleus and cytoplasm was decreased in mPGES-1 overexpressed cells but increased in mPGES-1 knockdown cells, suggesting that mPGES-1 initiated signaling prevents GSK-3β nuclear entry (thus contributing to β-catenin activation).
mPGES-1 regulates β-catenin and EGR1 levels through PGE2 in HCC cells
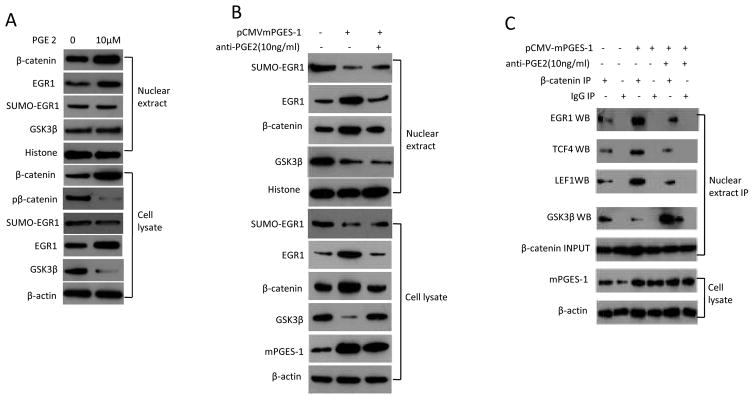
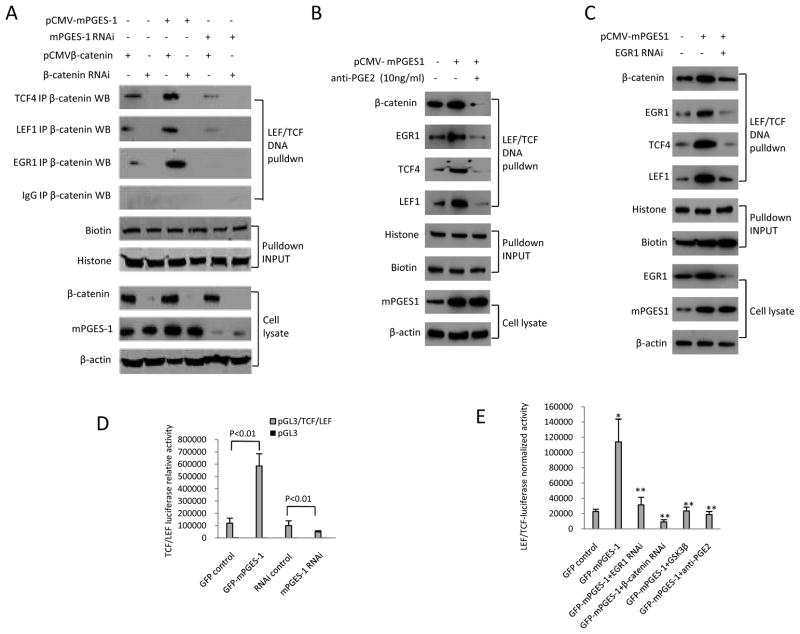
As mPGES-1 is a key enzyme for PGE2 synthesis, we examined the effect of PGE2 on β-catenin and EGR1 signaling molecules. Similar to the upregulation of β-catenin and EGR1 by mPGES-1 overexpression, PGE2 treatment also increased the level of β-catenin and EGR1 in nuclear proteins and cell lysates (Fig 5A). Consistent with the documented role of GSK-3β for β-catenin phosphorylation and degradation, we observed that PGE2 treatment (for 24hours) decreased the levels of GSK-3β and phospho-β-catenin in human HCC cells. Additionally, inhibition of PGE2 signaling by anti-PGE2 antibody partially prevented mPGES-1 induced increase of β-catenin and EGR1 (Fig 5B). Furthermore, anti-PGE2 antibody treatment also partially prevented mPGES-1 induced β-catenin binding to EGR1, TCF4 and LEF1 (Figure 5C). These findings suggest that mPGES-1 activates β-catenin and EGR1 through PGE2 in human HCC cells. The observation that anti-PGE2 antibody treatment (for 24hours) partially reverses mPGES-1-mediated reduction of GSK-3β suggests GSK- 3β inhibition by PGE2 in mPGES-1-induced β-catenin accumulation.
Figure 5. The effect of PGE2 in HCC cells.
A. Western blotting using whole cell lysates or nuclear extracts from Huh7 cells treated with 10μM PGE2 (Cayman Chemical Company) for 24 hours or the vehicle control (DMSO).
B. Huh7 cell line transfected with mPGES-1 expression vector were treated with 10ng/ml anti-PGE2 (highly specific for PGE2, purchased from Abcam, San Francisco, CA) or the vehicle control (DMSO) for 24 hours. The whole cell lysates or nuclear extracts were obtained for western blotting analysis.
C. Huh7 cell line transfected with mPGES-1 expression vector were treated with 10 ng/ml anti-PGE2 antibody or vehicle (DMSO) for 24 hours. The whole cell lysates or nuclear extracts were obtained for western blotting analysis. The nuclear extracts were subjected to immunoprecipitation with anti-β-catenin antibody followed by western blotting analysis for EGR1, TCF4, LEF1, and GSK-3β. Nuclear β-catenin was used as input control for immunoprecipitation; β-actin was used as internal control for routine western blotting. IP – immunoprecipitation; WB – western blotting.
mPGES-1 induces the formation of EGR1-β-catenin binding complex
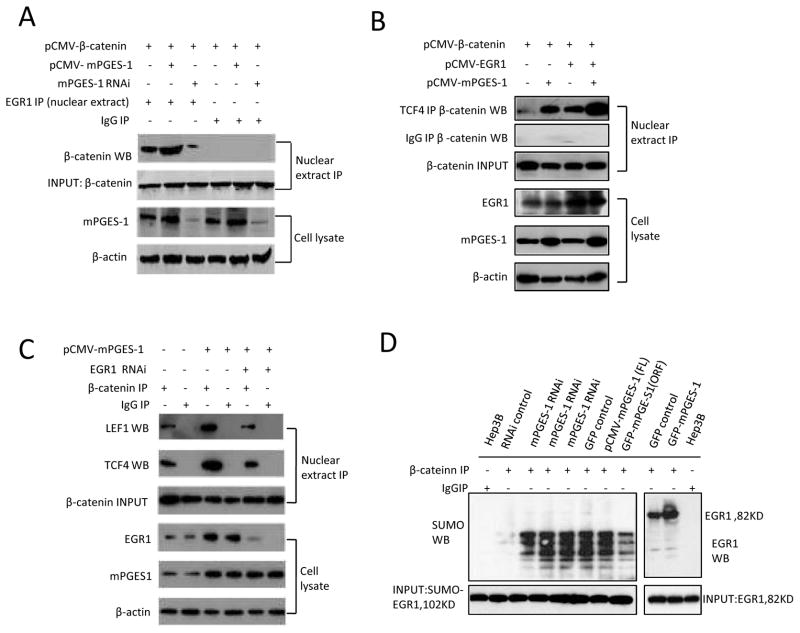
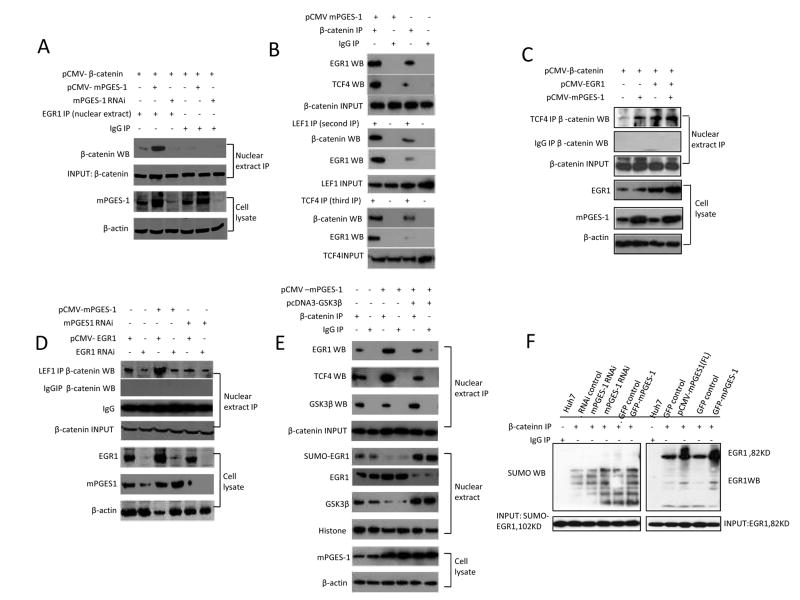
The results presented in the above sections suggest that mPGES-1-derived PGE2 increased the levels of β-catenin and EGR1. However, prior to the current study, it was not known whether EGR1 could interact with β-catenin in human cells. To investigate this possibility, we carried out immunoprecipitation assays to determine whether β-catenin might bind EGR1 in the nuclear extract isolated from Hep3B and Huh7 stable cell lines. As shown in Fig 6 and 7, overexpression of mPGES-1 increased nuclear β-catenin association with EGR1, whereas mPGES-1 knockdown decreased such an interaction. In addition, the interaction between β-catenin with TCF4 or LEF1 was also enhanced in mPGES-1 overexpressed cells but decreased in mPGES-1 knockdown cells. On the other hand, overexpression of GSK-3β inhibited mPGES-1-indued β-catenin association with EGR1 as well as TCF4. Furthermore, we observed that EGR1 overexpression enhanced mPGES-1-induced β-catenin interaction with TCF4 or LEF1 whereas EGR1 knockdown reduced this interaction. EGR1 overexpression, however, did not increase β-catenin association with LEF1 in cells with mPGES-1 depletion, suggesting that mPGES-1 is required for EGR1-mediated β-catenin and LEF1 association. Given that the function of EGR1 in cells can be regulated by sumoylation(Yu et al 2009), we further determined whether sumoylation of EGR1 is involved in mPGES-1-mediated β-catenin activation in HCC cells. Our data indicate that only non-sumoylated EGR1 (but not sumoylated EGR1) was able to bind β-catenin. Therefore, sumoylated EGR1 is probably not directly involved in mPGES-1-induced β-catenin activation in HCC cells. Taken together, these findings suggest an important role of EGR1 in mPGES-1-mediated β-catenin association with TCF4/LEF1 transcription factors.
Figure 6. mPGES-1 enhances nuclear β-catenin association with EGR1, TCF4 or LEF1 in Hep3B cells.
Hep3B cells were transfected with different vectors (mPGES-1 expression or RNAi vector, β-catenin expression vector, EGR1 expression or RNAi vector, and control vectors) as indicated on the top of the panels. The nuclear extracts were obtained and subjected to immunoprecipitation by using specific antibodies or IgG as the control, followed by western blotting using specific antibodies as indicated for each panel. The nuclear extracts or whole cell lysates were also processed for routine western blotting analysis. IP – immunoprecipitation; WB – western blotting.
A. mPGES-1 increased the association between β-catenin and EGR1. Nuclear β-catenin was used as input control for immunoprecipitation.
B. mPGES-1 increases the interaction between β-catenin and TCF4 in the nuclei isolated from Hep3B stable cell lines; the interaction is enhanced by EGR1 overexpression. Nuclear β-catenin was used as input control for immunoprecipitation.
C. mPGES-1 increases the interaction between β-catenin and TCF4 or LEF1 in the nuclei isolated from Hep3B stable cell lines; the interaction is decreased in cells with EGR1 depletion. Nuclear β-catenin was used as input control for immunoprecipitation.
D. mPGES-1 increases β-catenin binding to EGR1, but not SUMO-EGR1. Western blots for SUMO-EGR1 (102 KD) or EGR1 (82 KD) were used as input controls.
Figure 7. mPGES-1 enhances nuclear β-catenin association with EGR1 and TCF4 in Huh7 cells.
Huh7 cells were transfected with different vectors (mPGES-1 expression or RNAi vector, β-catenin expression vector, GSK-3β expression vector, EGR1 expression or RNAi vector, and control vectors) as indicated on the top of the panels. The nuclear extracts were obtained and subjected to immunoprecipitation by using specific antibodies or IgG as the control, followed by western blotting using specific antibodies as indicated for each panel. The nuclear extracts or whole cell lysates were also processed for routine western blotting analysis. IP – immunoprecipitation; WB – western blotting.
A. mPGES-1 increases the association between β-catenin and EGR1 in the nuclei isolated from Huh7 stable cell lines. Nuclear β-catenin was used as input control for immunoprecipitation.
B. mPGES-1 increases β-catenin interaction with EGR1, TCF4 or LEF1 in Huh7 cell lines. (Upper Panels) Nuclear extracts were obtained from Huh7 cells with or without mPGES-1 overexpression and processed for immunoprecipitation with anti-β-catenin antibody (or IgG as control), followed by western blotting analysis for EGR1 and TCF4. (Mid Panels) The aforementioned first immunoprecipitates were cleansed with the elution buffer (0.1% Triton X-100, 0.1% SDS, 0.5% BSA in PBS) (40μl aliquot first immunoprecipitates was eluted with 750μl elution buffer and incubated for 50min at room temperature). The samples were then subjected to repeat immunoprecipitation (second IP) with anti-LEF1 antibody (or IgG as control), followed by western blotting analysis for EGR1 and β-catenin. (Lower Panels) The aforementioned second immunoprecipitates were cleansed with the elution buffer and subjected to an additional repeat immunoprecipitation (third IP) with anti-TCF4 antibody (or IgG as control), followed by western blotting analysis for EGR1 and β-catenin.
C. mPGES-1 increases β-catenin binding to EGR1, but not SUM-EGR1 in Huh7 stable cell lines. Nuclear β-catenin was used as input control for immunoprecipitation.
D. mPGES-1 increases the interaction between β-catenin and TCF4 in the nuclei isolated from Huh7 stable cell lines; the interaction is enhanced by EGR1 overexpression. Nuclear β-catenin was used as input control for immunoprecipitation.
E. mPGES-1 increases the interaction between β-catenin and LEF1 in the nuclei isolated from Huh7 stable cell lines; the interaction is influenced by EGR1.
F. mPGES-1 increases β-catenin interaction with EGR1 or TCF4 in Huh7 stable cell lines; this interaction is partially inhibited by GSK-3β. GSK-3β overexpression increases EGR1 sumoylation. Western blots for SUMO-EGR1 (102 KD) or EGR1 (82 KD) were used as input controls.
mPGES-1 induces EGR1/β-catenin binding to LEF/TCF DNA consensus site
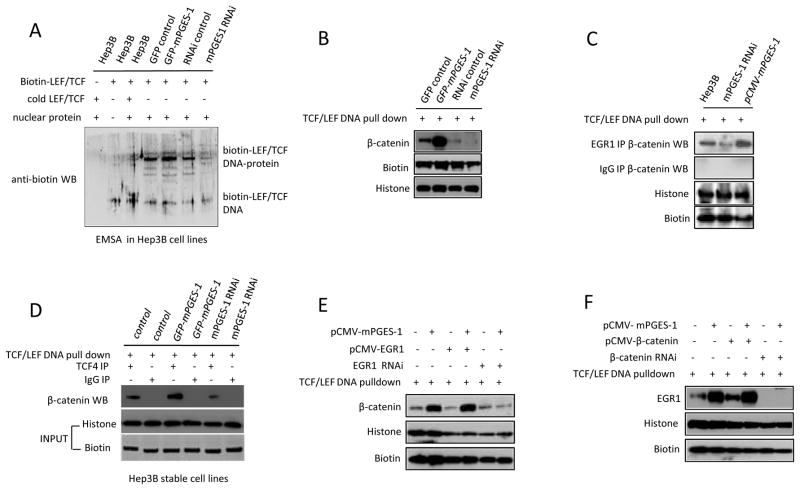
We next performed EMSA and DNA pulldown assays to determine the effect of mPGES-1 expression on β-catenin binding to the LEF/TCF consensus site in HCC cells. As shown in Fig 8A, mPGES-1 overexpression enhanced the formation of TCF4/LEF1 protein-DNA complex as detected by EMSA, whereas mPGES-1 knockdown reduced this complex. Similarly, DNA pulldown assay also showed that β-catenin association with TCF/LEF oligonucleotide was increased in mPGES-1 overexpressed cells but decreased in mPGES-1 knockdown cells (Fig 8B). Furthermore, mPGES-1 overexpression enhanced the interaction between β-catenin and EGR1 on TCF/LEF DNA consensus site whereas mPGES-1 knockdown reduced this interaction (Fig 8C and 9A). The association between β-catenin and TCF4 or LEF1 on the TCF/LEF DNA consensus site was also more abundant in mPGES-1 overexpressed cell but decreased in mPGES-1 knockdown cells (Fig 8D and 9A). These findings suggest that mPGES-1 signaling increases β-catenin association with EGR1, TCF4 and LEF1 and enhances their DNA binding ability. The observation that anti-PGE2 antibody prevented mPGES-1 induced association of β-catenin/EGR1/TCF4/LEF1 to the TCF/LEF DNA consensus site (Fig 9B) suggests the involvement of PGE2 in this process.
Figure 8. mPGES-1 increases β-catenin DNA binding in Hep3B stable cell lines.
Nuclear extracts were isolated from Hep3B cells stably transfected with different vectors for EMSA (A) or DNA pull down (B-F) with biotin-LEF/TCF oligonucleotide [5′-Biotin-AGATCAAAGGG-3′] (or non-biotinylated cold probe as control), followed by western blotting analysis using specific antibodies as indicated in each panel. WB: Western blotting
A. EMSA showing that mPGES-1 overexpression increased the binding of nuclear protein with LEF/TCF consensus sequence, whereas mPGES-1 knockdown inhibited it.
B. DNA pull down assay showing that mPGES-1 increases β-catenin DNA binding.
C. DNA pull down with co-immunoprecipitation assay showing that mPGES-1 increases β-catenin and EGR1 interaction on TCF/LEF consensus site.
D. DNA pull down with co-immunoprecipitation assay showing that mPGES-1 increases β-catenin and TCF4 interaction on TCF/LEF bind site.
E. DNA pull down assay showing that EGR1 knockdown prevents mPGES-1-induced β-catenin binding to TCF/LEF consensus site.
F. DNA pull down assay showing that β-catenin knockdown prevents mPGES-1-induced EGR1 binding to TCF/LEF consensus site.
Figure 9. mPGES-1 increases β-catenin DNA binding and reporter activity in Huh7 stable cell lines.
A. Nuclear extracts isolated from Huh7 cell lines transfected with different vectors were utilized for DNA-pulldown with co-immunoprecipitation assay. mPGES-1 overexpression increases the association of β-catenin, TCF4, LEF1 and EGR1 with the LEF/TCF DNA binding site; in contrast, mPGES-1 knockdown decreases these interactions.
B. Huh7 cell line transfected with mPGES-1 expression vector were treated with 10μM anti-PGE2 or the vehicle (DMSO) for 24 hours. The nuclear extracts were isolated for DNA-pulldown analysis with biotinylated double-stranded TCF/LEF oligonucleotides followed by western blotting analysis for β-catenin, TCF4, LEF1 and EGR1.
C. Nuclear extracts from Huh7 cell lines transfected with mPGES-1 expression vector and EGR1 RNAi were utilized for DNA-pulldown analysis with biotinylated double-stranded TCF/LEF oligonucleotides, followed by western blotting analysis for β-catenin, TCF4, LEF1 and EGR1. EGR1 knockdown abrogates mPGES-1-induced association of β-catenin, EGR1, TCF4, LEF1 to the TCF/LEF DNA consensus site.
D. The effect of mPGES-1 on TCF/LEF reporter activity. Huh7 cells grown in 6-well plates (1 × 10⁵/well) were transiently transfected with 1 μg of luciferase construct (pGL3/TCF/LEF/Luc or pGL3/Luc) plus pCMV/β-catenin with Lipofectiamine™2000. After incubation for 36 h, the cells were harvested and the cell lysates were obtained to measure luciferase reporter activity, which was normalized by the amount of cellular proteins. The TCF/LEF luciferase reporter activity is increased in mPGES-1 overexpressed cells but decreased in mPGES-1 knockdown cells (p<0.01, data presented as mean ± SEM).
E. The effect of EGR1, β-catenin, GSK-3β and PGE2 on mPGES-1-mediated β-catenin activation. Huh7 cells grown in 6-well plates (1 × 10⁵/well) were transiently transfected with 1 μg of luciferase construct (pGL3/TCF/LEF/Luc or pGL3/Luc) with indicated treatments. The data are presented as mean ± SEM (*p<0.01 compared to control; **p<0.01 compared to mPGES-1 overexpression).
To further determine the role of EGR1 in mPGES-1-mediated β-catenin binding to TCF/LEF site, we utilized HCC cells with EGR1 overexpression or knockdown for DNA pulldown analysis. As shown in Fig 8E and 9C, mPGES-1-mediated binding of β-catenin to TCF/LEF site was enhanced when EGR1 was overexpressed but diminished when EGR1 was knocked down. Knockdown of EGR1 also prevented mPGES-1-induced assembly of β-catenin, TCF4 and LEF1 on their DNA consensus site (Fig 9C). These findings demonstrate an important role of EGR1 in mPGES-1-induced β-catenin activation.
As a complementary approach, we utilized cells with β-catenin overexpression or knockdown for DNA pulldown analysis. As shown in Fig 8F, the binding of EGR1 to TCF/LEF consensus site was increased when mPGES-1 or β-catenin was overexpressed; in contrast, EGR1 could not bind to LEF/TCF consensus site when β-catenin was knocked down. The latter observation indicates that EGR1 itself cannot bind to TCF/LEF DNA element and its association with TCF/LEF consensus site is mediated through interaction with the β-catenin protein. Taken together, these findings show that mPGES-1 signaling increases the association of the β-catenin protein complex with the LEF/TCF consensus site in HCC cells and that EGR1 plays a critical role in this process.
mPGES-1 increased β-catenin reporter activity
Consistent with the effect of mPGES-1 signaling on β-catenin protein complex assembly and DNA binding as presented in the above sections, our further experiments revealed that mPGES-1 overexpression increased β-catenin reporter activity whereas mPGES-1 knockdown inhibited it (Fig 9D). Moreover, siRNA depletion of EGR1 significantly inhibited mPGES-1 induced TCF/LEF reporter activity; the degree of inhibition appears similar to that induced by β-catenin knockdown or GSK-3β overexpression (Fig 9E). These findings further support an important role of EGR1 in mPGES-1-induced β-catenin activation. The observation that anti-PGE2 antibody prevents mPGES-1-induced β-catenin reporter activity (Fig 9E) further suggests the involvement of PGE2 in β-catenin activation.
mPGES-1-mediated HCC cell growth and invasion depend on β-catenin and EGR1 status
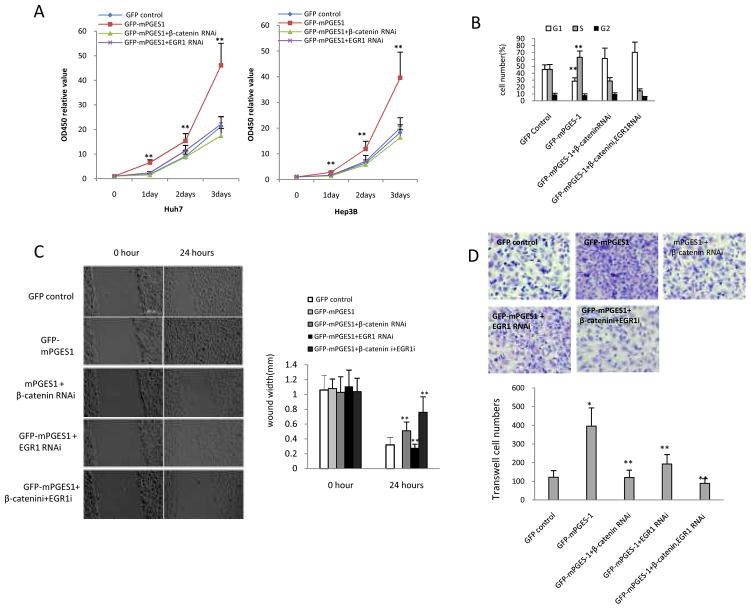
We next examined mPGES-1-mediated growth parameters in cells with overexpression or knockdown of β-catenin and EGR1. As shown in Fig 10A, β-catenin knockdown significantly reduced mPGES-1-induced HCC cell growth. In addition, β-catenin knockdown also partially reduced mPGES-1-induced accumulation of S phase cells, whereas β-catenin overexpression offset mPGES-1 effect (Fig 10B). These findings suggest a key role of β-catenin in mPGES-1-induced G1/S transition and cell growth. It is of note that knockdown of both β-catenin and EGR1 almost completely abrogated mPGES-1-induced S phase cell accumulation. In the wound healing assay, knockdown of β-catenin or EGR1 significantly prevented mPGES-1-induced cell migration and injury repair ability (Fig 10C). Knockdown of both β-catenin and EGR1 more effectively prevented mPGES-1-induced cell migration and injury repair than knockdown of either β-catenin or EGR1 alone. In transwell assays, knockdown of β-catenin or EGR1 significantly prevented mPGES-1-induced cell invasion (Fig 10D). These data suggest that mPGES-1-mediated cell growth, migration, invasion and cell cycle progression are regulated through β-catenin and EGR1.
Figure 10. mPGES-1-mediated HCC cell growth and invasion depend on β-catenin and EGR1 status in Huh7 cells.
A. Cell growth assay. Huh7 cells and Hep3B cells stably transfected with the control vector or mPGES-1 expression vector were transfected with the β-catenin siRNA or EGR1 siRNA and the cell growth was determined by WST-1 assay. The data represent the mean ± SEM from three independent experiments (** p<0.01; left panel – Huh7 cells; right panel – Hep3B cells).
B. Cell cycle analysis. Huh7 cells stably transfected with the control vector or mPGES-1 expression vector were transfected with the β-catenin siRNA and/or EGR1 siRNA; cell cycle progression was determined by flow cytometry. The data are expressed as Mean ± SEM (**P<0.01).
C. Wound healing assay. Representative photographs of cell migration/injury repair from different groups are shown at the left panels (0 and 24 hours after scratch, scale bar 500μm). The average wound width is shown at the right panels (** p<0.01 compared to mPGES-1 overexpression alone).
D. Transwell cell invasion assay. Huh7 cells stably transfected with the mPGES-1 expression vector or control vector were transfected with the β-catenin siRNA and/or EGR1 siRNA; cell invasion was determined by transwell assays. Representative photographs of invaded cells from different groups are shown at the upper panel. The average numbers of the invaded cells from different groups are shown at the lower panel (the data are presented as Mean ± SEM) (*p<0.01 compared to control; **p<0.01 compared to mPGES-1 overexpression).
The effect of mPGES-1 on β-catenin downstream signaling molecules
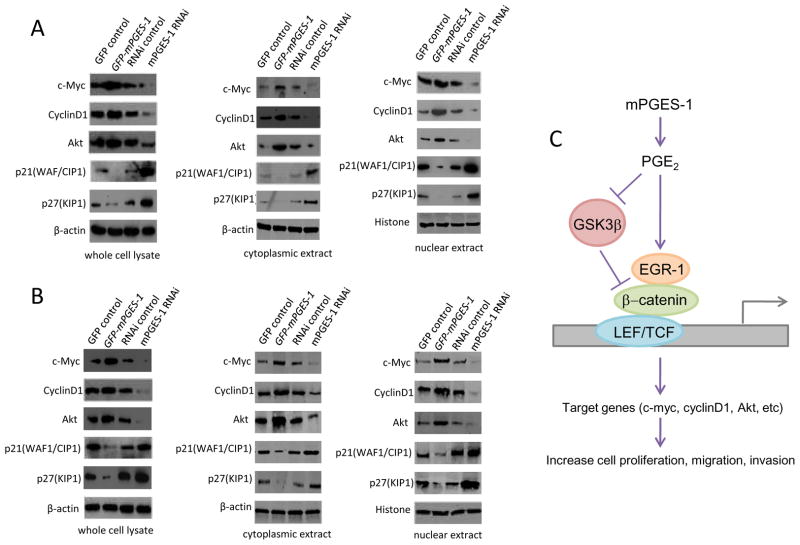
We further examined the potential effect of mPGES-1 on the β-catenin downstream signaling molecules. As shown in Figure 11, the expression of β-catenin downstream genes including c-myc, cyclin D1 and Akt are increased in mPGES-1 overexpressed cells but decreased in mPGES-1 depleted cells. Consistent with the inhibition of p21WAF/CIP1 and p27KIP1 by β-catenin pathway(Philipp-Staheli et al 2002, Saegusa et al 2004), the levels of these CDK inhibitors were decreased when mPGES-1 was overexpressed but increased when mPGES-1 was knocked down. These findings reveal that mPGES-1 regulates β-catenin downstream genes in HCC cells.
Figure 11.
A&B. Western blotting for β-catenin downstream genes was performed in the whole cell lysates, cytoplasmic extracts or nuclear extracts isolated from Hep3B (A) and Huh7 (B) cells with altered expression of mPGES-1. The levels of c-Myc, cyclinD1 and AKT and were increased in mPGES-1 overexpressed cells but decreased in mPGES-1 depleted cells. The levels of p21WAF/CIP1 and p27KIP1 were decreased when mPGES-1 was overexpressed but increased when mPGES-1 was knocked down. C. Schematic illustration of key mechanisms for mPGES-1-induced HCC growth.
DISCUSSION
The current study provides both in vitro and in vivo evidences for an important role of mPGES-1 in hepatocarcinogenesis. Our data showed that overexpression of mPGES-1 in HCC cells increased tumor cell growth, invasion, migration and clonogenic formation capacity, whereas knockdown of mPGES-1 reduced these parameters. In the SCID mouse tumor xenograft model, mPGES-1 overexpression enhanced tumor growth whereas mPGES-1 knockdown delayed tumor development and reduced tumor size. Our further experiments suggest that β-catenin is a key mPGES-1 downstream target in HCC cells; this assertion is based on the following observations: (1) mPGES-1 overexpression increased the nuclear level of β-catenin, whereas mPGES-1 knockdown decreased it; (2) mPGES-1 overexpression increased β-catenin reporter activity whereas mPGES-1 knockdown inhibited it; (3) mPGES-1 overexpression enhanced β-catenin association with TCF/LEF, whereas mPGES-1 knockdown decreased it; (4) mPGES-1 overexpression enhanced β-catenin association with TCF/LEF oligonucleotide, whereas mPGES-1 knockdown reduced it. The importance of β-catenin in mPGES-1-mediated HCC cell growth and progression is reflected by the observation that β-catenin knockdown inhibited mPGES-1-induced HCC cell growth, migration, invasion and cell cycle progression.
mPGES-1-mediated PGE2 biosynthetic pathway has been implicated in the regulation of various physiological and pathophysiological processes(Jakobsson et al 1999, Kamei et al 2010, Kapoor et al 2007, Murakami et al 2000, Murakami and Kudo 2006, Samuelsson et al 2007, Stichtenoth DO 2001, Thoren et al 2003). In this study several observations indicate the involvement of PGE2 in mPGES-1-induced activation of EGR1 and β-catenin in human HCC cells: (1) both mPGES-1 overexpression and PGE2 treatment increased the level of β-catenin and EGR1 with concomitant reduction of GSK-3β and phospho-β-catenin; (2) pretreatment of human HCC cells with anti-PGE2 antibody prevented mPGES-1-induced increase of β-catenin and EGR1 as well as β-catenin binding to EGR1, TCF4 and LEF1; (3) pretreatment with anti-PGE2 antibody prevented mPGES-1-induced reduction of GSK-3β; (4) pretreatment with anti-PGE2 antibody prevented mPGES-1-induced association of β-catenin/EGR1/TCF4/LEF1 to the TCF/LEF DNA consensus site and decreased mPGES-1-induced β-catenin reporter activity. However, the exact role of individual EP receptors for EGR1 and β-catenin activation in HCC cells remains to be further defined.
The regulation of β-catenin activity occurs via a cytoplasmatic multiprotein complex containing GSK-3β that phosphorylates β-catenin, leading to its proteosomal degradation(Henderson 2000, Itoh et al 2005). In parallel, GSK-3β can also enter the nucleus where it binds β-catenin and inhibits β-catenin/TCF-mediated transcription(Bijur and Jope 2001, Caspi et al 2008, Diehl et al 1998, Morisco C 2001). Previous studies have shown that PGE2 induces β-catenin accumulation in hepatic and colon cancer cells through inhibition of GSK-3β-mediated β-catenin degradation(Castellone et al 2005, Lim et al 2008, Lim et al 2009, Shao et al 2005). In the current study, we provide novel evidence for the involvement of EGR1 in mPGES-1/PGE2-induced β-catenin activation. Our data showed that mPGES-1 overexpression increased β-catenin as well as EGR1 with concomitant reduction of GSK-3β, phophorylated β-catenin and SUMO-EGR1. In contrast, mPGES-1 knockdown reduced β-catenin and EGR1 with simultaneous increase of GSK-3β, phophorylated β-catenin and SUMO-EGR1. Western blotting analysis using nuclear proteins showed that mPGES-1 overexpression or PGE2 treatment enhanced β-catenin and EGR1 trafficking from cytoplasm to nucleus, whereas mPGES-1 knockdown or anti-PGE2 antibody treatment reduced this process. These observations suggest that mPGES-1/PGE2 signaling activates β-catenin through regulation of EGR1 as well as GSK-3β.
EGR1 is emerging as an important regulator of carcinogenesis(Gitenay D 2009, Lee KH 2009, Ma et al 2009, Parra E 2009, Thiel et al 2010, Virolle et al 2001). In this study, our data have shown that mPGES-1 signaling induces accumulation of EGR1 in human HCC cells. This observation is consistent with a previous study by Danesch and colleagues showing that PGE2 increases EGR1 mRNA in 3T3 fibroblasts(Danesch et al 1994). Given that EGR1 can induce mPGES-1 gene expression through binding to the GC box region of the mPGES-1 gene promoter(Moon et al 2007, Ngiam et al 2010, Subbaramaiah et al 2004), it is conceivable that EGR1 and mPGES-1 may form a positive feedback loop that promotes tumorigenesis. A previous study has shown that EGR1 modulates β-catenin signaling pathway through up-regulating the expression of TCF4 and p300(Saegusa et al 2008). However, prior to the current study it remains unknown whether these two transcription factors (EGR1 and β-catenin) might directly interact with each other in human cells. This study provides novel evidence for a direct interaction between EGR1 and β-catenin in human HCC cells. Our data showed that mPGES-1 overexpression increased nuclear β-catenin association with EGR1, whereas mPGES-1 knockdown decreased this interaction. Furthermore, EGR1 overexpression was found to enhance mPGES-1-induced β-catenin binding to TCF4/LEF1 proteins as well as their association with TCF/LEF DNA consensus element, whereas EGR1 knockdown decreased these interactions. The observation that β-catenin knockdown prevents mPGES-1-induced EGR1 binding to LEF/TCF DNA consensus site suggests that the effect of EGR1 is mediated through its association with β-catenin protein. Taken together, our findings reveal mPGES-1/PGE2-induced activation of EGR1 and β-catenin in HCC cells.
The observation that SUMO-EGR1 did not bind β-catenin suggests that EGR1 sumoylation is probably not directly involved in mPGES-1-mediated β-catenin activation in HCC cells. However, given the reciprocal inverse correlation between EGR1 and SUMO-EGR1 in cells with altered mPGES-1 expression, it is possible that sumoylation of EGR1 may influence β-catenin activity by depleting the pool of non-sumoylated EGR1. In this context, it is interesting that GSK-3β overexpression increased sumoylated EGR1 but decreased nonsumoylated EGR1; these findings suggest that GSK-3β might inhibit β-catenin activity through sumoylation of EGR1, which leads to reduction of nonsumoylated EGR1. This viewpoint is corroborated by the observation that GSK-3β overexpression partially inhibited mPGES-1-indued β-catenin association with TCF4 and EGR1.
In summary, this study shows that mPGES-1 and its enzymatic product, PGE2, inhibits GSK-3β and induces the formation of EGR1-β-catenin complex which interacts with TCF4/LEF1 transcription factors, leading to β-catenin activation and upregulation of its downstream genes in human HCC cells (illustrated in Fig 11C). The observation that β-catenin and EGR1 knockdown reverses mPGES-1 oncogenic potential demonstrates an important role of EGR1 and β-catenin in mPGES-1-induced HCC growth and progression. Our findings disclose a novel connection between mPGES-1/PGE2 and EGR1/β-catenin signaling pathways which are crucial for hepatocarcinogenesis. It is conceivable that these molecules may serve as important future therapeutic targets for effective chemoprevention and treatment of human HCC.
MATERIALS AND METHODS
Cell lines and plasmids
Human HCC cell lines (Hep3B and Huh7) were maintained in Minimum Essential Medium with Eagle’s Salts (EMEM) from Invitrogen (Carlsbad, CA) supplemented with 10% heat-inactivated (56°C, 30 minutes) fetal bovine serum (Sigma) in a humidified atmosphere of 5% CO2 incubator at 37°C. Plasmids purchased from Origene (Rockville, MD) are pCMV6-AC-GFP control vector, pCMV6-AV-GFP-mPGES-1, pGFP-V-RS control vector, pGFP-V-RS-mPGES-1, pGFP-V-RS-β-catenin, pGFP-V-RS-EGR1, pCMV5 control vector, pCMV5-β-catenin, pCMV5-EGR1, and pCMV5-mPGES-1.
Transfection and stable cell lines
Hep3B and Huh7 cells were transfected with either pCMV6-AV-GFP-mPGES-1 overexpression plasmid, pCMV6-AC-GFP control vector, pGFP-V-RS-mPGES-1 knock-down plasmid, or pGFP-V-RS control vector using lipofectamineR 2000 (Invitrogen). Stable cell lines were selected by culturing the transfected cells with medium containing 1–2 mg/ml G418 (Calbiochem) for mPGES-1 overexpression or 1–2 μg/ml Puromycin (Invitrogen) for mPGES-1 knockdown. The selective media were replaced every 3 days. Distinct colonies of surviving cells were transferred onto 96-well plates and the cultures continued in selection media. Transfection efficiency was measured by immunofluorescence staining and Western blot using anti-GFP or anti-mPGES-1.
Cell proliferation WST assay
The cell proliferation was determined by using the cell proliferation reagent WST-1. In brief, cells at a concentration 4×10³ were seeded into 96-well plates in 100μl culture medium containing 10% FBS to allow the cell re-attachment. The cells were then synchronized in G0 phase by serum deprivation and then released from growth arrest by reexposure to serum for the assay. The cell proliferation reagent WST-1(Roche) was added to each well (10μg/well) and the cells were incubated for up to 4 hours at 37°C and 5% CO2. OD450 was measured with an ELISA reader. Each sample was assayed in triplicates at daily intervals after seeding for up to 6 days.
PGE2 assay
Enzymeimmunoassay (EIA) was performed to determine the level of PGE2 by using the Amersham PGE2 biotrak EIA system (GE Healthcare) according to the manufacturer’s instructions.
Western blotting
At the end of each treatment, the cells were washed twice with ice-cold phosphate-buffered saline (PBS) then sonicated on ice in a lysis buffer (50 mM Tris-HCl, pH8.0, containing 150 mM NaCl, 1% Nonidet P-40, 5 mM EDTA, with the protease inhibitor tablets from Roche, or together with 50 mM sodium fluoride, 25 mM glycerophosphate, or 1 mM Na3VO4 for phosphorylation assay). Cell lysates were centrifuged at 12,000 × g for 10 minutes at 4°C and the supernatants were collected for western blotting. Protein concentration was measured using a Bio-Rad protein assay (Bio-Rad). After boiling for 5 minutes in the loading buffer with 10% 2-mercaptoethanol, the samples containing 30 μg protein were separated on 10% Tris-glycine gels (Invitrogen); the separated proteins were transferred onto a nitrocellulose membrane (Bio-Rad). Immunoblotting was performed using individual antibodies (including mouse monoclonal anti-mPGES-1, β-catenin, EGR1, SUM1 and biotin from Santa Cruz; β-actin from Sigma; rabbit polyclonal anti-phospho-β-catenin, GSK-3β from Cell Signaling; histone from Abcam; and anti-TurboGFP from Evrogen).
Co-immunoprecipitation (IP)
For co-immunoprecipitation, the cells were lysed in 1 ml of the whole-cell extract buffer (50 mM pH7.6 TrisCl, 150 mM NaCl, 0.5–1% NP40, 0.1mM EDTA, 1.0 mM DTT, with protease inhibitor tablets from Roche). 500μl of total cell lysates were used in immunoprecipitation with indicated antibodies. In brief, cell lysates were pre-cleared with 30μl protein G/A-plus agarose beads (Santa Cruz) by rotation for 1 hour at 4°C and the supernatant were obtained after centrifugation (1,000 × g) at 4°C. The precleared supernatant was incubated with 2 μg antibody by rotation for 4 hours at 4°C; the immunoprecipitates were then incubated with 30μl protein G/A-plus agarose beads by rotation overnight at 4°C. The precipitates were washed five times ×10 min with beads wash solution (50 mM pH7.6 TrisCl,150 mM NaCl, 0.1% NP-40,1mM EDTA) and then resuspended in 40 μl 2×SDS-PAGE sample loading buffer for Western blot with indicated antibodies.
DNA pull down assay
Cells were lysed by sonication in HKMG buffer (10 mM HEPES, PH7.9, 100 mM KCl, 5 mM MgCl2,10% glycerol,1 mM DTT, and 0.5% NP40) containing protease and phosphatase inhibitors for preparation of nuclear exacts. The nuclear extracts were precleared with Streptavidin-agarose Resin (Thermo) for 1 hour, then the precleared supernatant was incubated with 1μg biotinylated double-stranded oligonucleotides TCF/LEF-site : 5 ′-Biotin-AGATCAAAGGG-3′ and 5′-Biotin-CCCTTTGATCT -3′ (synthesized by Integrated DNA Technologies) and 10μg poly(dI-dC) for 24 hours. DNA-bound protein was collected with streptavidin-agarose resin. The resin bound complex was washed with 0.5–1.0 ml binding buffer with centrifugation for 1–2 minutes at 2000×g for at least five times. After the final wash, the resin-bound complex was dissolved in SDS-PAGE sample buffer for western blotting with indicated antibodies.
Xenograft transplantation and in vivo tumor studies
Four-week male athymic NOD CB17-prkdc/SCID mice from Jackson laboratory were inoculation subcutaneously at the armpit with Hep3B or Huh7 cells (100 μl cell suspension at a concentration of 1 × 10⁸ cells per ml in PBS). The mice were observed over 4 weeks for tumor formation. Subsequently, the mice were sacrificed and the tumors were collected. The wet weight of the tumors was determined. One portion of each tumor was fixed in 4% paraformaldehyde and embedded in paraffin for histological examination; the other portions were processed for protein extraction or immunochemical staining. The use of mice for this work was reviewed and approved by the institutional animal care and use committee in accordance with the national institutes of health guidelines.
Supplementary Material
Acknowledgments
Supported by National Institutes of Health grants CA106280, CA102325, CA134568 and DK077776 (to T.W.) and CA137729 (to C.H.)
ABBREVIATIONS
- COX-2
cyclooxygenase-2
- GSK-3β
glycogen synthase kinase 3 beta
- HCC
hepatocellular carcinoma
- LEF
lymphoid enhancer factor
- mPGES-1
microsomal prostaglandin E synthase-1
- PGE2
prostaglandin E2
- SCID
severe combined immunodeficiency
- SUMO
small ubiquitin-like modifier
- TCF
T-cell factor
Footnotes
The authors declare no conflict of interest.
References
- Bae SH, Jung ES, Park YM, Kim BS, Kim BK, Kim DG, et al. Expression of cyclooxygenase-2 (COX-2) in hepatocellular carcinoma and growth inhibition of hepatoma cell lines by a COX-2 inhibitor, NS-398. Clin Cancer Res. 2001;7:1410–1418. [PubMed] [Google Scholar]
- Baron JA, Sandler RS, Bresalier RS, Quan H, Riddell R, Lanas A, et al. A randomized trial of rofecoxib for the chemoprevention of colorectal adenomas. Gastroenterology. 2006;131:1674–1682. doi: 10.1053/j.gastro.2006.08.079. [DOI] [PubMed] [Google Scholar]
- Bijur GN, Jope RS. Proapoptotic stimuli induce nuclear accumulation of glycogen synthase kinase-3 beta. J Biol Chem. 2001;276:37436–37442. doi: 10.1074/jbc.M105725200. [DOI] [PMC free article] [PubMed] [Google Scholar]
- BRH Nuclear-cytoplasmic shuttling of APC regulates beta-catenin subcellular localization and turnover. Nat Cell Biol. 2000;2:653–660. doi: 10.1038/35023605. [DOI] [PubMed] [Google Scholar]
- Branda M, Wands JR. Signal transduction cascades and hepatitis B and C related hepatocellular carcinoma. Hepatology. 2006;43:891–902. doi: 10.1002/hep.21196. [DOI] [PubMed] [Google Scholar]
- Caspi M, Zilberberg A, Eldar-Finkelman H, Rosin-Arbesfeld R. Nuclear GSK-3beta inhibits the canonical Wnt signalling pathway in a beta-catenin phosphorylation-independent manner. Oncogene. 2008;27:3546–3555. doi: 10.1038/sj.onc.1211026. [DOI] [PubMed] [Google Scholar]
- Castellone MD, Teramoto H, Williams BO, Druey KM, Gutkind JS. Prostaglandin E2 promotes colon cancer cell growth through a Gs-axin-beta-catenin signaling axis. Science. 2005;310:1504–1510. doi: 10.1126/science.1116221. [DOI] [PubMed] [Google Scholar]
- Cheng AS, Chan HL, To KF, Leung WK, Chan KK, Liew CT, et al. Cyclooxygenase-2 pathway correlates with vascular endothelial growth factor expression and tumor angiogenesis in hepatitis B virus-associated hepatocellular carcinoma. Int J Oncol. 2004;24:853–860. [PubMed] [Google Scholar]
- Clevers H. Wnt/beta-catenin signaling in development and disease. Cell. 2006;127:469–480. doi: 10.1016/j.cell.2006.10.018. [DOI] [PubMed] [Google Scholar]
- Couzin J. Clinical trials. Nail-biting time for trials of COX-2 drugs. Science. 2004;306:1673–1675. doi: 10.1126/science.306.5702.1673. [DOI] [PubMed] [Google Scholar]
- Danesch U, Weber PC, Sellmayer A. Arachidonic acid increases c-fos and Egr-1 mRNA in 3T3 fibroblasts by formation of prostaglandin E2 and activation of protein kinase C. J Biol Chem. 1994;269:27258–27263. [PubMed] [Google Scholar]
- Diehl JA, Cheng M, Roussel MF, Sherr CJ. Glycogen synthase kinase-3beta regulates cyclin D1 proteolysis and subcellular localization. Genes Dev. 1998;12:3499–3511. doi: 10.1101/gad.12.22.3499. [DOI] [PMC free article] [PubMed] [Google Scholar]
- Dihlmann S, Kloor M, Fallsehr C, von Knebel Doeberitz M. Regulation of AKT1 expression by beta-catenin/Tcf/Lef signaling in colorectal cancer cells. Carcinogenesis. 2005;26:1503–1512. doi: 10.1093/carcin/bgi120. [DOI] [PubMed] [Google Scholar]
- El-Serag HB, Mason AC. Rising incidence of hepatocellular carcinoma in the United States. N Engl J Med. 1999;340:745–750. doi: 10.1056/NEJM199903113401001. [DOI] [PubMed] [Google Scholar]
- El-Serag HB. Hepatocellular carcinoma: recent trends in the United States. Gastroenterology. 2004;127:S27–34. doi: 10.1053/j.gastro.2004.09.013. [DOI] [PubMed] [Google Scholar]
- Farazi PA, DePinho RA. Hepatocellular carcinoma pathogenesis: from genes to environment. Nat Rev Cancer. 2006;6:674–687. doi: 10.1038/nrc1934. [DOI] [PubMed] [Google Scholar]
- Giles RH, van Es JH, Clevers H. Caught up in a Wnt storm: Wnt signaling in cancer. Biochim Biophys Acta. 2003;1653:1–24. doi: 10.1016/s0304-419x(03)00005-2. [DOI] [PubMed] [Google Scholar]
- Gitenay DBV. Is EGR1 a potential target for prostate cancer therapy? Future Oncol. 2009;5:993–1003. doi: 10.2217/fon.09.67. [DOI] [PMC free article] [PubMed] [Google Scholar]
- Gordon MD, Nusse R. Wnt signaling: multiple pathways, multiple receptors, and multiple transcription factors. J Biol Chem. 2006;281:22429–22433. doi: 10.1074/jbc.R600015200. [DOI] [PubMed] [Google Scholar]
- Grosser T, Fries S, FitzGerald GA. Biological basis for the cardiovascular consequences of COX-2 inhibition: therapeutic challenges and opportunities. J Clin Invest. 2006;116:4–15. doi: 10.1172/JCI27291. [DOI] [PMC free article] [PubMed] [Google Scholar]
- Han C, Michalopoulos GK, Wu T. Prostaglandin E(2) receptor EP(1) transactivates EGFR/MET receptor tyrosine kinases and enhances invasiveness in human hepatocellular carcinoma cells. J Cell Physiol. 2006;207:261–270. doi: 10.1002/jcp.20560. [DOI] [PubMed] [Google Scholar]
- Hanaka H, Pawelzik SC, Johnsen JI, Rakonjac M, Terawaki K, Rasmuson A, et al. Microsomal prostaglandin E synthase 1 determines tumor growth in vivo of prostate and lung cancer cells. Proc Natl Acad Sci U S A. 2009;106:18757–18762. doi: 10.1073/pnas.0910218106. [DOI] [PMC free article] [PubMed] [Google Scholar]
- Henderson BR. Nuclear-cytoplasmic shuttling of APC regulates beta-catenin subcellular localization and turnover. Nat Cell Biol. 2000;2:653–660. doi: 10.1038/35023605. [DOI] [PubMed] [Google Scholar]
- Hoppler S, Kavanagh CL. Wnt signalling: variety at the core. J Cell Sci. 2007;120:385–393. doi: 10.1242/jcs.03363. [DOI] [PubMed] [Google Scholar]
- Itoh K, Brott BK, Bae GU, Ratcliffe MJ, Sokol SY. Nuclear localization is required for Dishevelled function in Wnt/beta-catenin signaling. J Biol. 2005;4:3. doi: 10.1186/jbiol20. [DOI] [PMC free article] [PubMed] [Google Scholar]
- Jakobsson PJ, Thoren S, Morgenstern R, Samuelsson B. Identification of human prostaglandin E synthase: a microsomal, glutathione-dependent, inducible enzyme, constituting a potential novel drug target. Proc Natl Acad Sci U S A. 1999;96:7220–7225. doi: 10.1073/pnas.96.13.7220. [DOI] [PMC free article] [PubMed] [Google Scholar]
- Kamei D, Murakami M, Sasaki Y, Nakatani Y, Majima M, Ishikawa Y, et al. Microsomal prostaglandin E synthase-1 in both cancer cells and hosts contributes to tumour growth, invasion and metastasis. Biochem J. 2010;425:361–371. doi: 10.1042/BJ20090045. [DOI] [PMC free article] [PubMed] [Google Scholar]
- Kang YJ, Mbonye UR, DeLong CJ, Wada M, Smith WL. Regulation of intracellular cyclooxygenase levels by gene transcription and protein degradation. Prog Lipid Res. 2007;46:108–125. doi: 10.1016/j.plipres.2007.01.001. [DOI] [PMC free article] [PubMed] [Google Scholar]
- Kapoor M, Kojima F, Qian M, Yang L, Crofford LJ. Microsomal prostaglandin E synthase-1 deficiency is associated with elevated peroxisome proliferator-activated receptor gamma: regulation by prostaglandin E2 via the phosphatidylinositol 3-kinase and Akt pathway. J Biol Chem. 2007;282:5356–5366. doi: 10.1074/jbc.M610153200. [DOI] [PubMed] [Google Scholar]
- Koga H, Sakisaka S, Ohishi M, Kawaguchi T, Taniguchi E, Sasatomi K, et al. Expression of cyclooxygenase-2 in human hepatocellular carcinoma: relevance to tumor dedifferentiation. Hepatology. 1999;29:688–696. doi: 10.1002/hep.510290355. [DOI] [PubMed] [Google Scholar]
- Kondo M, Yamamoto H, Nagano H, Okami J, Ito Y, Shimizu J, et al. Increased expression of COX-2 in nontumor liver tissue is associated with shorter disease-free survival in patients with hepatocellular carcinoma. Clin Cancer Res. 1999;5:4005–4012. [PubMed] [Google Scholar]
- Lee KHKJ. Hepatocyte growth factor induced up-regulations of VEGF through Egr-1 in hepatocellular carcinoma cells. Clin Exp Metastasis. 2009;26:685–692. doi: 10.1007/s10585-009-9266-7. [DOI] [PubMed] [Google Scholar]
- Leng J, Han C, Demetris AJ, Michalopoulos GK, Wu T. Cyclooxygenase-2 promotes hepatocellular carcinoma cell growth through Akt activation: evidence for Akt inhibition in celecoxib-induced apoptosis. Hepatology. 2003;38:756–768. doi: 10.1053/jhep.2003.50380. [DOI] [PubMed] [Google Scholar]
- Lim K, Han C, Xu L, Isse K, Demetris AJ, Wu T. Cyclooxygenase-2-derived prostaglandin E2 activates beta-catenin in human cholangiocarcinoma cells: evidence for inhibition of these signaling pathways by omega 3 polyunsaturated fatty acids. Cancer Res. 2008;68:553–560. doi: 10.1158/0008-5472.CAN-07-2295. [DOI] [PubMed] [Google Scholar]
- Lim K, Han C, Dai Y, Shen M, Wu T. Omega-3 polyunsaturated fatty acids inhibit hepatocellular carcinoma cell growth through blocking beta-catenin and cyclooxygenase-2. Mol Cancer Ther. 2009;8:3046–3055. doi: 10.1158/1535-7163.MCT-09-0551. [DOI] [PMC free article] [PubMed] [Google Scholar]
- Llovet JM, Bruix J. Molecular targeted therapies in hepatocellular carcinoma. Hepatology. 2008;48:1312–1327. doi: 10.1002/hep.22506. [DOI] [PMC free article] [PubMed] [Google Scholar]
- Ma J, Ren Z, Ma Y, Xu L, Zhao Y, Zheng C, et al. Targeted knockdown of EGR-1 inhibits IL-8 production and IL-8-mediated invasion of prostate cancer cells through suppressing EGR-1/NF-kappaB synergy. J Biol Chem. 2009;284:34600–34606. doi: 10.1074/jbc.M109.016246. [DOI] [PMC free article] [PubMed] [Google Scholar]
- Merle P, de la Monte S, Kim M, Herrmann M, Tanaka S, Von Dem Bussche A, et al. Functional consequences of frizzled-7 receptor overexpression in human hepatocellular carcinoma. Gastroenterology. 2004;127:1110–1122. doi: 10.1053/j.gastro.2004.07.009. [DOI] [PubMed] [Google Scholar]
- Monga SP. Hepatic adenomas: Presumed innocent until proven to be beta-catenin mutated. Hepatology. 2006;43:401–404. doi: 10.1002/hep.21110. [DOI] [PubMed] [Google Scholar]
- Moon RT, Kohn AD, De Ferrari GV, Kaykas A. WNT and beta-catenin signalling: diseases and therapies. Nat Rev Genet. 2004;5:691–701. doi: 10.1038/nrg1427. [DOI] [PubMed] [Google Scholar]
- Moon Y, Lee M, Yang H. Involvement of early growth response gene 1 in the modulation of microsomal prostaglandin E synthase 1 by epigallocatechin gallate in A549 human pulmonary epithelial cells. Biochem Pharmacol. 2007;73:125–135. doi: 10.1016/j.bcp.2006.08.017. [DOI] [PubMed] [Google Scholar]
- Morisco CSK, Hardt SE, Lee Y, Vatner SF, Sadoshima J. Glycogen synthase kinase 3beta regulates GATA4 in cardiac myocytes. J Biol Chem. 2001;276:28586–28597. doi: 10.1074/jbc.M103166200. [DOI] [PubMed] [Google Scholar]
- Murakami M, Naraba H, Tanioka T, Semmyo N, Nakatani Y, Kojima F, et al. Regulation of prostaglandin E2 biosynthesis by inducible membrane-associated prostaglandin E2 synthase that acts in concert with cyclooxygenase-2. J Biol Chem. 2000;275:32783–32792. doi: 10.1074/jbc.M003505200. [DOI] [PubMed] [Google Scholar]
- Murakami M, Kudo I. Prostaglandin E synthase: a novel drug target for inflammation and cancer. Curr Pharm Des. 2006;12:943–954. doi: 10.2174/138161206776055912. [DOI] [PubMed] [Google Scholar]
- Ngiam N, Peltekova V, Engelberts D, Otulakowski G, Post M, Kavanagh BP. Early growth response-1 worsens ventilator-induced lung injury by up-regulating prostanoid synthesis. Am J Respir Crit Care Med. 2010;181:947–956. doi: 10.1164/rccm.200908-1297OC. [DOI] [PubMed] [Google Scholar]
- Parra EOA, Saenz L. Down-regulation of Egr-1 by siRNA inhibits growth of human prostate carcinoma cell line PC-3. Oncol Rep. 2009;22:1513–1518. [PubMed] [Google Scholar]
- Philipp-Staheli J, Kim KH, Payne SR, Gurley KE, Liggitt D, Longton G, et al. Pathway-specific tumor suppression. Reduction of p27 accelerates gastrointestinal tumorigenesis in Apc mutant mice, but not in Smad3 mutant mice. Cancer Cell. 2002;1:355–368. doi: 10.1016/s1535-6108(02)00054-5. [DOI] [PubMed] [Google Scholar]
- Rahman MA, Dhar DK, Yamaguchi E, Maruyama S, Sato T, Hayashi H, et al. Coexpression of inducible nitric oxide synthase and COX-2 in hepatocellular carcinoma and surrounding liver: possible involvement of COX-2 in the angiogenesis of hepatitis C virus-positive cases. Clin Cancer Res. 2001;7:1325–1332. [PubMed] [Google Scholar]
- Saegusa M, Hashimura M, Kuwata T, Hamano M, Okayasu I. Beta-catenin simultaneously induces activation of the p53-p21WAF1 pathway and overexpression of cyclin D1 during squamous differentiation of endometrial carcinoma cells. Am J Pathol. 2004;164:1739–1749. doi: 10.1016/s0002-9440(10)63732-7. [DOI] [PMC free article] [PubMed] [Google Scholar]
- Saegusa M, Hashimura M, Kuwata T, Hamano M, Watanabe J, Kawaguchi M, et al. Transcription factor Egr1 acts as an upstream regulator of beta-catenin signalling through up-regulation of TCF4 and p300 expression during trans-differentiation of endometrial carcinoma cells. J Pathol. 2008;216:521–532. doi: 10.1002/path.2404. [DOI] [PubMed] [Google Scholar]
- Samuelsson B, Morgenstern R, Jakobsson PJ. Membrane prostaglandin E synthase-1: a novel therapeutic target. Pharmacol Rev. 2007;59:207–224. doi: 10.1124/pr.59.3.1. [DOI] [PubMed] [Google Scholar]
- Satoh S, Daigo Y, Furukawa Y, Kato T, Miwa N, Nishiwaki T, et al. AXIN1 mutations in hepatocellular carcinomas, and growth suppression in cancer cells by virus-mediated transfer of AXIN1. Nat Genet. 2000;24:245–250. doi: 10.1038/73448. [DOI] [PubMed] [Google Scholar]
- Shao J, Jung C, Liu C, Sheng H. Prostaglandin E2 Stimulates the beta-catenin/T cell factor-dependent transcription in colon cancer. J Biol Chem. 2005;280:26565–26572. doi: 10.1074/jbc.M413056200. [DOI] [PubMed] [Google Scholar]
- Shiota G, Okubo M, Noumi T, Noguchi N, Oyama K, Takano Y, et al. Cyclooxygenase-2 expression in hepatocellular carcinoma. Hepatogastroenterology. 1999;46:407–412. [PubMed] [Google Scholar]
- Smith WL, DeWitt DL, Garavito RM. Cyclooxygenases: structural, cellular, and molecular biology. Annu Rev Biochem. 2000;69:145–182. doi: 10.1146/annurev.biochem.69.1.145. [DOI] [PubMed] [Google Scholar]
- Smith WL, Langenbach R. Why there are two cyclooxygenase isozymes. J Clin Invest. 2001;107:1491–1495. doi: 10.1172/JCI13271. [DOI] [PMC free article] [PubMed] [Google Scholar]
- Stichtenoth DOTS, Bian H, Peters-Golden M, Jakobsson PJ, Crofford LJ. Microsomal prostaglandin E synthase is regulated by proinflammatory cytokines and glucocorticoids in primary rheumatoid synovial cells. J Immunol. 2001;167:469–474. doi: 10.4049/jimmunol.167.1.469. [DOI] [PubMed] [Google Scholar]
- Subbaramaiah K, Yoshimatsu K, Scherl E, Das KM, Glazier KD, Golijanin D, et al. Microsomal prostaglandin E synthase-1 is overexpressed in inflammatory bowel disease. Evidence for involvement of the transcription factor Egr-1. J Biol Chem. 2004;279:12647–12658. doi: 10.1074/jbc.M312972200. [DOI] [PubMed] [Google Scholar]
- Takii YAS, Fujioka H, Nakamura M, Komori A, Ito M, Taniguchi K, Daikoku M, Meda Y, Ohata K, Yano K, Shimoda S, Yatsuhashi H, Ishibashi H, Migita K. Expression of microsomal prostaglandin E synthase-1 in human hepatocelluar carcinoma. Liver Int. 2007;27:989–996. doi: 10.1111/j.1478-3231.2007.01530.x. [DOI] [PubMed] [Google Scholar]
- Tetsu O, McCormick F. Beta-catenin regulates expression of cyclin D1 in colon carcinoma cells. Nature. 1999;398:422–426. doi: 10.1038/18884. [DOI] [PubMed] [Google Scholar]
- Thiel G, Mayer SI, Muller I, Stefano L, Rossler OG. Egr-1-A Ca(2+)-regulated transcription factor. Cell Calcium. 2010;47:397–403. doi: 10.1016/j.ceca.2010.02.005. [DOI] [PubMed] [Google Scholar]
- Thompson MD, Monga SP. WNT/beta-catenin signaling in liver health and disease. Hepatology. 2007;45:1298–1305. doi: 10.1002/hep.21651. [DOI] [PubMed] [Google Scholar]
- Thoren S, Weinander R, Saha S, Jegerschold C, Pettersson PL, Samuelsson B, et al. Human microsomal prostaglandin E synthase-1: purification, functional characterization, and projection structure determination. J Biol Chem. 2003;278:22199–22209. doi: 10.1074/jbc.M303227200. [DOI] [PubMed] [Google Scholar]
- Vanchieri C. Vioxx withdrawal alarms cancer prevention researchers. J Natl Cancer Inst. 2004;96:1734–1735. doi: 10.1093/jnci/96.23.1734. [DOI] [PubMed] [Google Scholar]
- Virolle T, Adamson ED, Baron V, Birle D, Mercola D, Mustelin T, et al. The Egr-1 transcription factor directly activates PTEN during irradiation-induced signalling. Nat Cell Biol. 2001;3:1124–1128. doi: 10.1038/ncb1201-1124. [DOI] [PubMed] [Google Scholar]
- Wu T. Cyclooxygenase-2 in hepatocellular carcinoma. Cancer Treat Rev. 2006;32:28–44. doi: 10.1016/j.ctrv.2005.10.004. [DOI] [PubMed] [Google Scholar]
- Yu J, Zhang SS, Saito K, Williams S, Arimura Y, Ma Y, et al. PTEN regulation by Akt-EGR1-ARF-PTEN axis. EMBO J. 2009;28:21–33. doi: 10.1038/emboj.2008.238. [DOI] [PMC free article] [PubMed] [Google Scholar]
- Zucman-Rossi J, Jeannot E, Van Nhieu JT, Scoazec JY, Guettier C, Rebouissou S, et al. Genotype-phenotype correlation in hepatocellular adenoma: New classification and relationship with HCC. Hepatology. 2006;43:515–524. doi: 10.1002/hep.21068. [DOI] [PubMed] [Google Scholar]
Associated Data
This section collects any data citations, data availability statements, or supplementary materials included in this article.


