Abstract
A somatotopically organized region on the suprasylvian gyrus of the ferret was examined using multiunit recordings and anatomical tracer injections. This area, which contains a representation of the face, was bordered by the primary somatosensory area (SI), anteriorly, and by the visually-responsive rostral posterior parietal cortex (PPr), posteriorly. Anatomical tracers revealed connections to this region from cortical areas MI, SI, MRSS, PPR and the thalamic posterior nucleus. These results are consistent with previous work in ferrets as well as with the location, physiology and connectivity of area SIII in cats. Given its associations, functional properties, location and homology, it is proposed that this region represents the third cortical somatosensory area (SIII) in ferrets.
Keywords: Tactile, somatotopy, thalamus, homology, visual, parietal cortex
Introduction
The existence of multiple representations of a given sensory system in the neocortex is well-established, and has been found in all mammals investigated (Krubitzer 2007). For the somatosensory modality, at least six (areas 3a, 3b, 1, 2, parietal ventral area, SII) distinct regions have been mapped in the cortex of various primates (Kaas 1983; Kaas et. al. 1979; Krubitzer et. al. 1995; Nelson et. al. 1980), and five (SI, SII, SIII, SIV, SV) have been identified in cats (Adrian 1940; Clemo and Stein 1983; Haight 1972; Mori et. al. 1996; Woolsey 1943). The cortices of flying foxes and California ground squirrels have also been examined to reveal multiple somatosensory representations (Krubitzer and Calford 1992; Slutsky et. al. 2000). Rats and mice, with their characteristic barrel-field modification of the SI region, have been described as exhibiting at least two somatosensory cortical representations (Carvell and Simons 1986; Koralek et. al. 1990). Even marsupials, whose phylogeny diverged from the Eutherian line around 135 million years ago (Kirsch 1977), reveal evidence of multiple cortical somatosensory representations (Karlen and Krubitzer 2007). However, comparatively little has been done to explore the different somatosensory representations in ferrets, a species of carnivore whose neurobiology is being examined with increasing frequency. Previous work (Hunt et. al. 2000) suggested that the somatosensory organization of ferret cortex is similar to that of cats, but no firm homologies between cat and ferret somatosensory cortex were described. Electrophysiological studies in the ferret cortex identified the SI region on the ansate and lateral suprasylvian gyrus (Leclerc et. al. 1993; McLaughlin et. al. 1998; Rice et. al. 1993). Two to four distinct representations of the face were identified on the suprasylvian gyrus (Leclerc et. al. 1993; Rice et. al. 1993). However, the most posterior representation was characterized by comparatively larger receptive fields that repeated aspects of the more rostral vibrissa pad representation. The cytoarchitectonic examination of ferret somatosensory cortex by Rice et. al. (1993) found four distinct divisions along the suprasylvian gyrus and hypothesized that the most caudal region could be part of SIII, as also suggested by Hunt et al. (2000). Given the similarities in the receptive field properties and location of this region in ferrets and those of the third somatosensory area (SIII) in the cat (Garraghty et al., 1987), the present investigation sought to determine whether other homologies exist that would justify the designation of the region as SIII in ferret cortex
Materials and Methods
All procedures were performed in compliance with the Guide for Care and Use of Laboratory Animals (NIH publication 86-23) and the National Research Council’s Guidelines for Care and Use of Mammals in Neuroscience and Behavioral Research (2003) and approved by the Institutional Animal Care and Use Committee at Virginia at Virginia Commonwealth University.
Physiological Studies
Surgical Procedures
For electrophysiological recordings, ferrets (n=3) were anesthetized with sodium pentobarbital (45 mg/kg i.p.) and their heads were secured in a stereotaxic frame. Using aseptic surgical procedures, a craniotomy was made to expose the left suprasylvian gyrus. Over this opening a recording well/head supporting device was implanted using stainless steel screws and dental acrylic. The scalp was sutured closed around the implant and standard postoperative care was provided. Approximately 3–5 days elapsed before recordings were performed.
Electrophysiological Recording
For recording, a ferret was initially anesthetized with ketamine/dexmedetomidine (8mg/kg ketamine; .03mg/kg dexmedetomidine intramuscularly) then secured to a supporting bar via the implanted device. Supplemental anesthetics (8mg/kg ketamine; .03mg/kg dexmedetomidine intramuscularly) were administered approximately hourly, as needed. Animal temperature was maintained near 38°C with a circulating-water heating pad, and body temperature and heart rate were monitored continuously.
For recording, the well was opened to expose the cortical surface. Recordings were performed by inserting a glass-insulated tungsten electrode (tip exposure ~20µm, impedance<1MΩ) into the cortex then advancing the electrode to a depth (generally 750–850µm deep to the pial surface) that yielded vigorous neuronal activity. Neuronal discharges were amplified, displayed on an oscilloscope and played on an audio monitor. Once the electrode was in place, neuronal activity usually resembled 1–3 well-isolated units.
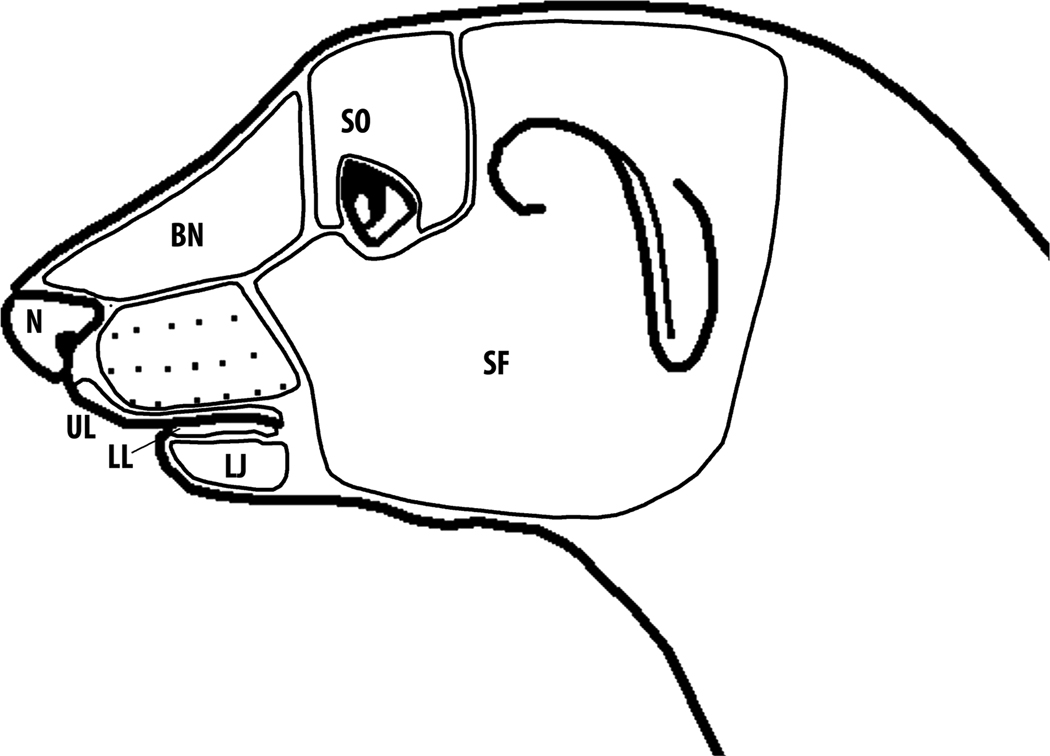
The location of each recording penetration was plotted onto a photograph of the cortical surface using vasculature and cortical landmarks. Somatosensory receptive fields were mapped using minimally effective stimuli (force thresholds determined using calibrated Semmes-Weinstein monofilaments) and graphically recorded on a scaled drawing of the ferret’s body surface. The surface of the head was dividedinto 11 areas (figure 1) (after (Leclerc et. al. 1993). Responsiveness to auditory stimulation was assessed using manually presented clicks, claps and whistles. Responsiveness to visual stimulation was tested using manually presented moving bars of light and dark. These were moving spots or bars of light from a hand-held ophthalmoscope, or dark stimuli from a rectangular piece of black cardboard. The activity evoked by sensory stimulation was classified as somatosensory, visual, (auditory was not observed), bimodal (somatosensory-visual), or unresponsive.
Figure 1.
Scheme used to name the regions of the ferret face/head for defining recorded somatosensory receptive fields (after Leclerc et al 1993). SF, side of face; SO, supraorbital area; BN, bridge of nose; N, nose; UL, upper lip; LL, lower lip; LJ, lower jaw. Although not depicted on this schematic, the vibrissa responses were subdivided as: superior (SV), inferior (IV), rostral (RV), caudal (CV), or all (AV) if the entire vibrissa pad was responsive.
Data Analysis
To enable visualization of the somatosensory representation in the cortex, the surface of the head was divided into 11 areas (figure 1) (after (Leclerc et. al. 1993) and receptive fields were designated according to those criteria. If a receptive field contained more than one of the defined subdivisions, it was assigned to the category that represented >50% of the receptive field. This receptive field was then plotted at the corresponding location of the recording penetration not as a point, but as a Voronoi plot constructed from the digital image of the penetrations using MapViewer 2.3(http://mapviewer.skynet.ie).
Anatomical Studies
Surgical Procedures
Ferrets (n=3) were anesthetized with sodium pentobarbital (45 mg/kg i.p.), their heads secured in a stereotaxic frame and, under aseptic conditions, a craniotomy was performed to expose the desired cortical area. Prior to tracer injections, recordings were made (same recording procedure as described above) to locate cortical sites which corresponded to the areas mapped in electrophysiological procedures. In one animal, an injection was made in a cortical site responsive to superior vibrissa stimulation. In two other animals, the sites were responsive to anterior vibrissa stimulation. Tracer injections consisted of a 10% mixture (in phosphate buffered saline) of 10,000 and 3,000 molecular weight biotinylated dextran amine (BDA; Invitrogen, Carlsbad CA) delivered iontophoretically through glass micropipettes with tip diameters between 20 and 40µm. The pipette was lowered to the desired depth (via hydraulic microdrive) under a continuous current of −2.75 µA to retain the BDA during pipette travel. Once a depth of 800µm was reached, positive current pulses (7s on, 7s off) of 6µA were delivered for 20 minutes. Following this, the current was switched off for ten minutes. During withdrawal of the pipette, continuous current of −2.75 µA was again used to prevent tracer leakage. The cortex was then covered with bone wax, the wound sutured closed, and standard postoperative care was provided. In three additional adult male ferrets, similar procedures were used to inject BDA tracer into SI cortex on the suprasylvian gyrus. SI cortex was identified using anatomical landmarks based on the work of Leclerc (1993) and Rice (1993). To ensure that injections did not produce label in the area we hypothesized to be SIII, they were made in a region of the suprasylvian gyrus that was in the coronal plane of the postcruciate sulcus which, by any of the cited maps, is clearly within S1.
Histological Procedures
Following a 10–14 day post-injection survival period, animals were given a sodium pentobarbital overdose and perfused intracardially with saline followed by 4.0% paraformaldehyde. The brains were blocked stereotaxically, removed and cryoprotected. Coronal sections (75µm thick) were cut serially using a freezing microtome. One series of sections from each animal (at 150 µm intervals) was processed for BDA visualization using the avidin-biotin peroxidase method, according to the protocol of Veenman (1992) and heavy-metal intensified. Reacted sections were mounted on standard chrome-alum gelatin pre-treated slides, dehydrated and coverslipped. An alternate series of sections was processed to visualize cytoarchitectonic features using the antibody SMI-32 to non-phosphorylated neurofilaments (van der Gucht et. al. 2001). Tissue from animals used in electrophysiological experiments was also reacted for SMI-32, an antibody that labels neurofilaments in dendrites, axons and cell bodies to aid in visualizing cytoarchitecture. In immunohistochemically processed cases, during the recording session, an electrolytic, locating lesion was made in the posterior penetrations (in a series) in which somatosensory responsiveness was no longer observed (corresponding to rostral parietal area PPr; (Manger et. al. 2002). This process provided an indicator of the tissue in which somatosensory responsiveness had been observed (e.g., anterior to the lesions) and, thereby, allowed the cytoarchitectonic (using SMI-32 staining) examination of the somatosensory region.
Data Analysis
Tissue processed for BDA was examined using a light microscope and the locations of labeled neurons were plotted using a PC-driven digitizing stage controlled by Neurolucida software (Microbrightfield Biosciences, Inc., Williston, VT). Each tissue section was traced showing its tissue outline, gray matter/white matter border, and the locations of labeled neurons. The injection site was defined as the region of densest label, usually at the end of the pipette track. BDA-labeled neurons generally were sharply black throughout their soma and dendrites. Plotted tissue sections from each case were digitally transferred to a graphics program and serially superimposed for final visualization and graphic display. Cytoarchitectonic features visualized using SMI-32 immunohistochemistry were plotted using a camera lucida and photographed.
Results
Sensory Responses of Suprasylvian Gyrus
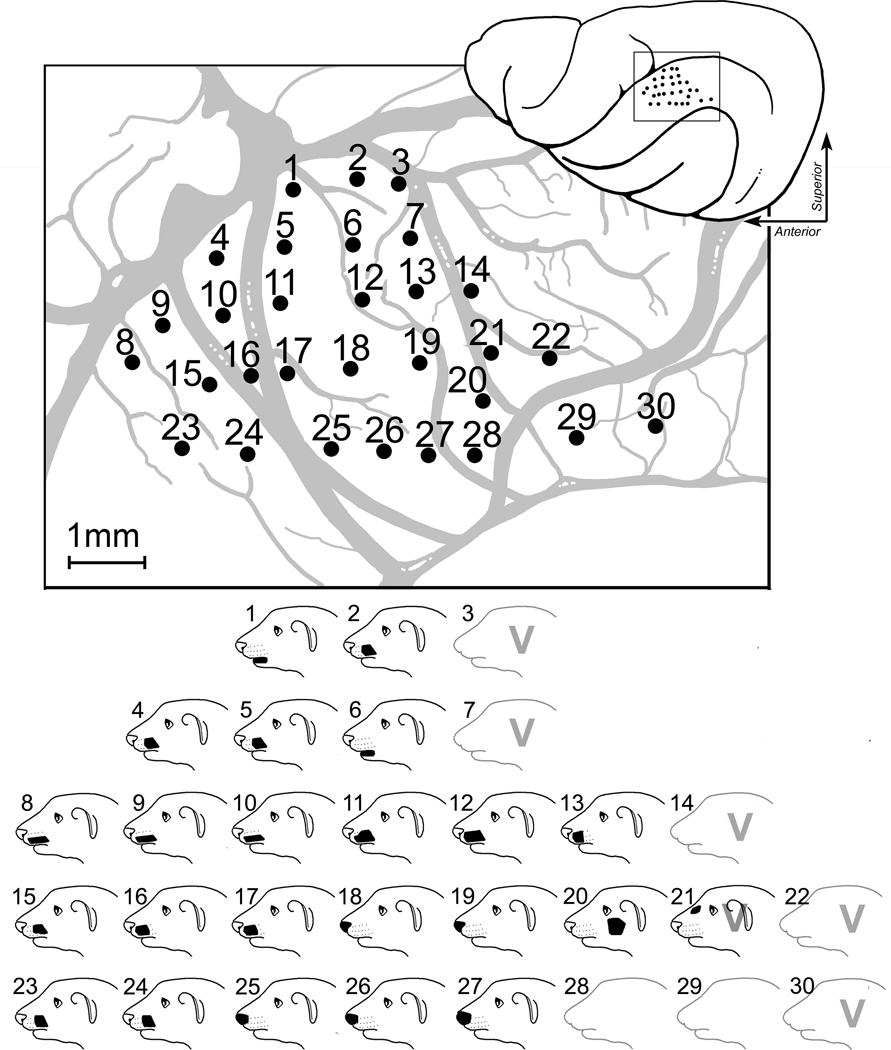
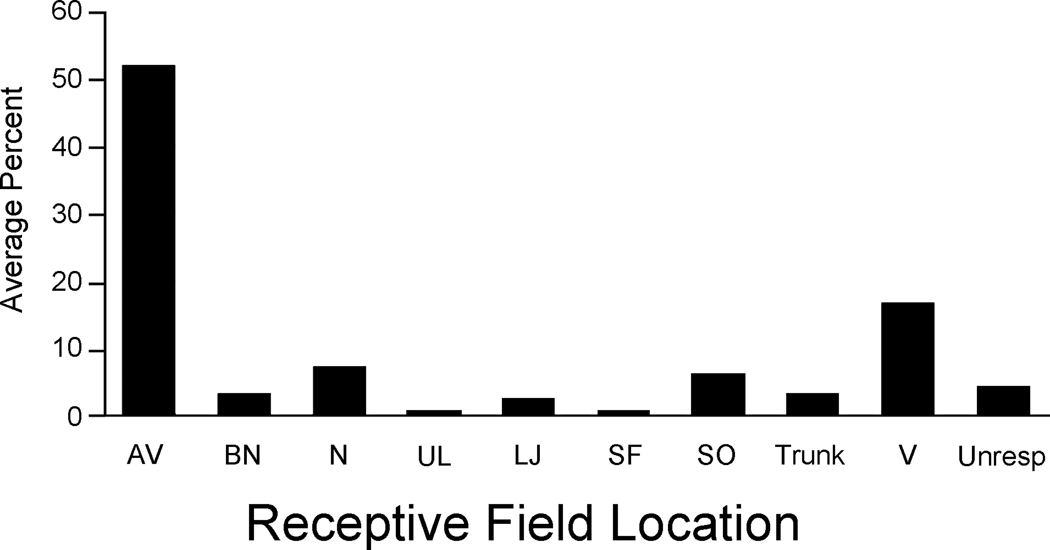
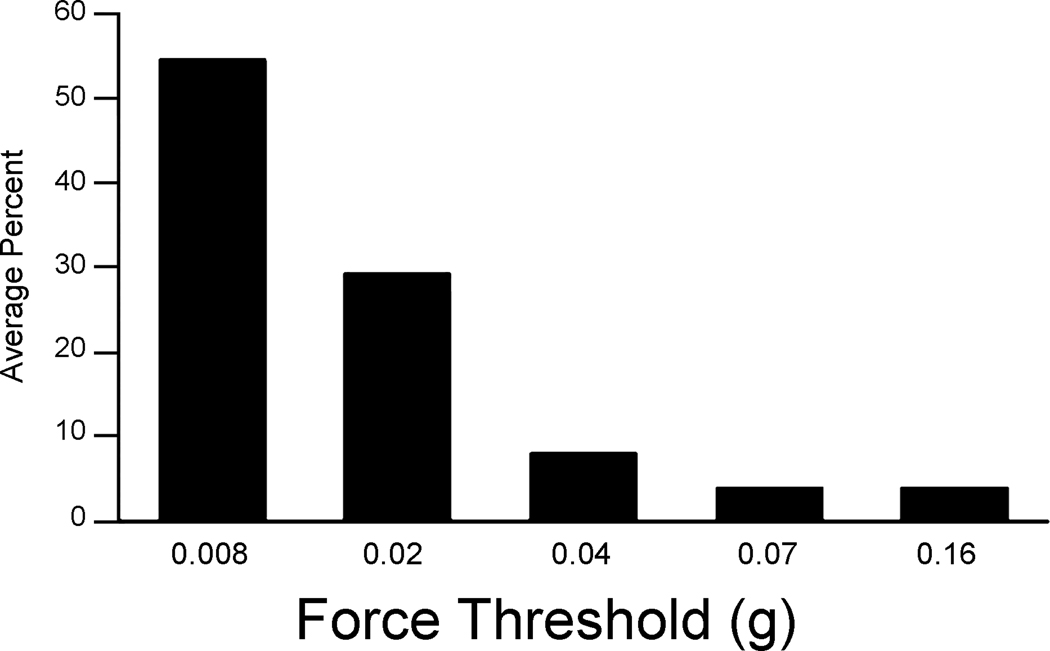
To explore the sensory features represented on the suprasylvian gyrus, extracellular recordings were performed in three adult male ferrets at 106 sites. Approximately 30 recording penetrations were performed per animal, as in the example shown in figure 2. Each penetration series began on the suprasylvian gyrus in a plane rostral to the ansate sulcus, and continued caudally until somatosensory responsiveness was lost. Most recording sites (78%) gave somatosensory responses, a few (5%) were unresponsive, and the remainder (17%) were visually responsive (figure 3). Visual responses were consistently encountered at the posterior-most recording sites, corresponding to the location of the rostral posterior parietal area (PPr, Manger et al., 2002) where bisensory responses (visual-somatosensory; n=4) were also encountered. For somatosensory-responsive neurons, receptive fields were almost exclusively found on aspects of the face, as illustrated in figure 2. Most somatosensory receptive fields (52%) included some aspect of the vibrissa, usually involving two or more whiskers but sometimes including the entire vibrissa pad. For the most part, the minimal effective somatosensory stimulus was very low intensity (figure 4), with 96% of somatosensory responses being driven by stimuli of less than 0.1 grams of force. All somatosensory responses were rapidly adapting. Although tested, none of the penetrations showed responses to auditory stimulation.
Figure 2.
Recording penetrations and the corresponding receptive fields from SIII cortex of an adult ferret. In the top right image, a dorsal view of the left hemisphere shows the location of the recording penetrations (1 dot = 1 penetration). Each penetration was plotted onto a photograph of the cortical surface using vasculature and cortical landmarks. In the middle image, the photograph used for mapping(not pictured) has been traced and magnified for visibility, and the recording sites numbered. Somatosensory receptive fields were assessed at each penetration (at a depth of ~750–800um), where visual/auditory responsiveness was also tested. The bottom image shows receptive fields mapped at sites with corresponding numbers. Somatosensory receptive fields are indicated by solid black shapes. Sites with visual responsiveness are indicated with a “V.” Unresponsive sites (28 and 29) are shown as an empty outline of the ferret face. Penetrations with bimodal responses (site 21) have somatosensory receptive fields mapped and also reliably responded to visual stimuli.
Figure 3.
Somatosensory receptive fields of SIII neurons generally included the vibrissa. The bar graph shows the incidence of occurrence of each of the designated regions of the head/face (conventions same as Figure 1) in the somatosensory receptive fields of SIII neurons.
Figure 4.
Force threshold for activation was very low for SIII neurons. Bars correspond with the proportion of recording sites responding with a specific force threshold (x-axis).
Somatotopic Organization
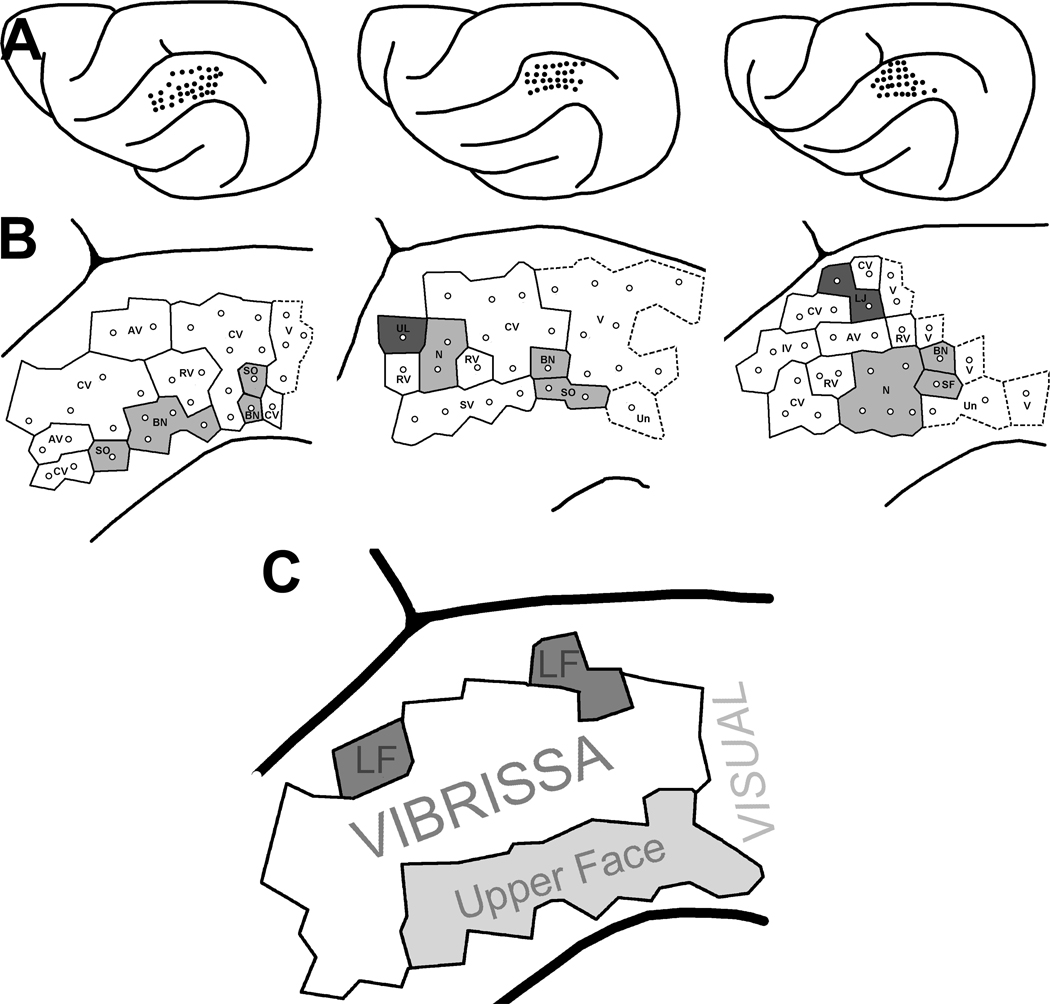
Somatotopy was difficult to discern in individual animals since receptive fields mostly included the vibrissa (see figure 2 for example RFs). However, when penetrations from all 3 animals were overlapped (figure 5), a general somatotopic trend became apparent. Areas closest to the dorsal midline were defined as “upper face,” which included the nose, bridge of nose and supraorbital areas; the “lower face” consisted of anything inferior to the vibrissa (the upper lip, lower lip and lower jaw). As presented in the bottom panel of figure 5, there was a general progression from the top to the bottom of the face as the recording locus moved from lateral to medial across the suprasylvian gyrus. Also consistent with a general somatotopy, five medial recording penetrations which travelled into the sulcus (into the lateral bank of the lateral sulcus; not depicted) continued the somatotopic pattern by exhibiting receptive fields on the neck and chest. Additionally, eight penetrations made into the lateral gyrus (unpublished data from another project) continued the general somatotopic pattern with receptive fields located on the hindlimb and forepaw. The face/head representation on the suprasylvian gyrus and body/limb representation on the lateral gyrus is consistent with the general somatotopic plan observed in ferret S1 (LeClerc et al., 1993; Rice et al., 1993). In the rostral-caudal dimension, however, a precise somatotopic pattern was not observed (see also figure 5).
Figure 5.
SIII recordings from 3 ferrets reveal a general somatotopic pattern. (Row A; top) Locations of electrode penetrations on the suprasylvian gyrus for each animal are shown of dorsal views of the recorded, left hemisphere. (Row B) Enlarged view of penetrations with Voronoi diagram and superimposed receptive fields (Conventions same as Figure 1). Dark shading indicates regions in the lower portion of the face; light shading indicates regions of the upper face; white represents any vibrissa. Dashed lines indicate unisensory visual responses or unresponsive penetrations. (Part C; bottom) A summary of three animals generated by overlapping the 3 plots depicted immediately above. This schematic indicates that the middle of the suprasylvian gyrus contains a representation of the vibrissa while the upper face is represented on the lateral portion of the gyrus and the lower face on the medial portion. Caudal to SIII is a region which is visually responsive, corresponding to PPr (Manger et al 2002).
Cytoarchitectonic Features
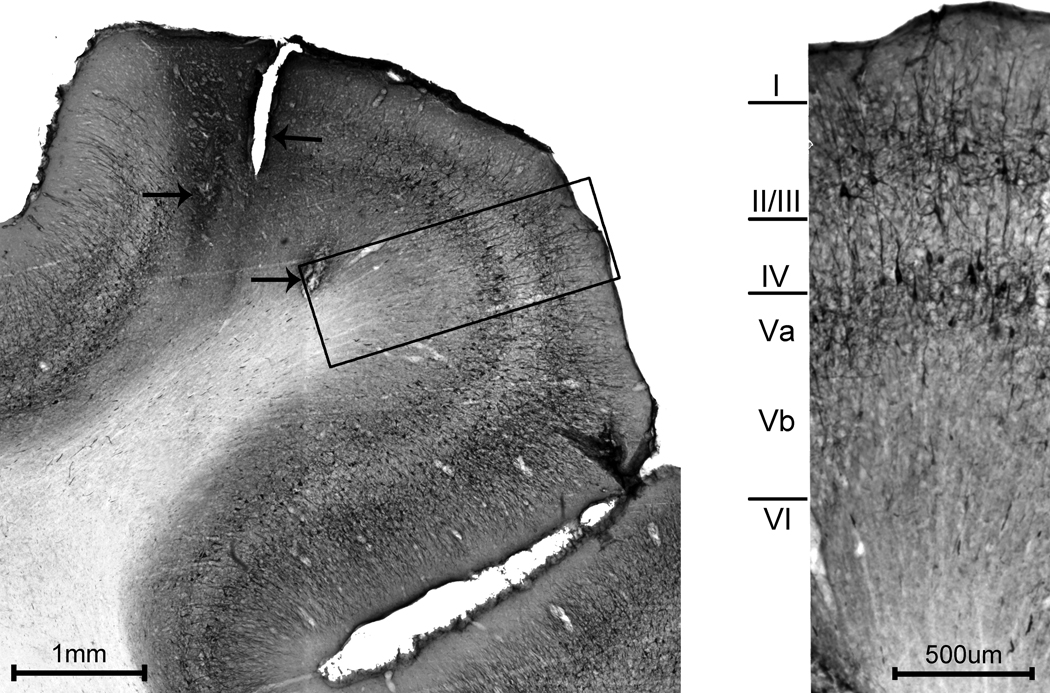
Electrolytic lesions were made in penetrations where responses transitioned from somatosensory to visual. Tissue anterior to the lesion sites, therefore, represented the somatosensory region explored and described above, and the corresponding cytoarchitectonic features were examined using SMI-32 immunostaining. The cytoarchitectonic and laminar features of this portion of the suprasylvian gyrus are shown in figure 6. In general, the infragranular layers were larger than the supragranular layers. Layer I was compact and mostly devoid of label. Upper layer II/III contained mostly vertically oriented fibers (perpendicular to the pial surface) and fewer horizontal fibers (parallel to the pial surface). Lower layer II/III contained small, darkly stained pyramidal cells as well as both vertically and horizontally oriented fibers. Layer IV exhibited sparse vertically oriented fibers which appeared to arise from other layers, but was otherwise mostly devoid of label. Upper layer V was easily distinguished, having many darkly stained pyramidal cells and short labeled fibers of varying orientations. Lower aspects of layer V displayed only light staining, but could be distinguished from laver VI by the presence of a few lightly stained cells and fibers. Layer VI was mostly unlabelled.
Figure 6.
Cytoarchitectonic organization of SIII. (Left) The photomicrograph shows a coronal section through the suprasylvian gyrus in the SIII region. The cytoarchitecture of SIII was examined in tissue from the somatosensory mapping experiments, and arrows point to damage from electrode penetrations in which somatosensory receptive fields were mapped. A portion of the section through the suprasylviangyrus (left, boxed area) is magnified (at Right) to reveal the laminar-specific staining. Layer I is thin and mostly devoid of label. Layers II/III contain a few, small, darkly stained pyramidal neurons and exhibit short stained fibers both parallel to and perpendicular to the pial surface. Layer IV is mostly devoid of label but demonstrates a few stained vertical fibers. Layers V-VI are relatively thick. Upper Layer V contains many darkly stained pyramidal cells with short labeled fibers of various orientations. Lower Layer V is comparatively light with few lightly stained fibers and cells while layer VI is mostly devoid of label.
Anatomical Connections
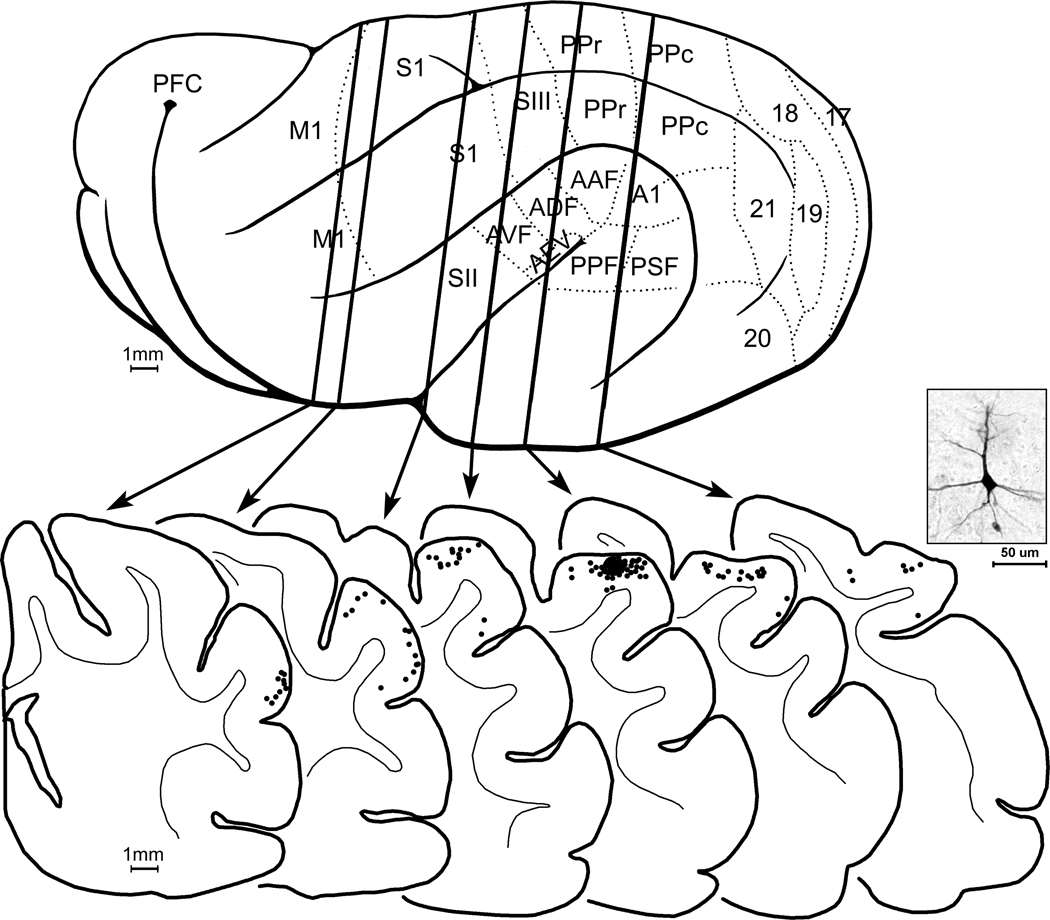
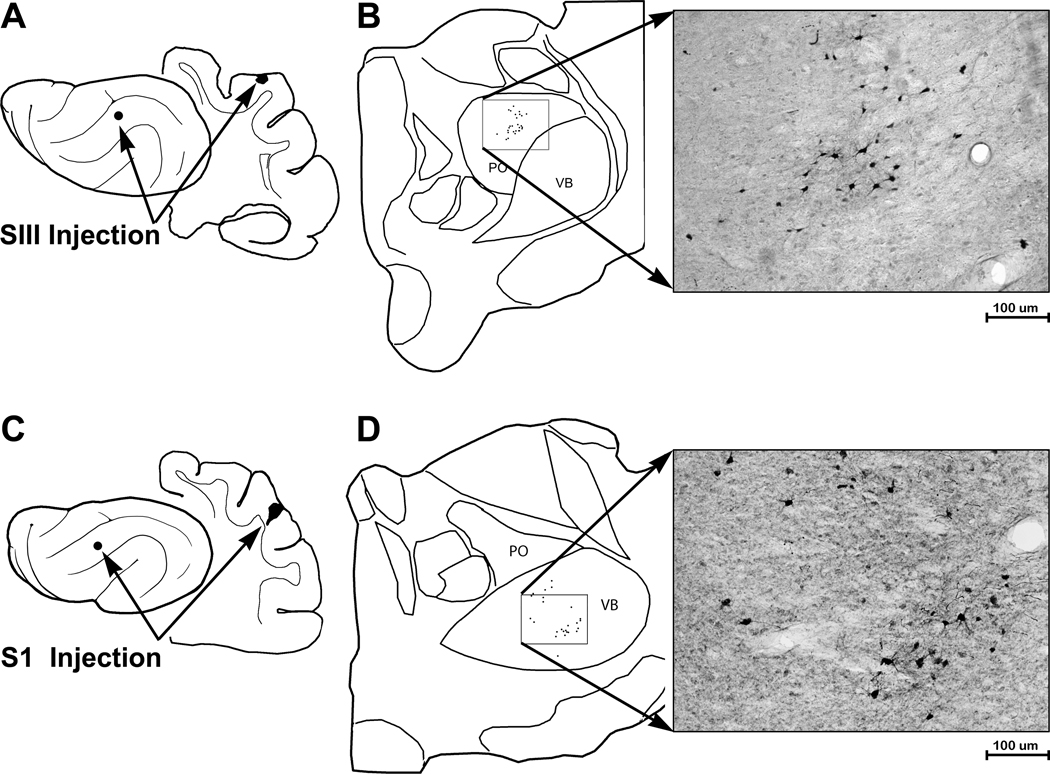
Under electrophysiological guidance, tracer (BDA) was injected (n=3 ferrets) into sites on the suprasylvian gyrus that exhibited the characteristic, vibrissa receptive fields. Injection sites were confined to the gyral grey matter with a diameter of ~700µm. Retrogradely labeled neurons were typically layer 2–3 pyramidal neurons, as depicted in the micrograph in figure 7. As summarized for one case by the serial coronal sections in figure 7, retrogradely labeled neurons were found anteriorly on the coronal gyrus and medial bank of the suprasylvian sulcus corresponding to MI, SI and MRSS and posteriorly, on the suprasylvian gyrus, largely corresponding to parietal area PPr. These same tracer injections also labeled distinct regions of thalamus, as shown in figure 8A–B. Darkly stained, retrogradely filled neurons, as well as axon terminals, were found in the posterior thalamic nuclei (PO), but not in the ventrobasal nucleus (VB). In contrast, in separate animals (n=3), injection of BDA tracer into S1 (figure 8C–D) labeled neurons and axon terminals in the ventrobasal nucleus (VB), but not PO.
Figure 7.
Projections to SIII demonstrated with tracer (BDA) injection. In (A), the lateral view of the hemisphere shows the known functional subdivisions (dotted lines). Vertical lines passing through the brain (TOP) correspond to the coronal sections s below. At bottom, the coronal sections are arranged serially (anterior=left) with the grey-white border of the cortical mantle indicated (thin line). The tracer was injected (black area) into the representation of the superior vibrissa recorded at that site. Each retrogradely labeled neuron (as shown in the example photomicrograph) was marked with a single black dot. Retrogradely labeled neurons are present in SI, MRSS, M1, and PPr, indicating the connectivity of these areas with SIII.
Figure 8.
Thalamic connections with SIII are different from those with S1. (A) The lateral view of the ferret cortex, and the coronal section, indicates the location of tracer injection into SIII. Part ‘B’ shows a tracing of thalamus with the subnuclei of posterior thalamic nucleus (PO) and ventrobasal nucleus (VB) outlined. For tracer injections into SIII, labeled neurons were identified and plotted in PO (boxed area), which is enlarged in the photomicrograph of labeled neurons in. Part ‘C’ illustrates the injection site in S1 on lateral and coronal views of the brain. Part ‘D’ shows a tracing of thalamus with the subnuclei of posterior thalamic nucleus (PO) and ventrobasal nucleus (VB) outlined. For tracer injections into SI, labeled neurons were identified in VB (boxed area), which is enlarged in the photomicrograph of labeled neurons.
Discussion
The data presented herein documents the somatotopic representation of the face on the suprasylvian gyrus between S1, anteriorly, and area PPr, posteriorly. Tracer injections into this region demonstrated afferent connections from cortical areas SI, MRSS, M1and PPr, as well as from the posterior nucleus of the thalamus. Collectively, these observations provide further evidence that the examined somatosensory region is distinct from SI (see below) and, given its homologies with that of cat SIII (see below), should be designated as SIII in the ferret.
Distinctions from SI
Previous work by Rice et al. 1993) in ferret found four cytoarchitectonic divisions of somatosensory cortex along the suprasylvian gyrus and hypothesized that the most caudal region (dubbed P14) could be part of SIII, based on its similar location in cat cortex. Leclerc et. al. (1993) found that this region (dubbed C2 in electrophysiological mapping experiments) had larger receptive fields than those observed at more rostral recording sites in SI. The present study is consonant with these earlier works. Furthermore, tracer injection into SI revealed strong and nearly exclusive connectivity with the ventrobasal complex of the thalamus, whereas injections into SIII labeled neurons in the posterior nucleus of the thalamus.
Cat SIII and ferret SIII homology
The somatosensory region designated SIII has been described in cat cortex (Darian-Smith et. al. 1966; Garraghty et. al. 1987) and resides in the ansate sulcus and on the rostral aspect of the suprasylvian gyrus between SI, anteriorly, and parietal area 5, posteriorly. This region contains a somatotopically organized representation of the cat’s entire body surface, with the head represented medial and the trunk/hindlimb representation lateral (Garraghty et. al. 1987). For head and forelimb representations, there was a receptive field reversal as recording sites crossed the SI-SIII border, where SIII receptive fields also generally increased in size (Garraghty et. al. 1987). Posteriorly, the caudal border of SIII was consistently characterized by the abrupt cessation of responses to tactile stimulation (Garraghty et. al. 1987). Corticocortical connectivity of cat SIII includes inputs from somatosensory areas SI, SII and SIV as well as from M1, while thalamocortical projections arise primarily from the posterior thalamic nucleus (Garraghty et. al. 1987).
Likewise, in ferret cortex, somatosensory responsivity posterior to SI has been noted by several studies (Rice et al. 1993; Hunt et al., 2000) where receptive fields were comparatively larger than in SI (Rice et al., 1993; present study). Further posterior along the suprasylvian gyrus, a sharp transition occurred where somatosensory activity ceased and robust visual responsivity was observed corresponding to the rostral posterior parietal area (Manger et. al. 2002). Thus, in terms of location and function, area SIII appears to be homologous in ferret and cat. Furthermore, the present study identified cortical inputs to SIII that arose from somatosensory areas SI and MRSS and M1 motor cortex, as well as thalamocortical connections to SIII from the posterior thalamic nucleus (PO). These connectional features of ferret SIII are essentially the same as those identified for area SIII of cats (Garraghty et. al. 1987).
The present study has identified features of ferret SIII that appear to differ from those reported for cat SIII. Most striking is the difference in orientation of the somatotopy of the regions. Although the entire body surface was not examined in the ferret, its representation presents the top of the head most laterally with more ventral and posterior aspects of the body medial. In contrast, the somatotopy in cat SIII shows the head medial and the representation of the trunk/hindlimbs lateral (Garraghty et. al. 1987). However, it should be noted that the mapping of sound frequencies in auditory cortex is rotated in ferret 90° from the well-known tonotopy seen in cat (Reale and Imig 1980). Together, these observations suggest that local, species-specific arrangements have occurred within the general pattern of their sensory representation distribution. In addition, the present study identified projections to SIII from PPr, that presumably represent feedback connections from visual-somatosensory bimodal neurons in the parietal area. These apparent crossmodal connections have not been examined in cats.
Relationships with other cortical fields
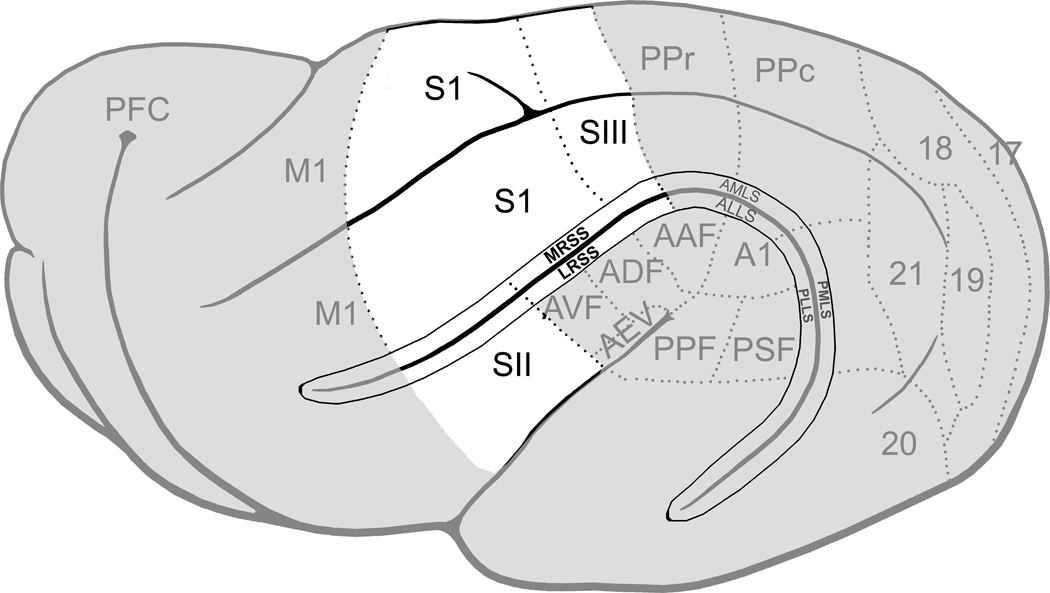
Illustrations in recent studies of ferret cortex would give the impression that SIII is already a well established fact. However, most publications that directly examined the features of this somatosensory region (Hunt et. al. 2000; Leclerc et. al. 1993; Rice et. al. 1993) were reluctant to designate the region as SIII. Probably as a consequence, subsequent studies that have relied on the earlier descriptions have depicted SIII in various distributions in relation to their work on adjoining cortical fields (e.g., Figure 1,(Bizley et. al. 2007); Figure 1,(Manger et. al. 2005); Figure 1–2,(Manger et. al. 2002)). The present study indicates that SIII occupies the full medial-lateral extent of the suprasylvian gyrus between SI (anteriorly) and PPr (posteriorly), as depicted in Figure 9. Although we did not examine the representation on the lateral gyrus in detail, eight penetrations as well as previous reports (Leclerc et al., 1993; Rice et al., 1993) indicate that the SIII representation continues at this location. Another point of ambiguity in ferret cortex is the presence and location of somatosensory area SII. Preliminary results from our lab indicate somatosensory responsivity in the region anterior to the anteroventral auditory field (AVF; (Bizley et. al. 2005) and the AEV (Manger et. al. 2005). Given the correspondence of this somatosensory location with that of SII in the cat (Burton and Kopf 1984), it seems logical to suspect this location to contain the ferret SII representation, as illustrated in figure 9 (see also (Manger et. al. 2005). Furthermore, this portion of the anterior ectosylvian gyrus shows topographic connections with SI (unpublished data) much like SII does in the cat. Other ferret somatosensory regions have been described by Keniston et al., (2009) as the medial rostral suprasylvian area (MRSS) and by Keniston et al., (2008) as the lateral rostral suprasylvian area (LRSS). Like the other representations on or near the suprasylvian sulcus, these regions primarily represent the ferret head and face. However, the anterior borders of nearly all of these ferret somatosensory regions, along with the M1 domain, remain to be mapped. Accordingly, more attention needs to be directed toward elucidating the multiple somatosensory representations, as well as their connectional and hierarchical relationships, in ferret cortex.
Figure 9. Summary of ferret cortical representations.
On this lateral view of the ferret cerebral cortex (left hemisphere; anterior=left), the known somatosensory regions are highlighted in white. The borders of functional subdivisions are represented by the dotted lines. Abbreviations: S1, somatosensory area 1; SII, somatosensory area 2; SIII, somatosensory area 3; MRSS, medial rostral suprasylvian sulcus; LRSS, lateral rostral suprasylvian sulcus.
Acknowledgements
We thank Dr. H. R. Clemo for her review of this manuscript. Supported by NIH Grant NS 039460.
Abbreviations Table
- AV
all vibrissa
- BN
bridge of nose
- CV
caudal vibrissa
- IV
inferior vibrissa
- LJ
lower jaw
- LL
lower lip
- LRSS
lateral rostral suprasylvian sulcus
- MRSS
medial rostral suprasylvian sulcus
- N
nose
- PO
posterior thalamic nucleus
- PPr
posterior parietal rostral
- RV
rostral vibrissa
- SF
side of face
- SI
somatosensory area 1
- SII
somatosensory area 2
- SIII
somatosensory area 3
- SO
supraorbital area
- SV
superior vibrissa
- UL
upper lip
- V
visual
- VB
ventrobasal nucleus of thalamus
Footnotes
Declaration of interest: The authors report no conflicts of interest. The authors alone are responsible for the content and writing of the paper.
Literature Cited
- Adrian ED. Double representation of the feet in the sensory cortex of the cat. J Physiol. 1940;98:16. [Google Scholar]
- Bizley JK, Nodal FR, Bajo VM, Nelken I, King AJ. Physiological and anatomical evidence for multisensory interactions in auditory cortex. Cereb Cortex. 2007;17:2172–2189. doi: 10.1093/cercor/bhl128. [DOI] [PMC free article] [PubMed] [Google Scholar]
- Bizley JK, Nodal FR, Nelken I, King AJ. Functional organization of ferret auditory cortex. Cereb Cortex. 2005;15:1637–1653. doi: 10.1093/cercor/bhi042. [DOI] [PubMed] [Google Scholar]
- Burton H, Kopf EM. Ipsilateral cortical connections from the second and fourth somatic sensory areas in the cat. J Comp Neurol. 1984;225:527–553. doi: 10.1002/cne.902250405. [DOI] [PubMed] [Google Scholar]
- Carvell GE, Simons DJ. Somatotopic organization of the second somatosensory area (SII) in the cerebral cortex of the mouse. Somatosens Res. 1986;3:213–237. doi: 10.3109/07367228609144585. [DOI] [PubMed] [Google Scholar]
- Clemo HR, Stein BE. Organization of a fourth somatosensory area of cortex in cat. J Neurophysiol. 1983;50:910–925. doi: 10.1152/jn.1983.50.4.910. [DOI] [PubMed] [Google Scholar]
- Darian-Smith I, Isbister J, Mok H, Yokota T. Somatic sensory cortical projection areas excited y tactile stimulation of the cat: a triple representation. J Physiol. 1966;182:671–689. doi: 10.1113/jphysiol.1966.sp007844. [DOI] [PMC free article] [PubMed] [Google Scholar]
- Garraghty PE, Pons TP, Huerta MF, Kaas JH. Somatotopic organization of the third somatosensory area (SIII) in cats. Somatosens Res. 1987;4:333–357. doi: 10.3109/07367228709144613. [DOI] [PubMed] [Google Scholar]
- Haight JR. The general organization of somatotopic projections to SII cerebral neocortex in the cat. Brain Res. 1972;44:483–502. doi: 10.1016/0006-8993(72)90315-0. [DOI] [PubMed] [Google Scholar]
- Hunt DL, Slutsky DA, Krubitzer LA. The organization of somatosensory cortex in the ferret. 2000 Neuroscience Meeting Planner. SFN Abstract. 2000:243.13. [Google Scholar]
- Kaas JH. What, if anything, is SI? Organization of first somatosensory area of cortex. Physiol Rev. 1983;63:206–231. doi: 10.1152/physrev.1983.63.1.206. [DOI] [PubMed] [Google Scholar]
- Kaas JH, Nelson RJ, Sur M, Lin CS, Merzenich MM. Multiple representations of the body within the primary somatosensory cortex of primates. Science. 1979;204:521–523. doi: 10.1126/science.107591. [DOI] [PubMed] [Google Scholar]
- Karlen SJ, Krubitzer L. The functional and anatomical organization of marsupial neocortex: evidence for parallel evolution across mammals. Prog Neurobiol. 2007;82:122–141. doi: 10.1016/j.pneurobio.2007.03.003. [DOI] [PMC free article] [PubMed] [Google Scholar]
- Keniston L. The rostral suprasylvian sulcus (rsss) of the ferret: a ‘new’ multisensory area. 2008 Neuroscience Meeting Planner. SFN Abstract. 2008:457.10/DD34. [Google Scholar]
- Keniston LP, Allman BL, Meredith MA, Clemo HR. Somatosensory and multisensory properties of the medial bank of the ferret rostral suprasylvian sulcus. Exp Brain Res. 2009;196:239–251. doi: 10.1007/s00221-009-1843-0. [DOI] [PMC free article] [PubMed] [Google Scholar]
- Kirsch JAW. The classification of marsupials. New York: Academic Press; 1977. pp. 1–50. [Google Scholar]
- Koralek KA, Olavarria J, Killackey HP. Areal and laminar organization of corticocortical projections in the rat somatosensory cortex. J Comp Neurol. 1990;299:133–150. doi: 10.1002/cne.902990202. [DOI] [PubMed] [Google Scholar]
- Krubitzer L. The magnificent compromise: cortical field evolution in mammals. Neuron. 2007;56:201–208. doi: 10.1016/j.neuron.2007.10.002. [DOI] [PubMed] [Google Scholar]
- Krubitzer L, Clarey J, Tweedale R, Elston G, Calford M. A redefinition of somatosensory areas in the lateral sulcus of macaque monkeys. J Neurosci. 1995;15:3821–3839. doi: 10.1523/JNEUROSCI.15-05-03821.1995. [DOI] [PMC free article] [PubMed] [Google Scholar]
- Krubitzer LA, Calford MB. Five topographically organized fields in the somatosensory cortex of the flying fox: microelectrode maps, myeloarchitecture, and cortical modules. J Comp Neurol. 1992;317:1–30. doi: 10.1002/cne.903170102. [DOI] [PubMed] [Google Scholar]
- Leclerc SS, Rice FL, Dykes RW, Pourmoghadam K, Gomez CM. Electrophysiological examination of the representation of the face in the suprasylvian gyrus of the ferret: a correlative study with cytoarchitecture. Somatosens Mot Res. 1993;10:133–159. doi: 10.3109/08990229309028829. [DOI] [PubMed] [Google Scholar]
- Manger PR, Engler G, Moll CK, Engel AK. The anterior ectosylvian visual area of the ferret: a homologue for an enigmatic visual cortical area of the cat? Eur J Neurosci. 2005;22:706–714. doi: 10.1111/j.1460-9568.2005.04246.x. [DOI] [PubMed] [Google Scholar]
- Manger PR, Masiello I, Innocenti GM. Areal organization of the posterior parietal cortex of the ferret (Mustela putorius) Cereb Cortex. 2002;12:1280–1297. doi: 10.1093/cercor/12.12.1280. [DOI] [PubMed] [Google Scholar]
- McLaughlin DF, Sonty RV, Juliano SL. Organization of the forepaw representation in ferret somatosensory cortex. Somatosens Mot Res. 1998;15:253–268. doi: 10.1080/08990229870673. [DOI] [PubMed] [Google Scholar]
- Mori A, Fuwa T, Kawai A, Yoshimoto T, Hiraba Y, Uchiyama Y, Minejima T. The ipsilateral and contralateral connections of the fifth somatosensory area (SV) in the cat cerebral cortex. Neuroreport. 1996;7:2385–2387. doi: 10.1097/00001756-199610020-00021. [DOI] [PubMed] [Google Scholar]
- Nelson RJ, Sur M, Felleman DJ, Kaas JH. Representations of the body surface in postcentral parietal cortex of Macaca fascicularis. J Comp Neurol. 1980;192:611–643. doi: 10.1002/cne.901920402. [DOI] [PubMed] [Google Scholar]
- Reale RA, Imig TJ. Tonotopic organization in auditory cortex of the cat. J Comp Neurol. 1980;192:265–291. doi: 10.1002/cne.901920207. [DOI] [PubMed] [Google Scholar]
- Rice FL, Gomez CM, Leclerc SS, Dykes RW, Moon JS, Pourmoghadam K. Cytoarchitecture of the ferret suprasylvian gyrus correlated with areas containing multiunit responses elicited by stimulation of the face. Somatosens Mot Res. 1993;10:161–188. doi: 10.3109/08990229309028830. [DOI] [PubMed] [Google Scholar]
- Slutsky DA, Manger PR, Krubitzer L. Multiple somatosensory areas in the anterior parietal cortex of the California ground squirrel (Spermophilus beecheyii) J Comp Neurol. 2000;416:521–539. doi: 10.1002/(sici)1096-9861(20000124)416:4<521::aid-cne8>3.0.co;2-#. [DOI] [PubMed] [Google Scholar]
- van der Gucht E, Vandesande F, Arckens L. Neurofilament protein: a selective marker for the architectonic parcellation of the visual cortex in adult cat brain. J Comp Neurol. 2001;441:345–368. doi: 10.1002/cne.1416. [DOI] [PubMed] [Google Scholar]
- Veenman CL, Reiner A, Honig MG. Biotinylated dextran amine as an anterograde tracer for single- and double-labeling studies. J Neurosci Methods. 1992;41:239–254. doi: 10.1016/0165-0270(92)90089-v. [DOI] [PubMed] [Google Scholar]
- Woolsey CN. "Second" somatic receiving areas in the cerebral cortex of cat, dog and monkey. Fed Proc. 1943;2 [PubMed] [Google Scholar]


