

Background: microRNA-99a markedly decreases in HCC.
Results: microRNA-99a expression correlates with HCC patients' survival, and microRNA-99a restoration suppresses HCC growth in vitro and in vivo by targeting IGF-1R and mTOR.
Conclusions: microRNA-99a could be prognosis predictor and tumor suppressor for HCC.
Significance: Reveal the important role of microRNA-99a in HCC development and provide prognosis predictor and therapeutic approach for HCC.
Keywords: Cell Cycle, Cell Growth, Hepatocellular Carcinoma, microRNA, Tumor Therapy
Abstract
In our in-depth analysis carried out by the Illumina Solexa massive parallel signature sequencing, microRNA-99a (miR-99a) was found to be the sixth abundant microRNA in the miRNome of normal human liver but was markedly down-regulated in hepatocellular carcinoma (HCC). Compelling evidence has suggested the important roles of microRNAs in HCC development. However, the biological function of miR-99a deregulation in HCC remains unknown. In this study, we found that miR-99a was remarkably decreased in HCC tissues and cell lines. Importantly, lower miR-99a expression in HCC tissues significantly correlated with shorter survival of HCC patients, and miR-99a was identified to be an independent predictor for the prognosis of HCC patients. Furthermore, restoration of miR-99a dramatically suppressed HCC cell growth in vitro by inducing the G1 phase cell cycle arrest. Intratumoral injection of cholesterol-conjugated miR-99a mimics significantly inhibited tumor growth and reduced the α-fetoprotein level in HCC-bearing nude mice. Insulin-like growth factor 1 receptor (IGF-1R) and mammalian target of rapamycin (mTOR) were further characterized as the direct targets of miR-99a. Furthermore, protein levels of IGF-1R and mTOR were found to be inversely correlated with miR-99a expression in HCC tissues. miR-99a mimics inhibited IGF-1R and mTOR pathways and subsequently suppressed expression of cell cycle-related proteins, including cyclin D1 in HCC cells. Conclusively, miR-99a expression was frequently down-regulated in HCC tissues and correlates with the prognosis of HCC patients, thus proposing miR-99a as a prospective prognosis predictor of HCC. miR-99a suppresses HCC growth by inducing cell cycle arrest, suggesting miR-99a as potential tumor suppressor for HCC therapeutics.
Introduction
The microRNAs (miRNAs)3 are a class of highly conserved short noncoding RNAs, which suppress protein expression by inhibiting translation or inducing mRNA degradation by binding to the 3′-untranslational region (3′UTR) of target mRNAs (1). Beyond the involvement in diverse biological processes, it has been well demonstrated that deregulation or dysfunction of miRNAs can contribute to cancer development (2). As one of the most fatal cancers worldwide, hepatocellular carcinoma (HCC) is one of the leading causes for cancer-related death (3). Besides multiple genetic and epigenetic changes of protein-coding genes in HCC (4), growing evidence indicates that deregulation of miRNAs can also contribute to HCC development by influencing cell growth, apoptosis, migration, or invasion (5–22). Thus, more extensive investigations are needed to identify miRNAs that can be employed as prognosis predictor or therapeutic target for HCC.
In our study, high throughput in-depth sequencing was used to identify the miRNomes of normal human liver and HCC. This in-depth analysis not only reveals the differentially expressed miRNAs but also the abundance of individual miRNA in the entire miRNome. We found that nine miRNAs accounted for nearly 90% of the miRNome in normal human liver. Listed in order of abundance, they were miR-122, miR-192, miR-199a/b-3p, miR-101, let-7a, miR-99a, let-7c, let-7b, and let-7f. As shown in our previous study (23), miR-199a/b-3p and miR-99a were markedly and consistently decreased in HCC, whereas miR-122/let-7 members decreased not as consistently as miR-199a/b-3p and miR-99a, and miR-192/miR-101 seemed to show no change in HCC samples. Because of the important role that miR-199a/b-3p plays in HCC, as revealed in our previous work (23), the study of miR-99a's function seemed attractive. Down-regulation of miR-99a has been reported in several human cancers (24–29), suggesting the important roles of miR-99a in cancer development. As the sixth most abundant miRNA in normal human liver but dramatically and consistently decreased in HCC, miR-99a may contribute to the development of HCC and may be a prognosis predictor of HCC.
However, to date, the role of miR-99a in HCC development remains unknown. Here, we investigated the roles of miR-99a in HCC development and the underlying mechanisms. We found that lower miR-99a expression in HCC tissues correlated with a worse prognosis for HCC patients. Furthermore, restored miR-99a expression in HCC suppressed cell growth both in vivo and in vitro, and insulin-like growth factor 1 receptor (IGF-1R) and mammalian target of rapamycin (mTOR) were found to be involved as direct targets of miR-99a. Therefore, our findings demonstrate that miR-99a can act as a prospective prognosis predictor for HCC patients and, as a suppressor of HCC, is a new potential therapeutic target for HCC.
EXPERIMENTAL PROCEDURES
Human Tissue Specimens
Liver tissue samples were obtained from patients undergoing resection, and the relevant characteristics of the studied subjects are shown in supplemental Table 1. Tissue samples were immediately frozen in liquid nitrogen until analysis. Normal human liver tissues were obtained from distal normal liver tissue of liver hemangioma. HBV-infected liver tissues and severe chronic hepatitis B liver tissues were obtained from distal liver tissue of liver hemangioma patients with HBV infection or severe chronic hepatitis B. HCC samples and matched controls were obtained form HCC patients. Informed consent was obtained from each patient, and the study was approved by the Ethics Committee of Second Military Medical University, Shanghai, China.
Cell Lines and Reagents
Human HCC cell lines HepG2, SMMC-7721, and Huh7 were maintained in DMEM with 10% FBS (PAA Laboratories, Pasching, Australia). Human liver cell line HL-7702 was maintained in RPMI 1640 medium with 10% FBS (PAA Laboratories, Pasching, Australia). Antibodies specific to phospho-p70S6K, phospho-4E-BP1, 4E-BP1, mTOR, cyclin D1, cyclin D3, and cyclin E were from Cell Signaling Technology (Danvers, MA). Antibodies specific to IGF-1R, p70S6K, and fibroblast growth factor receptor 3 (FGFR3) were from Bioworld (Nanjing, China). Antibodies specific to β-actin were from Sigma. Agarose was from Lonza (Basel, Switzerland). The miR-99a inhibitor and inhibitor negative control were from Dharmacon (ThermoFisher Scientific).
Illumina Solexa Massive Parallel Signature Sequencing
Total RNA, containing miRNA, was extracted using miRNeasy mini kit (Qiagen, Germany) and passed the RNA quality control for Solexa sequencing. The sequencing procedure was described previously (30). Sequencing data were mainly analyzed using the short oligonucleotide alignment program as described previously (23).
RNA Quantification
Real time qRT-PCR assay was performed as described previously (23). The primers used are shown in supplemental Table 2. Expression of miR-99a was detected with miRCURY LNA Universal RT microRNA PCR kit (Exigon, Boston) according to the manufacturer's instructions.
Cell Transfection
miR-99a duplex mimics and negative control (NC) were from Genepharma (Shanghai, China). Cells were transfected with 50 nm RNA duplex using INTERFERin (Polyplus-transfection, Illkirch, France), according to the manufacturer's instructions.
Vector Construction and Luciferase Reporter Assay
The 3′UTR fragments of IGF-1R, mTOR, FGFR3, frizzled homolog 5 (Drosophila) (FZD5), and frizzled homolog 8 (Drosophila) (FZD8) containing putative binding sites for miR-99a were cloned into pMIR-Report construct (Ambion, Austin, TX). The primers used are shown in supplemental Table 2. Mutant 3′UTRs of IGF-1R and mTOR, which carried a mutated sequence in the complementary site for the seed region of miR-99a, were generated using the fusion PCR method. Luciferase reporter assay was performed in HepG2 cells as described previously (23).
EdU Incorporation Assay
Cell proliferation was assessed by Cell-Light EdU DNA cell proliferation kit (RiboBio, Guangzhou, China), according to the manufacturer's instructions.
MTT Assay
Cells (5000) were seeded into 96-well plate and transfected with miR-99a mimics or NC. MTT assay for cell growth was performed as described previously (23).
Clonogenicity Analysis
Cells (5000) suspended in 1 ml of 0.3% top agarose were plated onto 2 ml of 0.6% base agarose in 6-well plates and maintained for 15 days. Complete medium (500 μl) was added every 5 days. Colonies were counted and photographed by light microscopy on the indicated day.
Cell Synchronization and Cell Cycle Analysis
Cells were synchronized by serum deprivation for 48 h (Huh7 cells) or double thymidine block (HepG2 and SMMC-7721 cells). For double thymidine block, cells were cultured in complete medium containing 30 nm thymidine for 16 h. Cells were then washed twice with serum-free medium and incubated for 12 h in thymidine-free complete medium. A second thymidine block was performed by adding serum-free medium containing 30 nm thymidine for another 16 h. Then the cells were washed twice with serum-free medium and released into complete medium. Cell cycle was analyzed as described previously (23).
Western Blot
Cells or liver tissues were harvested, lysed, and blotted as described previously (23). For detecting IGF-1R and mTOR, electrophoresis was performed with 7.5% NEXT GEL (AMRESCO, Solon, OH). Protein bands were quantified for Pearson's correlation coefficient analysis using LabWorks Image Acquisition and Analysis Software (UVP LLC, San Jose, CA).
HCC-bearing Nude Mouse Model and in Vivo Treatment
The HCC-bearing nude mouse model (SMMC-LTNM) was prepared by transplanting histologically intact fresh human HCC tissues to form a subcutaneous transplantation tumor in nude mice and was maintained with a continuous subcutaneous passage. For preparation of subcutaneous HCC-bearing mouse model, 0.2 ml of ground SMMC-LTNM tumor tissues were subcutaneously injected and inoculated (23). Cholesterol-conjugated miR-99a mimics and negative control for in vivo RNA delivery were from RiboBio (Guangzhou, China). RNA (10 nmol) in 0.1 ml of saline buffer was locally injected into the tumor mass every 3 days for 2 weeks. Tumor size was measured as described previously (23). Serum α-fetoprotein (AFP) was examined using ELISA (Autobio, Zhengzhou, China). All experiments were performed in accordance with the Guide for the Care and Use of Laboratory Animals (National Institutes of Health publication 80-23, revised 1996), with the approval of the Scientific Investigation Board of Second Military Medical University, Shanghai, China.
Statistical Analysis
Data are presented as the mean ± S.D. from at least three independent experiments. Unless indicated otherwise, the differences between groups were analyzed using two-tailed Student's t test when only two groups were compared. Kaplan-Meier survival curves, Cox proportional hazards regression analysis, and two-tailed Pearson's correlation coefficient analysis were performed using SPSS software (version 17.0). All values of p < 0.05 are marked with an asterisk and values of p < 0.01 with two asterisks.
RESULTS
miR-99a Is the Sixth Abundant miRNA in Normal Human Liver and Is Frequently Decreased in HCC Tissue
In our previous study, the abundance of individual miRNA in normal human liver and HCC was revealed by deep sequencing using Illumina Solexa massive parallel signature sequencing, and all the sequencing data have been uploaded to GEO (accession GSE21279) (23). We found that the expression of nine miRNAs accounted for ∼88.2% of the miRNome in normal human liver, and miR-99a was the sixth abundant miRNA (Fig. 1A). miR-99b, another member of miR-99 family, was poorly expressed in normal human liver and only accounted for 0.0072%.
FIGURE 1.

Illumina Solexa massive parallel signature sequencing analysis of miRNomes in normal human liver, hepatitis liver, and HCC. A, most abundantly expressed miRNAs in normal human liver. The Illumina Solexa massive parallel signature sequencing was applied to carry out an in-depth analysis of the miRNomes in normal liver tissues (n = 3) obtained from patients undergoing resection (distal normal liver tissue of liver hemangioma). Average ratio of indicated miRNAs in normal liver samples is shown. B, abundance of miR-99a in the miRNomes of HCC and matched non-neoplastic liver tissues. Percentages of miR-99a in miRNome of different tissues are shown as indicated. Normal human liver tissues are shown as the same as A.
The sequencing data also showed that miR-99a was significantly down-regulated in HCC tissues compared with matched controls and normal human liver, which seemed independent of HBV or hepatitis C virus infection (Fig. 1B). These results were further confirmed by qRT-PCR analysis in 40 HBV-related HCC, five hepatitis C virus-related HCC, and three HCC of other etiologies, in which miR-99a was markedly decreased (over a 1-fold decrement) in 85% (34/40) HBV-related HCC samples and in all the other detected HCC samples, compared with matched controls. Down-regulation of miR-99a was also found in all five HCC cell lines analyzed by qRT-PCR analysis (supplemental Fig. 1). These results suggest that reduced miR-99a expression is a frequent event in human HCC tissue.
Lower miR-99a Expression Level in HCC Tissue Correlates with Worse Prognosis of HCC Patients
To investigate whether down-regulation of miR-99a in HCC tissue correlated with clinical features or prognosis of HCC patients, a total of 142 HCC patients who had undergone tumor resection between year 2002 and 2006 were analyzed by qRT-PCR analysis (supplemental Table 1). As shown in Fig. 2, statistical analysis with the Kaplan-Meier method revealed that lower miR-99a expression levels in HCC tissues significantly correlated with reduced disease-free survival (DFS) of HCC patients (p = 0.011). To exclude other factors affecting the DFS, we further employed Cox proportional hazards regression analysis. Univariate analysis was among the first conducted to identify those factors that might affect the DFS, followed by multivariate analysis, which controlled for potential confounders (Table 1). Significantly, multivariate analysis confirmed that lower miR-99a expression level is an independent predictor for shorter DFS of HCC patients (p = 0.033), as shown in Table 1. Collectively, the above data indicate that reduced miR-99a may contribute to the development of HCC and may be a prognosis predictor of HCC patients.
FIGURE 2.
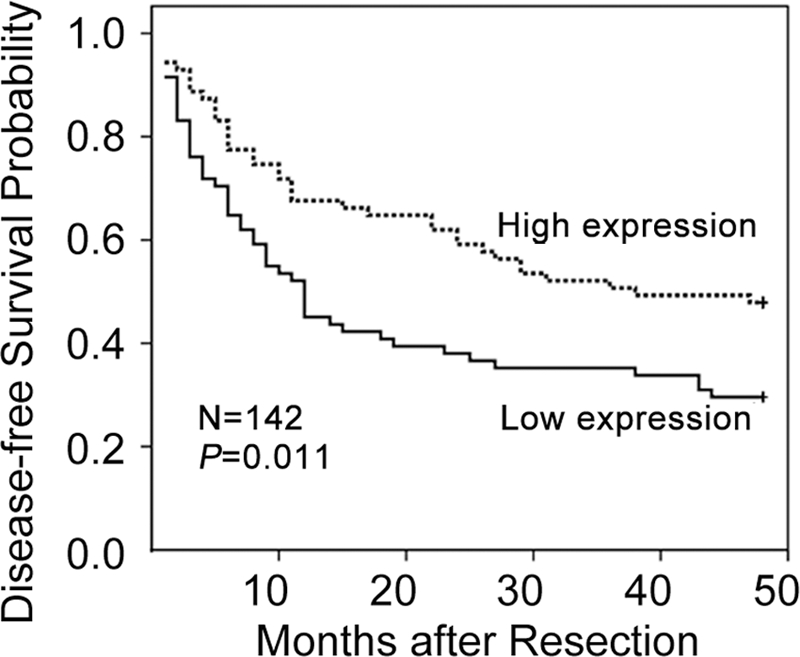
Lower miR-99a expression in HCC tissues correlates with poorer survival of HCC patients. DFS of HCC patients was analyzed by Kaplan-Meier analysis in SPSS 17.0. p value was given by a log-rank test. The mature miR-99a level was assessed by qRT-PCR, and its median value of all 142 cases was chosen as the cutoff point for separating miR-99a high expression tumors (n = 71) from miR-99a low expression cases (n = 71).
TABLE 1.
Univariate and multivariate analysis of factors correlated with disease-free survival of HCC patients
Analysis was conducted on 142 HCC patients. Hazard ratios (95% confidence interval) and p values were calculated using univariate or multivariate Cox proportional hazards regression in SPSS 17.0. The following abbreviations are used: CI, confidence interval; HR, hazard ratio; TNM, tumor node metastasis.
| Clinical variables | Case no. | HR (95% CI) | p value |
|---|---|---|---|
| Univariate analysis | |||
| miR-99a (lower versus relatively higher)a | 71/71 | 1.7 (1.1–2.6) | 0.014 |
| Sex (male versus female) | 127/15 | 0.8 (0.4–1.6) | 0.616 |
| Age (>50 versus 50 years) | 64/78 | 1.1 (0.7–1.6) | 0.796 |
| HBV (positive versus negative) | 127/15 | 1.5 (0.7–3.3) | 0.281 |
| Cirrhosis (yes versus no) | 103/39 | 1.4 (0.8–2.3) | 0.207 |
| AFP (500 versus <500 ng/ml) | 55/87 | 1.2 (0.8–1.8) | 0.426 |
| Tumor size (5 versus <5 cm) | 74/68 | 2.4 (1.6–3.8) | <0.001 |
| Tumor no. (>1 versus 1) | 31/111 | 3.3 (2.1–5.2) | <0.001 |
| Portal vein tumor thrombus (yes versus no) | 22/120 | 8.8 (4.9–15.8) | <0.001 |
| TNM stage (II/III versus I) | 73/69 | 2.8 (1.8–4.3) | <0.001 |
| Histological grade (>II versus I/II) | 78/64 | 1.3 (0.8–1.9) | 0.273 |
| Multivariate analysis | |||
| miR-99a (lower versus relatively higher) | 71/71 | 1.6 (1.0–2.5) | 0.033 |
| Tumor size (5 versus <5 cm) | 74/68 | 0.9 (0.3–2.3) | 0.761 |
| Tumor no. (>1 versus 1) | 31/111 | 2.5 (1.6–4.1) | <0.001 |
| Portal vein tumor thrombus (yes versus no) | 22/120 | 6.5 (3.5–11.8) | <0.001 |
| TNM stage (II/III versus I) | 73/69 | 2.6 (1.0–7.0) | 0.058 |
a The median value of all 142 samples was chosen for the cutoff point as described in Fig. 2.
miR-99a Inhibits HCC Cell Growth in Vitro
The repressed expression of miR-99a in HCC prompted us to investigate whether miR-99a functions as a tumor suppressor. As mentioned above, miR-99a was remarkably decreased in HCC cell lines (supplemental Fig. 1). First, on the basis of the observation that transfection of miR-99a could restore its expression in HCC cells (Fig. 3A and supplemental Fig. 2), we evaluated the effect of miR-99a restoration on proliferation of HCC cells. HepG2, SMMC-7721, and Huh7 cells were transfected with miR-99a or NC duplex. As shown in Fig. 3, B and C, reduced EdU high population was detected by EdU incorporation assay in miR-99a-restored HCC cells, compared with their NC control. MTT assay also confirmed that proliferation of HCC cells was suppressed by miR-99a restoration (Fig. 3D).
FIGURE 3.

miR-99a suppresses HCC cell proliferation in vitro. HepG2, SMMC-7721, and Huh7 HCC cells were transfected with miR-99a or NC mimics. A, miR-99a expression in normal human liver tissue and transfected cell lines was analyzed by real time qRT-PCR 72 h after transfection. The normalized miR-99a expression in normal human liver tissue in each experiment was set as relative 1. B–D, proliferating capability of transfected cells was evaluated using EdU incorporation (B and C) or MTT assay (D) in the indicated time periods after transfection. The EdU high population detected by FACS in B was calculated and shown in C. Data are shown as mean ± S.D. (n = 4) of one representative experiment. Similar results were obtained in at least three independent experiments. *, p < 0.05; **, p < 0.01 for miR-99a versus NC transfectants.
We further investigated the effect of miR-99a restoration on clonogenicity of HCC cell lines, including HepG2, SMMC-7721, and Huh7, which were transfected with an miR-99a or NC duplex. Compared with NC transfectants, miR-99a-restored HCC cells displayed notably fewer and smaller colonies (Fig. 4).
FIGURE 4.

miR-99a inhibits HCC cell clonogenicity in vitro. HepG2, SMMC-7721, and Huh7 HCC cells were transfected with miR-99a or NC mimics and allowed to grow on agar at very low cell density 24 h after transfection. A–C, colonies were photographed by light microscopy 15 days later. D, colonies were counted as shown. Data are shown as mean ± S.D. (n = 4) of one representative experiment. Similar results were obtained in at least three independent experiments. *, p < 0.05; **, p < 0.01 for miR-99a versus NC transfectants.
miR-99a Suppresses HCC Growth in Vivo
A human HCC-bearing nude mouse model SMMC-LTNM (23) was employed to identify the in vivo effect of miR-99a on HCC growth. Compared with other human HCC-bearing nude mouse models generated by subcutaneously inoculating with HCC cell lines, SMMC-LTNM is more similar to clinical progression of HCC as a local invasion, and pulmonary metastasis is identified. Also, AFP is detected with a high level in sera of SMMC-LTNM model. The expression of miR-99a was also much lower in SMMC-LTNM tumor tissue compared with normal human liver. In vivo intratumoral injection of cholesterol-conjugated miR-99a mimics restored its expression in tumor tissue (Fig. 5A). After intratumoral administration of the cholesterol-conjugated miR-99a mimics, a significant reduction in tumor size (Fig. 5, B and C) and decrease of serum AFP (Fig. 5D) were observed in SMMC-LTNM mice, further confirming a potential suppressive effect of miR-99a on HCC growth. Taken together, we may identify miR-99a as a potential suppressor of HCC both in vitro and in vivo.
FIGURE 5.

miR-99a suppresses HCC growth in vivo. A, real time qRT-PCR analysis of miR-99a expression in normal human liver tissue or SMMC-LTNM tumor tissue 72 h after intratumoral injection of cholesterol-conjugated miR-99a or NC mimics. The normalized miR-99a expression in normal human liver tissue in each experiment was set as relative 1. B–D, effect of miR-99a restoration on tumor growth in HCC-bearing nude mice SMMC-LTNM. Two weeks after subcutaneous inoculation of SMMC-LTNM tumor mass, HCC-bearing nude mice were treated by intratumoral injection of cholesterol-conjugated miR-99a mimics, NC mimics, or PBS. Photographs of dissected tumors (B), tumor growth (C), and serum AFP levels (D) are shown. Data are shown as mean ± S.D. (n = 4) of one representative experiment. Similar results were obtained in three independent experiments. **, p < 0.01.
miR-99a Blocks Cell Cycle at G1/S Transition to Repress HCC Growth
To reveal mechanisms underlying this growth inhibitory effect of miR-99a, subsequential investigations on cell cycle progression were performed. HepG2, SMMC-7721, and Huh7 cells were transfected with miR-99a or NC duplex and then synchronized. After release from synchronization, a larger proportion of NC transfected cells, but not miR-99a transfected cells, entered S-phase at the indicated time points (Fig. 6, A–C). As shown in Fig. 6D, marked accumulation of the G1 population in miR-99a-restored cells suggested that miR-99a could block the G1/S transition. Additionally, restoration of miR-99a could hardly influence apoptosis and metastasis of these HCC cell lines (data not shown). Therefore, we conclude that restoration of miR-99a in HCC represses HCC growth through blocking G1/S transition.
FIGURE 6.

Restoration of miR-99a arrests HCC cell cycle progression. A–C, cell cycle analysis by FACS. After transfecting with miR-99a mimics or NC, HCC cells were synchronized by double thymidine block (HepG2 and SMMC-7721) or serum deprivation (Huh7). The released HepG2 (A), SMMC-7721 (B), and Huh7 (C) cells were harvested at the indicated time points. The time point when thymidine was removed, or serum re-added, was set as 0 h. D, G1 population was analyzed and calculated at 3 h (HepG2, SMMC-7721) or 9 h (Huh7) by FACS. Data are shown as mean ± S.D. (n = 4) of one representative experiment. Similar results were obtained in at least three independent experiments. *, p < 0.05; **, p < 0.01.
miR-99a Directly Targets IGF-1R and mTOR and Inversely Correlates with Protein Levels of IGF-1R and mTOR in HCC Tissue
Hundreds of predicted target genes of miR-99a were retrieved from the TargetScan database. To explore the molecular mechanisms underlying the function of miR-99a observed above, these predicted targets were subjected to enrichment analysis of cell signaling pathways using Kyoto Encyclopedia of Genes and Genomes (KEGG) pathway database (31). Pathways in cancer (map05200) significantly enriched nine predicted targets (p = 0.015), which was more than other signaling pathways (supplemental Table 3). IGF-1R, mTOR, FGFR3, FZD5, and FZD8 were all five conserved targets out of the nine. Those five targets were also predicted in miRanda (32).
To identify the targets of miR-99a, luciferase reporter plasmids containing wild-type or mutant 3′UTR of the putative target genes were constructed (supplemental Fig. 3), and a dual luciferase reporter gene assay was employed. Co-transfection of miR-99a mimics significantly reduced luciferase activity of the IGF-1R and mTOR reporter with wild-type 3′UTR but not that of their mutants (Fig. 7A). No change of luciferase activity was observed following the co-transfection of miR-99a and reporters with 3′UTR of FZD5 or FZD8 (supplemental Fig. 4A). These data suggest that miR-99a may suppress gene expression by directly binding to the 3′UTR of IGF-1R and mTOR. Furthermore, protein levels of IGF-1R and mTOR were reduced by miR-99a restoration in the three HCC cell lines HepG2, SMMC-7721, Huh7, and SMMC-LTNM tumor mass (Fig. 7B). The protein levels of IGF-1R and mTOR could be partially up-regulated after knocking down miR-99a expression with inhibitor in the normal human liver cell line HL-7702 (supplemental Fig. 5). The level of miR-99a in normal human liver cell line HL-7702, which supposed to be high, was nearly two times that in HCC cell lines but was still far lower than that in normal liver tissues (supplemental Fig. 1). Thus, because of the low level of miR-99a, basal protein levels of IGF-1R/mTOR could be high in HL-7702 cells, which can hardly been further increased by a wide margin with miR-99a knockdown. A previous report showed that FGFR3 was also a direct target of miR-99a in bladder cancer (27), but we found that it was only moderately regulated by miR-99a expression in HCC cell line HepG2 (supplemental Fig. 4, A and B).
FIGURE 7.

miR-99a directly targets IGF-1R and mTOR. A, analysis of luciferase activity. HepG2 cells were co-transfected with indicated RNA duplex, pRL-TK, and pMIR-Report firefly luciferase reporter plasmid containing wild-type (Wt) or mutant 3′-UTR (Mut) of putative target gene. Firefly luciferase activity was measured and normalized by Renilla luciferase activity 24 h after transfection. The normalized luciferase activity of NC transfectant in each experiment was set as relative luciferase activity 1. Data are shown as mean ± S.D. (n = 4) of one representative experiment. Similar results were obtained in at least three independent experiments. **, p < 0.01. B, restoration of miR-99a diminishes the endogenous IGF-1R and mTOR protein levels. IGF-1R and mTOR expression was analyzed by Western blotting in HepG2/SMMC-7721/Huh7 cells 60 h after transfection with miR-99a mimics or NC or in SMMC-LTNM tumor mass 2 weeks after intratumoral injection of cholesterol-conjugated miR-99a mimics or NC mimics. C, inverse correlation between miR-99a expression and IGF-1R/mTOR protein levels in HCC tissues (n = 20). Expression of mTOR and IGF-1R examined by Western blotting was densitometrically quantified as described and normalized to β-actin expression. miR-99a expression was detected by qRT-PCR analysis and normalized to U6 expression. Statistical analysis was performed using Pearson's correlation coefficient. Normalized miR-99a expression level and IGF-1R/mTOR protein levels were shown as standardized values calculated in SPSS 17.0. D--F, effects of miR-99a restoration on the activation of IGF-1R/mTOR signaling pathways. D, 28 h after transfection with miR-99a or NC duplex, and another 24 h of serum deprivation, protein levels of IGF-1R/mTOR and phosphorylation of p70S6K/4E-BP1 in HepG2 cells were analyzed by Western blotting at the indicated time points. The time points when serum was re-added was set as 0 h. E, 2 weeks after subcutaneous inoculation of SMMC-LTNM tumor mass, HCC-bearing nude mice were treated by intratumoral injection of cholesterol-conjugated miR-99a mimics or NC mimics for another 2 weeks. The phosphorylation of p70S6K and 4E-BP1 in the indicated tumor mass was analyzed by Western blotting. F, cyclin D1, cyclin D3, and cyclin E were detected by Western blotting in HepG2 cells 72 h after transfection with indicated RNA duplex.
Next, we explored the correlation between miR-99a expression level and protein levels of IGF-1R or mTOR in HCC tissues. After normalization, RNA levels of miR-99a and protein levels of IGF-1R or mTOR were analyzed by Pearson's correlation coefficient analysis (SPSS 17.0). Markedly, IGF-1R and mTOR protein levels were both inversely correlated with the miR-99a expression level in HCC tissues (Fig. 7C). Collectively, these results imply that endogenous levels of IGF-1R and mTOR in liver tissues can be negatively regulated by miR-99a.
IGF-1R and mTOR Are Involved in miR-99a-regulated G1/S Transition
To evaluate whether IGF-1R and mTOR are involved in miR-99a-induced G1 arrest, downstream pathways of them were investigated after restoration of miR-99a in HepG2 cells. We detected the phosphorylation status of ribosomal protein S6 kinase, 70 kDa (p70S6K), and eukaryotic translation initiation factor 4E-binding protein 1 (4E-BP1), downstream substrates of IGF-1R-mTOR pathway (33). Impaired phosphorylations of p70S6K and 4E-BP1 were observed in miR-99a-restored HepG2 cells and SMMC-LTNM tumor mass (Fig. 7, D and E), which halted the activation of sequential signaling cascades involved in the synthesis of several G1/S transition-related molecules (34–36). Attenuated expression of cyclin D1, cyclin D3, and cyclin E was detected in miR-99a-restored HepG2 cells (Fig. 7F), which may be due to impaired phosphorylation of p70S6K and 4E-BP1. This can contribute to the inhibition of G1/S transition in HCC cells, and miR-99a may inhibit HCC growth via targeting IGF-1R/mTOR pathways.
DISCUSSION
Until now, dozens of miRNAs have been suggested to play important roles in HCC development (5–22), which may function alone or in a cooperative manner for HCC development. Thus, exploring and understanding the more aberrantly expressed miRNAs may help to better reveal the mechanisms underlying HCC carcinogenesis and progression. In this study, miR-99a, the sixth most abundant miRNA in normal human liver, was found to be dramatically decreased in HCC, and more importantly, its down-regulation significantly correlated with the poorer prognosis of patients with HCC. Down-regulation of miR-99a in HCC has been described in a couple of microarray results, but its abundance in human normal liver has not been reported yet. The suppressive effect of miR-99a on HCC growth was demonstrated both in in vitro and in vivo experiments. Furthermore, IGF-1R and mTOR were characterized as direct targets of miR-99a, which exerted function of miR-99a as a cell cycle progression inhibitor. Our results suggest that miR-99a may be a new prognosis predictor as well as a potential therapeutic target for HCC.
Expression of miR-99 has been proved frequently repressed in various tumors, including squamous cell carcinoma of tongue (24), lung cancer (25), serous ovarian carcinoma (26), bladder cancer (27), childhood adrenocortical tumors (28), and prostate cancer (29), but the mechanisms responsible for its down-regulation in tumors are still unknown. As reported previously, deregulated expression of microRNA could be affected by epigenetic mechanisms (DNA methylation and histone modification) (37, 38), chromosome deficiency or duplication (38, 39), abnormal transcription factors (38, 40, 41), and disordered microRNA maturation (42, 43). The expression of well known tumor suppressors miR-34a and miR-34b/c was directly up-regulated by p53, which may mediate induction of apoptosis, cell cycle arrest, and senescence by p53 (40). Loss of function of p53 in some tumors might result in down-regulation of miR-34a and miR-34b/c. Additionally, the promoters of the miR-34a and the miR-34b/c genes were frequently inactivated by CpG methylation in some tumor types, and miR-34a resided on 1p36, which was commonly deleted in neuroblastomas. These all contribute to the loss of miR-34 expression. A GC polymorphism was reported to be located on the precursor of miR-146a, another well known tumor suppressor, which could alter mature miR-146a expression, and was associated with risk for cervical cancer and adult glioma (42, 43). To illuminate the mechanisms contributing to down-regulation of miR-99a in HCC, we computationally mapped CpG islands upstream of the miR-99a gene, but no CpG-enriched region had been found. It offered little evidence for DNA methylation but still a chance for histone modification of the miR-99a gene. However, the gene encoding miR-99a was found residing within an intron of C21orf34. C21orf34 is located in chromosome 21q21, the region reported harboring a putative tumor suppressor gene in lung cancer (25). Intriguingly, we found positive correlations within RNA levels of mature miR-99a, primary miR-99a, and their host gene C21orf34 in HCC tissues (supplemental Fig. 6). This result suggests that miR-99a may be co-transcripted with C21orf34, and reduced miR-99a expression seems less likely due to dysfunction of the maturation process from primary to mature miRNA. We also analyzed possible transcription factors binding 3 kb upstream of the miR-99a gene and C21orf34, which were Evi-1, STATx, NKx2.5, c-Rel, and Elk-1. Those may help to address further studies in the future.
A total of 142 HCC patients were studied for relationships between reduced expression of miR-99a and prognosis of HCC patients, and a lower miR-99a expression level was identified to significantly correlate with shorter DFS. Cox proportional hazards regression analysis further confirmed miR-99a to be an independent predictor. Although combined down-regulation of 19 miRNAs, including miR-99a, had been described to be correlated with shorter HCC survival time (44), here, we demonstrate for the first time the individual lower miR-99a expression in HCC tissues significantly correlated with shorter survival of HCC patients, and down-regulated miR-99a was confirmed as an independent predictor for poorer prognosis of HCC patients. As reported previously, abnormal expressions of miR-122, miR-26, miR-29, and miR-139 also correlate with the prognosis of HCC patients (12, 14, 45, 46). Hence, we propose that the combined detection on levels of these miRNA in HCC, including miR-99a, may help to identify the prognosis of HCC patients more precisely.
With informatics prediction and sequential experimental demonstration, IGF-1R and mTOR were identified as direct targets of miR-99a in our study. mTOR signaling pathway can be activated following upstream activation of receptors to multiple extracellular signals, including IGF-1R, and plays a key role in cell growth, protein translation, metabolism, cell invasion, and apoptosis (33, 34). Either enhanced upstream signals because of overexpressed IGF-1R or the overexpression of mTOR itself may strengthen the signals passed down by mTOR, which will cause over-phosphorylation of the downstream molecules p70S6K and 4E-BP1. Once phosphorylated, p70S6K and 4E-BP1 can promote protein synthesis. Thus, several cell cycle-related proteins (34–36), including cyclin D1, cyclin D3, and cyclin E, will be excessively up-regulated, which resulted in the promotion of HCC growth. As compelling evidence revealed, IGF-1R and mTOR are pivotal genes involved in various types of tumors, including HCC, in which their overexpression correlates with poor prognosis (47–49). But the underlying mechanisms remain to be fully understood. Interestingly, this correlation between overexpression of IGF-1R or mTOR and the poor prognosis are consistent with our findings that reduced miR-99a correlates with poor survival of HCC patients. Furthermore, we identified an inverse correlation between miR-99a expression and IGF-1R or mTOR protein level in human HCC tissues. All these may confirm the relevance between miR-99a and IGF-1R or mTOR and suggest miR-99a as at least one of the mechanisms used for elucidating the obscure mechanism underlying IGF-1R and mTOR overexpression in HCC, as well as in other tumors.
While this manuscript was in preparation, miR-100 and miR-99a were reported to be down-regulated in childhood adrenocortical tumors (28) and prostate cancer (29); however, observations or studies on the phenomena caused by this down-regulation were not further investigated. IGF-1R and mTOR were identified as targets of miR-100 in childhood adrenocortical tumors but left miR-99a unvalidated experimentally. mTOR was demonstrated as a target of miR-99a in prostate cancer, without exploring the in vivo effects in animal models or the clinical significance of miR-99a. miR-100 shares the same seed sequence with miR-99a. Compared with miR-99a, however, miR-100 is poorly expressed in normal human liver, only accounting for 0.36% of miRNome (23). Hence, it seems that miR-99a maybe more crucial for liver biology and HCC development. Furthermore, a single miRNA has been thought to target multiple mRNAs, named “targetome,” to regulate gene expression (14). So, we are aware that other molecules or signaling pathways affected by miR-99a could also be involved in HCC pathogenesis, and some of them may be still unstudied in HCC. This presumption may encourage future work to reveal the entire functions of miR-99a in HCC carcinogenesis and progression.
As one of the most fatal cancers around the world, HCC confers a poor prognosis when diagnosed at advanced stages when curative therapies are no longer possible. Multidrug resistance transporter proteins and hyper-activated drug-metabolizing pathways may contribute to this diminished efficacy. More alternative approaches are therefore urgently needed for efficacious and nontoxic therapeutic regimens. As shown in our study, for its notable antitumor effects both in vitro and in vivo after restoration, miR-99a might be employed in HCC therapy. Compared with other organs or tissues, liver can be more easily targeted by both viral and nonviral delivery systems for genes and small molecules (50), and in vivo delivery of miR-99a may provide a special class of drugs to repress HCC growth. Also, viral and nonviral vectors are being developed for optimized delivery of synthetic or expressed RNA to liver (51–53). Hence, restoration of miR-99a could have considerable potential for HCC gene therapy.
To sum up, by investigating the potential role of miR-99a in cell cycle control and tumor progression, we highlight miR-99a as a prognosis predictor, and restoration of miR-99a could be a prospective therapeutic approach for HCC.
Supplementary Material
Acknowledgments
We appreciate the help from Maoshan Chen (Beijing Genomics Institute (BGI), Shenzhen) on informatics analysis. We also thank Dr. Minggang Zhang, Yan Gu, Shuo Ye, and Chaofeng Han, for helpful discussions and Panpan Ma, Mei Jin, and Yan Li for technical assistance.
This work was supported by National 125 Key Project Grant 2012ZX10002-014, National Key Basic Research Program of China Grant 2012CB518903, National High Biotechnology Development Program of China Grant 2009ZX09503-003, National Natural Science Foundation of China Grant 31170826, and Shanghai Committee of Science and Technology Grant 10DZ1910300.

The on-line version of this article (available at http://www.jbc.org) contains supplemental Tables 1–3 and Figs. 1–6.
- miRNA
- microRNA
- HCC
- hepatocellular carcinoma
- mTOR
- mammalian target of rapamycin
- qRT
- quantitative RT
- AFP
- α-fetoprotein
- DFS
- disease-free survival
- HBV
- hepatitis B virus
- NC
- negative control
- MTT
- 3-(4,5-dimethylthiazol-2-yl)-2,5-diphenyltetrazolium bromide
- EdU
- 5-ethynyl-2′-deoxyuridine.
REFERENCES
- 1. Ambros V. (2004) Nature 431, 350–355 [DOI] [PubMed] [Google Scholar]
- 2. Garzon R., Calin G. A., Croce C. M. (2009) Annu. Rev. Med. 60, 167–179 [DOI] [PubMed] [Google Scholar]
- 3. Jemal A., Siegel R., Ward E., Hao Y., Xu J., Thun M. J. (2009) CA Cancer J. Clin. 59, 225–249 [DOI] [PubMed] [Google Scholar]
- 4. El-Serag H. B., Rudolph K. L. (2007) Gastroenterology 132, 2557–2576 [DOI] [PubMed] [Google Scholar]
- 5. Gramantieri L., Ferracin M., Fornari F., Veronese A., Sabbioni S., Liu C. G., Calin G. A., Giovannini C., Ferrazzi E., Grazi G. L., Croce C. M., Bolondi L., Negrini M. (2007) Cancer Res. 67, 6092–6099 [DOI] [PubMed] [Google Scholar]
- 6. Budhu A., Jia H. L., Forgues M., Liu C. G., Goldstein D., Lam A., Zanetti K. A., Ye Q. H., Qin L. X., Croce C. M., Tang Z. Y., Wang X. W. (2008) Hepatology 47, 897–907 [DOI] [PubMed] [Google Scholar]
- 7. Xu T., Zhu Y., Xiong Y., Ge Y. Y., Yun J. P., Zhuang S. M. (2009) Hepatology 50, 113–121 [DOI] [PubMed] [Google Scholar]
- 8. Su H., Yang J. R., Xu T., Huang J., Xu L., Yuan Y., Zhuang S. M. (2009) Cancer Res. 69, 1135–1142 [DOI] [PubMed] [Google Scholar]
- 9. Murakami Y., Yasuda T., Saigo K., Urashima T., Toyoda H., Okanoue T., Shimotohno K. (2006) Oncogene 25, 2537–2545 [DOI] [PubMed] [Google Scholar]
- 10. Braconi C., Patel T. (2008) Hepatology 47, 1807–1809 [DOI] [PubMed] [Google Scholar]
- 11. Gramantieri L., Fornari F., Callegari E., Sabbioni S., Lanza G., Croce C. M., Bolondi L., Negrini M. (2008) J. Cell. Mol. Med. 12, 2189–2204 [DOI] [PMC free article] [PubMed] [Google Scholar]
- 12. Kutay H., Bai S., Datta J., Motiwala T., Pogribny I., Frankel W., Jacob S. T., Ghoshal K. (2006) J. Cell. Biochem. 99, 671–678 [DOI] [PMC free article] [PubMed] [Google Scholar] [Retracted]
- 13. Coulouarn C., Factor V. M., Andersen J. B., Durkin M. E., Thorgeirsson S. S. (2009) Oncogene 28, 3526–3536 [DOI] [PMC free article] [PubMed] [Google Scholar]
- 14. Ji J., Shi J., Budhu A., Yu Z., Forgues M., Roessler S., Ambs S., Chen Y., Meltzer P. S., Croce C. M., Qin L. X., Man K., Lo C. M., Lee J., Ng I. O., Fan J., Tang Z. Y., Sun H. C., Wang X. W. (2009) N. Engl. J. Med. 361, 1437–1447 [DOI] [PMC free article] [PubMed] [Google Scholar]
- 15. Ji J., Yamashita T., Budhu A., Forgues M., Jia H. L., Li C., Deng C., Wauthier E., Reid L. M., Ye Q. H., Qin L. X., Yang W., Wang H. Y., Tang Z. Y., Croce C. M., Wang X. W. (2009) Hepatology 50, 472–480 [DOI] [PMC free article] [PubMed] [Google Scholar]
- 16. Ladeiro Y., Couchy G., Balabaud C., Bioulac-Sage P., Pelletier L., Rebouissou S., Zucman-Rossi J. (2008) Hepatology 47, 1955–1963 [DOI] [PubMed] [Google Scholar]
- 17. Song G., Sharma A. D., Roll G. R., Ng R., Lee A. Y., Blelloch R. H., Frandsen N. M., Willenbring H. (2010) Hepatology 51, 1735–1743 [DOI] [PMC free article] [PubMed] [Google Scholar]
- 18. Ura S., Honda M., Yamashita T., Ueda T., Takatori H., Nishino R., Sunakozaka H., Sakai Y., Horimoto K., Kaneko S. (2009) Hepatology 49, 1098–1112 [DOI] [PubMed] [Google Scholar]
- 19. Varnholt H., Drebber U., Schulze F., Wedemeyer I., Schirmacher P., Dienes H. P., Odenthal M. (2008) Hepatology 47, 1223–1232 [DOI] [PubMed] [Google Scholar]
- 20. Wang B., Majumder S., Nuovo G., Kutay H., Volinia S., Patel T., Schmittgen T. D., Croce C., Ghoshal K., Jacob S. T. (2009) Hepatology 50, 1152–1161 [DOI] [PMC free article] [PubMed] [Google Scholar]
- 21. Wong Q. W., Lung R. W., Law P. T., Lai P. B., Chan K. Y., To K. F., Wong N. (2008) Gastroenterology 135, 257–269 [DOI] [PubMed] [Google Scholar]
- 22. Wang Y., Lee A. T., Ma J. Z., Wang J., Ren J., Yang Y., Tantoso E., Li K. B., Ooi L. L., Tan P., Lee C. G. (2008) J. Biol. Chem. 283, 13205–13215 [DOI] [PubMed] [Google Scholar]
- 23. Hou J., Lin L., Zhou W., Wang Z., Ding G., Dong Q., Qin L., Wu X., Zheng Y., Yang Y., Tian W., Zhang Q., Wang C., Zhang Q., Zhuang S. M., Zheng L., Liang A., Tao W., Cao X. (2011) Cancer Cell 19, 232–243 [DOI] [PubMed] [Google Scholar]
- 24. Wong T. S., Liu X. B., Wong B. Y., Ng R. W., Yuen A. P., Wei W. I. (2008) Clin. Cancer Res. 14, 2588–2592 [DOI] [PubMed] [Google Scholar]
- 25. Yamada H., Yanagisawa K., Tokumaru S., Taguchi A., Nimura Y., Osada H., Nagino M., Takahashi T. (2008) Genes Chromosomes Cancer 47, 810–818 [DOI] [PubMed] [Google Scholar]
- 26. Nam E. J., Yoon H., Kim S. W., Kim H., Kim Y. T., Kim J. H., Kim J. W., Kim S. (2008) Clin. Cancer Res. 14, 2690–2695 [DOI] [PubMed] [Google Scholar]
- 27. Catto J. W., Miah S., Owen H. C., Bryant H., Myers K., Dudziec E., Larré S., Milo M., Rehman I., Rosario D. J., Di Martino E., Knowles M. A., Meuth M., Harris A. L., Hamdy F. C. (2009) Cancer Res. 69, 8472–8481 [DOI] [PMC free article] [PubMed] [Google Scholar]
- 28. Doghman M., El Wakil A., Cardinaud B., Thomas E., Wang J., Zhao W., Peralta-Del Valle M. H., Figueiredo B. C., Zambetti G. P., Lalli E. (2010) Cancer Res. 70, 4666–4675 [DOI] [PMC free article] [PubMed] [Google Scholar]
- 29. Sun D., Lee Y. S., Malhotra A., Kim H. K., Matecic M., Evans C., Jensen R. V., Moskaluk C. A., Dutta A. (2011) Cancer Res. 71, 1313–1324 [DOI] [PMC free article] [PubMed] [Google Scholar]
- 30. Chen X., Li Q., Wang J., Guo X., Jiang X., Ren Z., Weng C., Sun G., Wang X., Liu Y., Ma L., Chen J. Y., Wang J., Zen K., Zhang J., Zhang C. Y. (2009) Genome Biol. 10, R78. [DOI] [PMC free article] [PubMed] [Google Scholar]
- 31. Hua Y. J., Tang Z. Y., Tu K., Zhu L., Li Y. X., Xie L., Xiao H. S. (2009) BMC Genomics 10, 214. [DOI] [PMC free article] [PubMed] [Google Scholar]
- 32. John B., Enright A. J., Aravin A., Tuschl T., Sander C., Marks D. S. (2004) PLoS Biol. 2, e363. [DOI] [PMC free article] [PubMed] [Google Scholar]
- 33. Hay N., Sonenberg N. (2004) Genes Dev. 18, 1926–1945 [DOI] [PubMed] [Google Scholar]
- 34. Fingar D. C., Richardson C. J., Tee A. R., Cheatham L., Tsou C., Blenis J. (2004) Mol. Cell. Biol. 24, 200–216 [DOI] [PMC free article] [PubMed] [Google Scholar]
- 35. Grewe M., Gansauge F., Schmid R. M., Adler G., Seufferlein T. (1999) Cancer Res. 59, 3581–3587 [PubMed] [Google Scholar]
- 36. Dufourny B., Alblas J., van Teeffelen H. A., van Schaik F. M., van der Burg B., Steenbergh P. H., Sussenbach J. S. (1997) J. Biol. Chem. 272, 31163–31171 [DOI] [PubMed] [Google Scholar]
- 37. Sato F., Tsuchiya S., Meltzer S. J., Shimizu K. (2011) FEBS J. 278, 1598–1609 [DOI] [PubMed] [Google Scholar]
- 38. Hermeking H. (2010) Cell Death Differ. 17, 193–199 [DOI] [PubMed] [Google Scholar]
- 39. He L., Thomson J. M., Hemann M. T., Hernando-Monge E., Mu D., Goodson S., Powers S., Cordon-Cardo C., Lowe S. W., Hannon G. J., Hammond S. M. (2005) Nature 435, 828–833 [DOI] [PMC free article] [PubMed] [Google Scholar]
- 40. Hermeking H. (2007) Cancer Cell 12, 414–418 [DOI] [PubMed] [Google Scholar]
- 41. Kong W., Yang H., He L., Zhao J. J., Coppola D., Dalton W. S., Cheng J. Q. (2008) Mol. Cell. Biol. 28, 6773–6784 [DOI] [PMC free article] [PubMed] [Google Scholar]
- 42. Permuth-Wey J., Thompson R. C., Burton Nabors L., Olson J. J., Browning J. E., Madden M. H., Ann Chen Y., Egan K. M. (2011) J. Neurooncol. doi: 10.1007/s11060-011-0634-1 [DOI] [PMC free article] [PubMed] [Google Scholar]
- 43. Yue C., Wang M., Ding B., Wang W., Fu S., Zhou D., Zhang Z., Han S. (2011) Gynecol. Oncol. 122, 33–37 [DOI] [PubMed] [Google Scholar]
- 44. Jiang J., Gusev Y., Aderca I., Mettler T. A., Nagorney D. M., Brackett D. J., Roberts L. R., Schmittgen T. D. (2008) Clin. Cancer Res. 14, 419–427 [DOI] [PMC free article] [PubMed] [Google Scholar]
- 45. Xiong Y., Fang J. H., Yun J. P., Yang J., Zhang Y., Jia W. H., Zhuang S. M. (2010) Hepatology 51, 836–845 [DOI] [PubMed] [Google Scholar]
- 46. Wong C. C., Wong C. M., Tung E. K., Au S. L., Lee J. M., Poon R. T., Man K., Ng I. O. (2010) Gastroenterology 140, 322–331 [DOI] [PubMed] [Google Scholar]
- 47. Villanueva A., Chiang D. Y., Newell P., Peix J., Thung S., Alsinet C., Tovar V., Roayaie S., Minguez B., Sole M., Battiston C., Van Laarhoven S., Fiel M. I., Di Feo A., Hoshida Y., Yea S., Toffanin S., Ramos A., Martignetti J. A., Mazzaferro V., Bruix J., Waxman S., Schwartz M., Meyerson M., Friedman S. L., Llovet J. M. (2008) Gastroenterology 135, 1972–1983 [DOI] [PMC free article] [PubMed] [Google Scholar]
- 48. Zhou L., Huang Y., Li J., Wang Z. (2010) Med. Oncol. 27, 255–261 [DOI] [PubMed] [Google Scholar]
- 49. Grimberg A. (2003) Cancer Biol. Ther. 2, 630–635 [PMC free article] [PubMed] [Google Scholar]
- 50. Alexander I. E., Cunningham S. C., Logan G. J., Christodoulou J. (2008) Gene Ther. 15, 831–839 [DOI] [PubMed] [Google Scholar]
- 51. Arbuthnot P., Ely A., Weinberg M. S. (2009) Curr. Gene Ther. 9, 91–103 [DOI] [PubMed] [Google Scholar]
- 52. Nishina K., Unno T., Uno Y., Kubodera T., Kanouchi T., Mizusawa H., Yokota T. (2008) Mol. Ther. 16, 734–740 [DOI] [PubMed] [Google Scholar]
- 53. Kim S. I., Shin D., Choi T. H., Lee J. C., Cheon G. J., Kim K. Y., Park M., Kim M. (2007) Mol. Ther. 15, 1145–1152 [DOI] [PubMed] [Google Scholar]
Associated Data
This section collects any data citations, data availability statements, or supplementary materials included in this article.