

Abstract
OBJECTIVE
To evaluate whether healthy or diabetic adult mice can tolerate an extreme loss of pancreatic α-cells and how this sudden massive depletion affects β-cell function and blood glucose homeostasis.
RESEARCH DESIGN AND METHODS
We generated a new transgenic model allowing near-total α-cell removal specifically in adult mice. Massive α-cell ablation was triggered in normally grown and healthy adult animals upon diphtheria toxin (DT) administration. The metabolic status of these mice was assessed in 1) physiologic conditions, 2) a situation requiring glucagon action, and 3) after β-cell loss.
RESULTS
Adult transgenic mice enduring extreme (98%) α-cell removal remained healthy and did not display major defects in insulin counter-regulatory response. We observed that 2% of the normal α-cell mass produced enough glucagon to ensure near-normal glucagonemia. β-Cell function and blood glucose homeostasis remained unaltered after α-cell loss, indicating that direct local intraislet signaling between α- and β-cells is dispensable. Escaping α-cells increased their glucagon content during subsequent months, but there was no significant α-cell regeneration. Near-total α-cell ablation did not prevent hyperglycemia in mice having also undergone massive β-cell loss, indicating that a minimal amount of α-cells can still guarantee normal glucagon signaling in diabetic conditions.
CONCLUSIONS
An extremely low amount of α-cells is sufficient to prevent a major counter-regulatory deregulation, both under physiologic and diabetic conditions. We previously reported that α-cells reprogram to insulin production after extreme β-cell loss and now conjecture that the low α-cell requirement could be exploited in future diabetic therapies aimed at regenerating β-cells by reprogramming adult α-cells.
In rodents, glucagon-producing α-cells are the second most abundant endocrine cell type in pancreatic islets of Langerhans, after the insulin-producing β-cells. In human islets, α-cells are nearly as abundant as β-cells (1,2). They secrete glucagon in response to reduced blood glucose to promote gluconeogenesis and glycogenolysis in the liver (3). Proper control of blood glucose level thus relies on insulin action and the counter-regulation mediated by glucagon signaling. Besides this, insulin and glucagon reciprocally regulate α- and β-cell function through local, intraislet paracrine signaling (4).
Excess of plasma glucagon (hyperglucagonemia) is frequently reported in diabetic patients, a deregulation that exacerbates hyperglycemia and triggers ketoacidosis, a major complication of diabetes (5). A recent study showed that streptozotocin (STZ)-induced diabetes is prevented in glucagon receptor–knockout (GcgR−/−) mice, suggesting that in diabetes, hyperglycemia is largely due to glucagon action (6). Therefore, reducing the α-cell mass to limit glucagon production may represent an interesting approach to prevent glucagon excess in diabetes. Nevertheless, it is unknown how a severe decrease in pancreatic α-cell mass would be tolerated in physiologic or in diabetic conditions. Indeed, whereas a strong deficit in β-cell mass triggers diabetes, less is known regarding the requirement of maintaining intact the adult α-cell population.
Complete disruption of glucagon signaling in GcgR−/− mice is associated with defects in endocrine cell differentiation and increased embryonic lethality (7–9). In addition, mice that are unable to process proglucagon in its mature and active form due to prohormone convertase 2 (PC2) inactivation also display altered islet cell differentiation (10,11). GcgR−/− and PC2−/− adult mutant mice both exhibit an expanded α-cell mass, which is associated with lower blood glucose levels.
Mice constitutively lacking aristaless-related homeobox (ARX) in the pancreas from early development display an α-cell deficit associated with abnormally increased non–α-cell numbers and hypoglycemia (12). In this situation, the altered metabolic status of adult individuals may reflect adaptation phenomena subsequent to developmental defects. Collectively, these studies that focused on the effect of glucagon deficiency did not directly address whether functional α-cells are essential per se for proper β-cell function and blood glucose homeostasis in physiologic conditions in adulthood.
In the current study, we have analyzed a model of inducible, selective α-cell loss that we previously used in studies involving β-cell regeneration (13). Here, we examine the short- and long-term influence on blood glucose homeostasis of an acute, rapid, near-total α-cell ablation induced in healthy normal adult mice. We show that a very limited number of adult α-cells, some 2% of the normal α-cell mass, is sufficient to preserve a normal counter-response to insulin in basal conditions, without affecting β-cell function or longevity. Furthermore, we report that extreme α-cell removal, contrary to what happens in GcgR−/− mice (6), does not prevent hyperglycemia after β-cell loss, indicating that the few remaining α-cells still mediate normal glucagon signaling in diabetes.
RESULTS
Ablation of α-cells.
We previously generated the Glucagon-DTR mouse line in which the administration of diphtheria toxin (DT) induces selective and massive ablation of adult α-cells (13). This is achieved through the transgenic expression of human DT receptor (DTR) on the α-cell surface, driven by a 1.6-kb proximal fragment of the rat glucagon promoter (Fig. 1A).
FIG. 1.
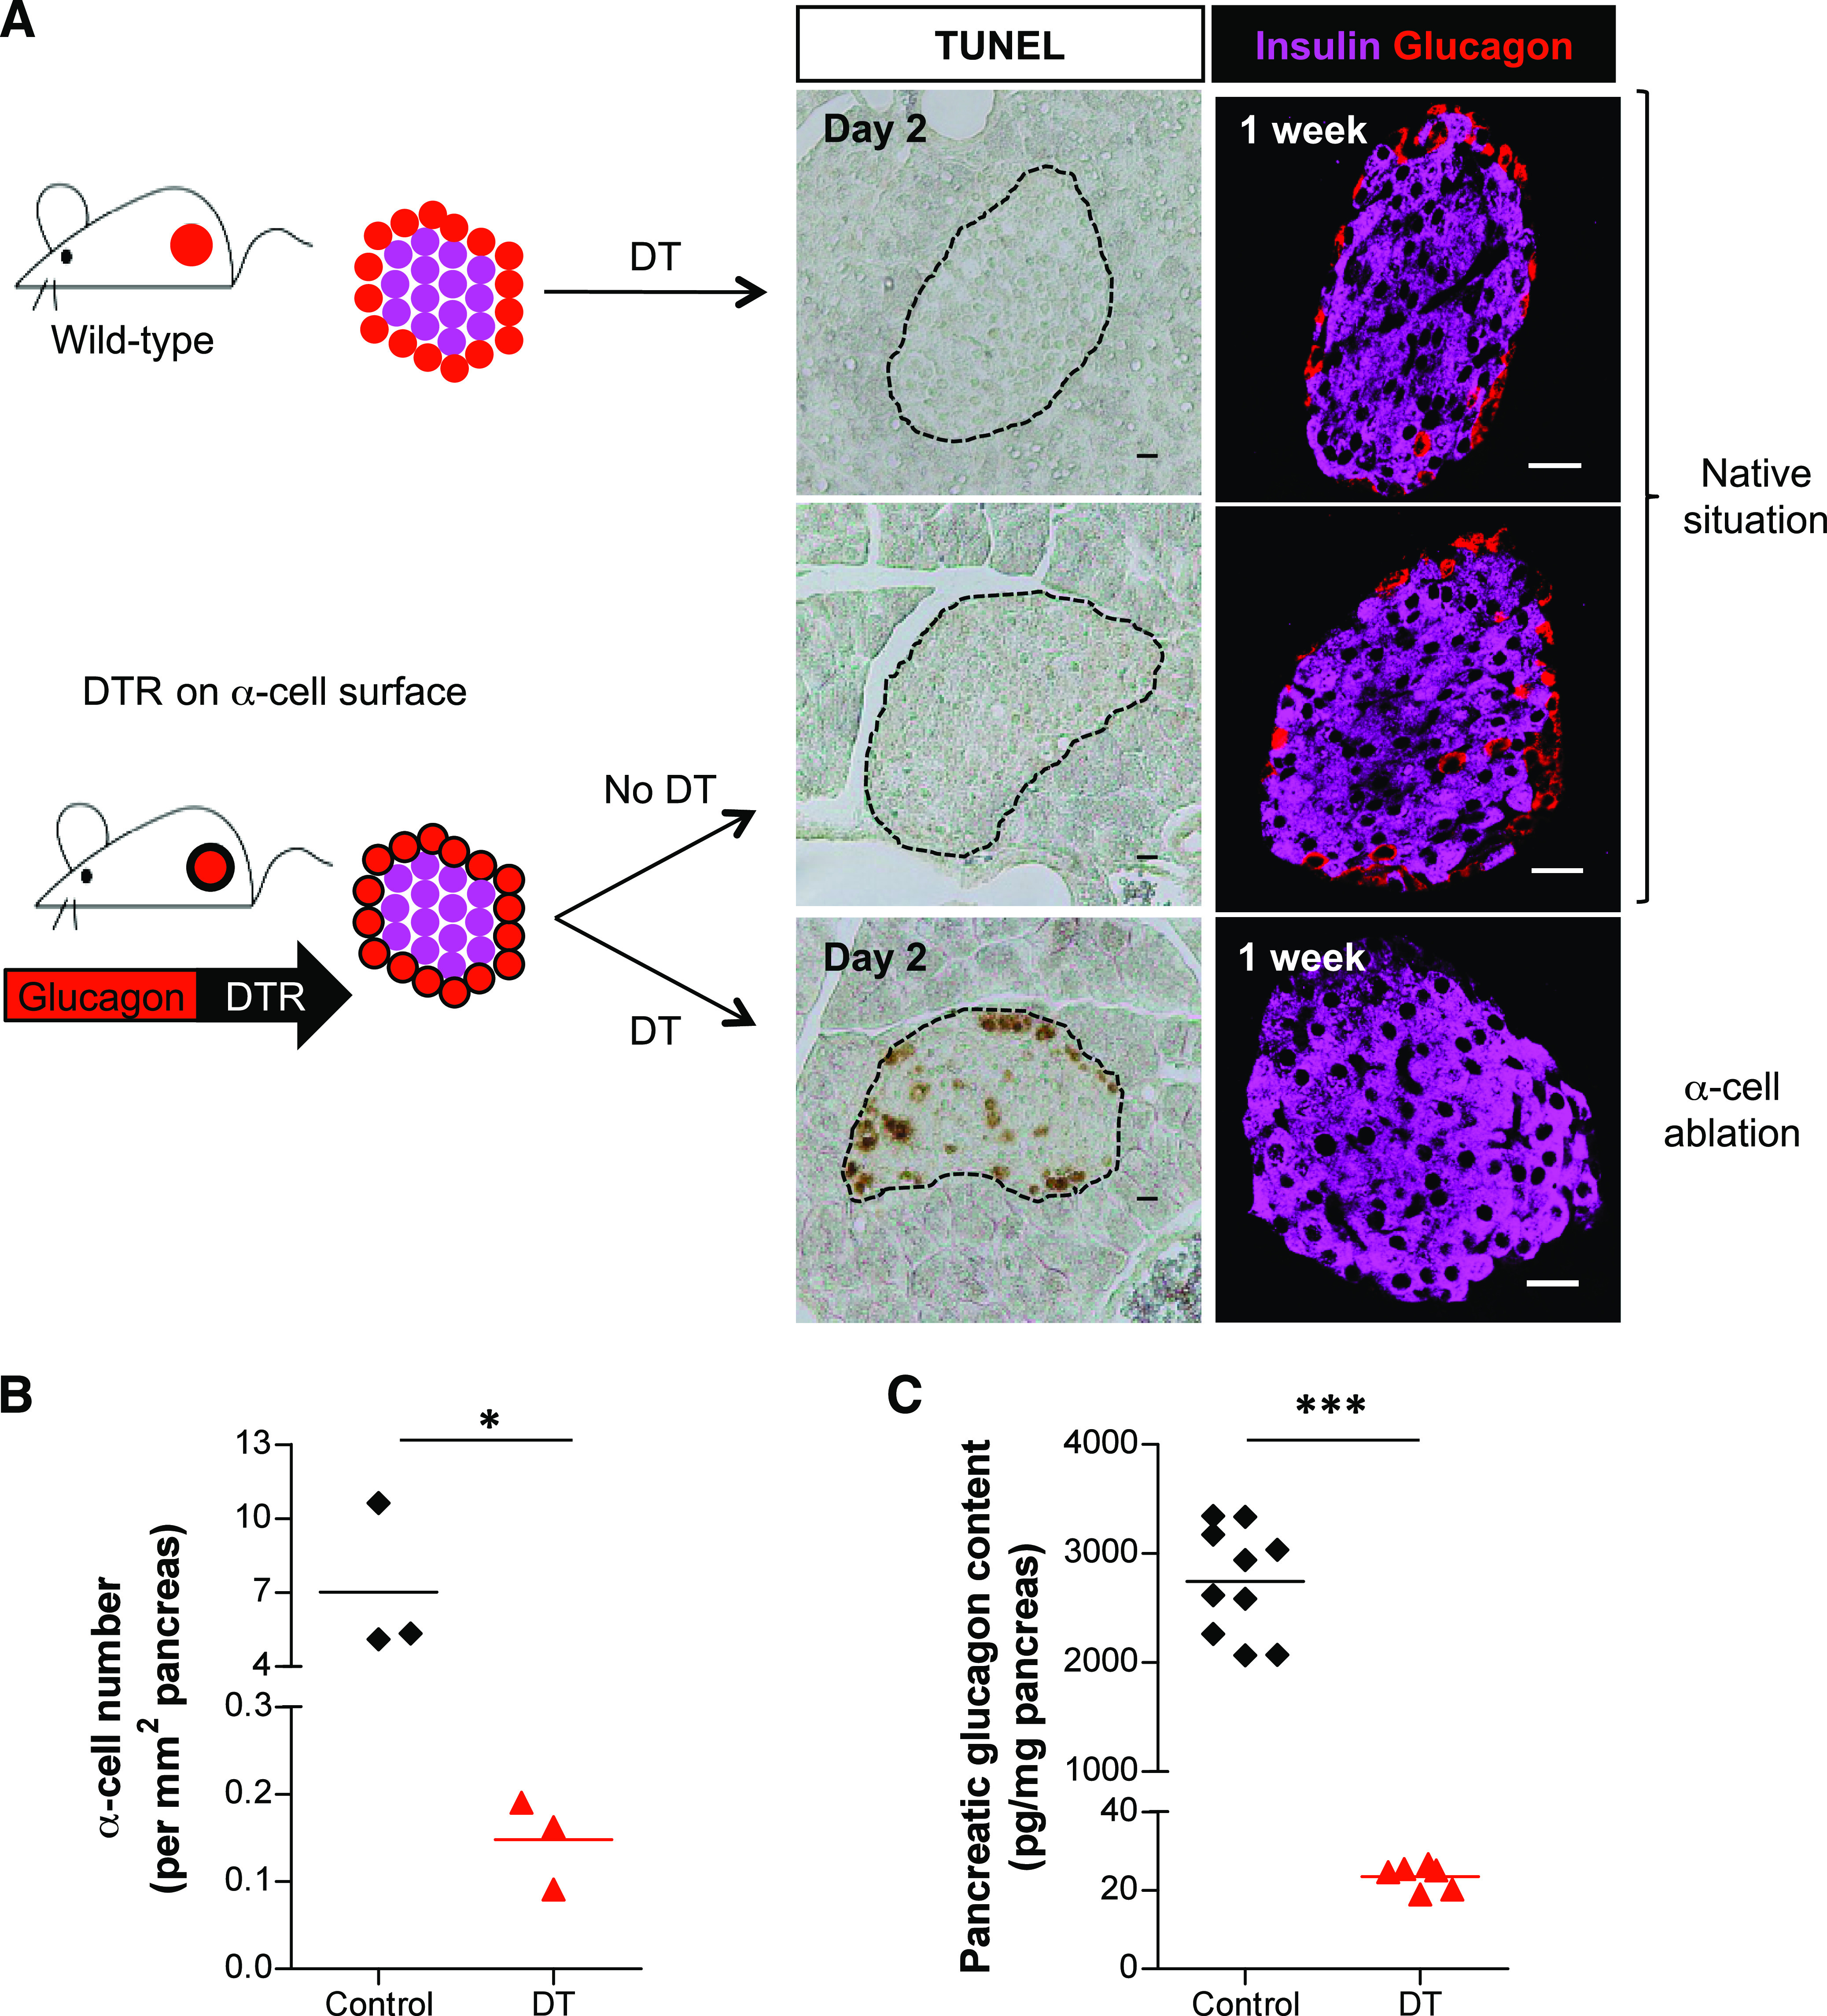
α-Cell ablation in Glucagon-DTR mice. A: DT injection triggers α-cell ablation in Glucagon-DTR transgenic mice but not in wild-type mice. Two days after DT injection, dying cells are detected by TUNEL, mainly at islet periphery in Glucagon-DTR animals (middle). At 1 week after DT injection, islets in transgenic mice are devoid of glucagon-expressing cells (right). The dashed lines delineate islets. Scale bars = 20 μm. B: At 1 week after DT treatment, 97.9% of glucagon-expressing cells were destroyed (*P = 0.05, one-tailed Mann-Whitney U test; values in Table 1). C: At 1 week after DT, pancreatic glucagon content was reduced to 0.86% of control (***P = 0.0001, one-tailed Mann-Whitney U test; values in Table 1). (A high-quality digital representation of this figure is available in the online issue.)
DT-untreated adult Glucagon-DTR mice were healthy and showed normal blood glucose homeostasis, like nontransgenic controls. For this reason, they were well suited for studying the effect of extreme α-cell mass deficit in metabolically unbiased adult animals.
Histologically, Glucagon-DTR mice exhibited normal islet architecture, with peripheral α-cells and no detectable islet cell death (Fig. 1A). By contrast, numerous apoptotic islet cells were seen in Glucagon-DTR mice 2 days after one DT injection (500 ng). One week after 3 DT injections (1,500 ng; see RESEARCH DESIGN AND METHODS), the vast majority of islets were totally devoid of α-cells (Fig. 1A, bottom). We measured α-cell ablation efficiency by morphometry and pancreatic hormone dosage and found the number of α-cells and pancreatic glucagon content were decreased by 97.9% and 99.14%, respectively (Fig. 1B and C and Table 1). In agreement with results obtained using the Glucagon-Cre and Glucagon-rtTA mouse lines, which bear the same rat glucagon promoter fragment (14), we detected transgene expression solely in pancreatic α-cells. Therefore, β-, δ-, PP-, as well as intestinal L cells, were normally present after DT treatment in Glucagon-DTR mice (Supplementary Figs. 1 and 2A). The L cells were not eliminated with DT treatment because “intestinal-specific” cis-regulatory elements of the glucagon promoter (located ∼2.0-kb upstream of the start site) are absent in the transgene (15). Altogether, these results showed that α-cell ablation is specific and efficient.
TABLE 1.
Glucagon and α-cell content in the pancreas of Glucagon-DTR mice
| Control mice |
DT-treated mice |
P | % of control | Fold change | ||||
|---|---|---|---|---|---|---|---|---|
| Variable | Time post-DT | Mean ± SEM | n | Mean ± SEM | n | |||
| Pancreatic glucagon content (pg/mg pancreas) | 1 week | 2,744 ± 156.4 | 10 | 23.52 ± 1.3 | 6 | * | 0.86 | −116.7 |
| 1 month | 2,905.233 ± 276.9 | 6 | 157.9 ± 16.4 | 4 | † | 5.44 | −18.4 | |
| 6 months | 3,320.475 ± 292.2 | 4 | 331.4 ± 42.7 | 5 | † | 9.98 | −10.0 | |
| α-Cell number/mm2 pancreas | 1 week | 7.02 ± 1.80 | 3 | 0.15 ± 0.03 | 3 | ‡ | 2.10 | −47.5 |
| 1 month | 12.50 ± 1.76 | 3 | 0.17 ± 0.03 | 3 | ‡ | 1.40 | −71.6 | |
| 6 months | 9.87 ± 1.07 | 4 | 0.35 ± 0.04 | 4 | ‡ | 3.51 | −28.5 | |
| Total islet number/mm2 pancreas | 1 week | 0.96 ± 0.08 | 3 | 1.15 ± 0.14 | 3 | NS | — | — |
| 1 month | 1.18 ± 0.12 | 3 | 1.09 ± 0.02 | 3 | NS | — | — | |
| 6 months | 1.42 ± 0.17 | 4 | 1.36 ± 0.17 | 4 | NS | — | — | |
| α-Cell–containing islet sections (% of islet sections) | 1 week | 77.48 ± 6.2 | 3 | 7.52 ± 0.36 | 3 | ‡ | 9.71 | −10.3 |
| 1 month | 81.31 ± 4.0 | 3 | 10.18 ± 1.78 | 3 | ‡ | 12.52 | −8.0 | |
| 6 months | 70.47 ± 2.7 | 4 | 10.33 ± 1.45 | 4 | ‡ | 14.66 | −6.8 | |
| α-Cell number/α-cell–containing islet section | 1 week | 8.79 ± 1.2 | 3 | 1.48 ± 0.14 | 3 | ‡ | 16.88 | −5.9 |
| 1 month | 13.18 ± 1.4 | 3 | 1.58 ± 0.03 | 3 | ‡ | 12.01 | −8.3 | |
| 6 months | 9.46 ± 0.6 | 4 | 2.48 ± 0.22 | 4 | ‡ | 26.22 | −3.8 | |
| Extrainsular α-cells/mm2 pancreas | 1 week | 0.0604 ± 0.019 | 3 | 0.007 ± 0.004 | 3 | ‡ | 12.10 | −8.3 |
| 1 month | 0.0184 ± 0.008 | 3 | 0.003 ± 0.002 | 3 | ‡ | 17.29 | −5.8 | |
| 6 months | 0.0433 ± 0.005 | 4 | 0.016 ± 0.007 | 4 | ‡ | 36.04 | −2.8 | |
*P ≤ 0.005.
†P ≤ 0.01.
‡P ≤ 0.05.
In all experiments described below, only 2-month-old male mice were used. When indicated, these animals received 1.5 μg of DT (i.e., 3 i.p. injections).
Blood glucose regulation is unaffected after extreme α-cell ablation.
A follow-up of DT-treated Glucagon-DTR mice was done to assess the lasting impact of near-complete α-cell ablation in adult animals. All DT-treated transgenic mice were viable and healthy during the entire period of analysis (up to 6 months after DT; i.e., 8-month-old mice), which allowed us to evaluate their metabolic status.
Fasting and random-fed body weights were not affected after α-cell ablation (Fig. 2A and Supplementary Fig 3A). Surprisingly, DT-treated animals did not exhibit reduced glycemia compared with controls during fasting or in random-fed conditions (Fig. 2B and Supplementary Fig. 3B). In addition, glycemia was not significantly changed, even after a prolonged starvation (27-h fasting; Supplementary Fig. 3C). Furthermore, DT-treated Glucagon-DTR mice displayed normal insulin sensitivity and were able to recover a normal glycemic level after an insulin-induced hypoglycemia (Fig. 2C).
FIG. 2.
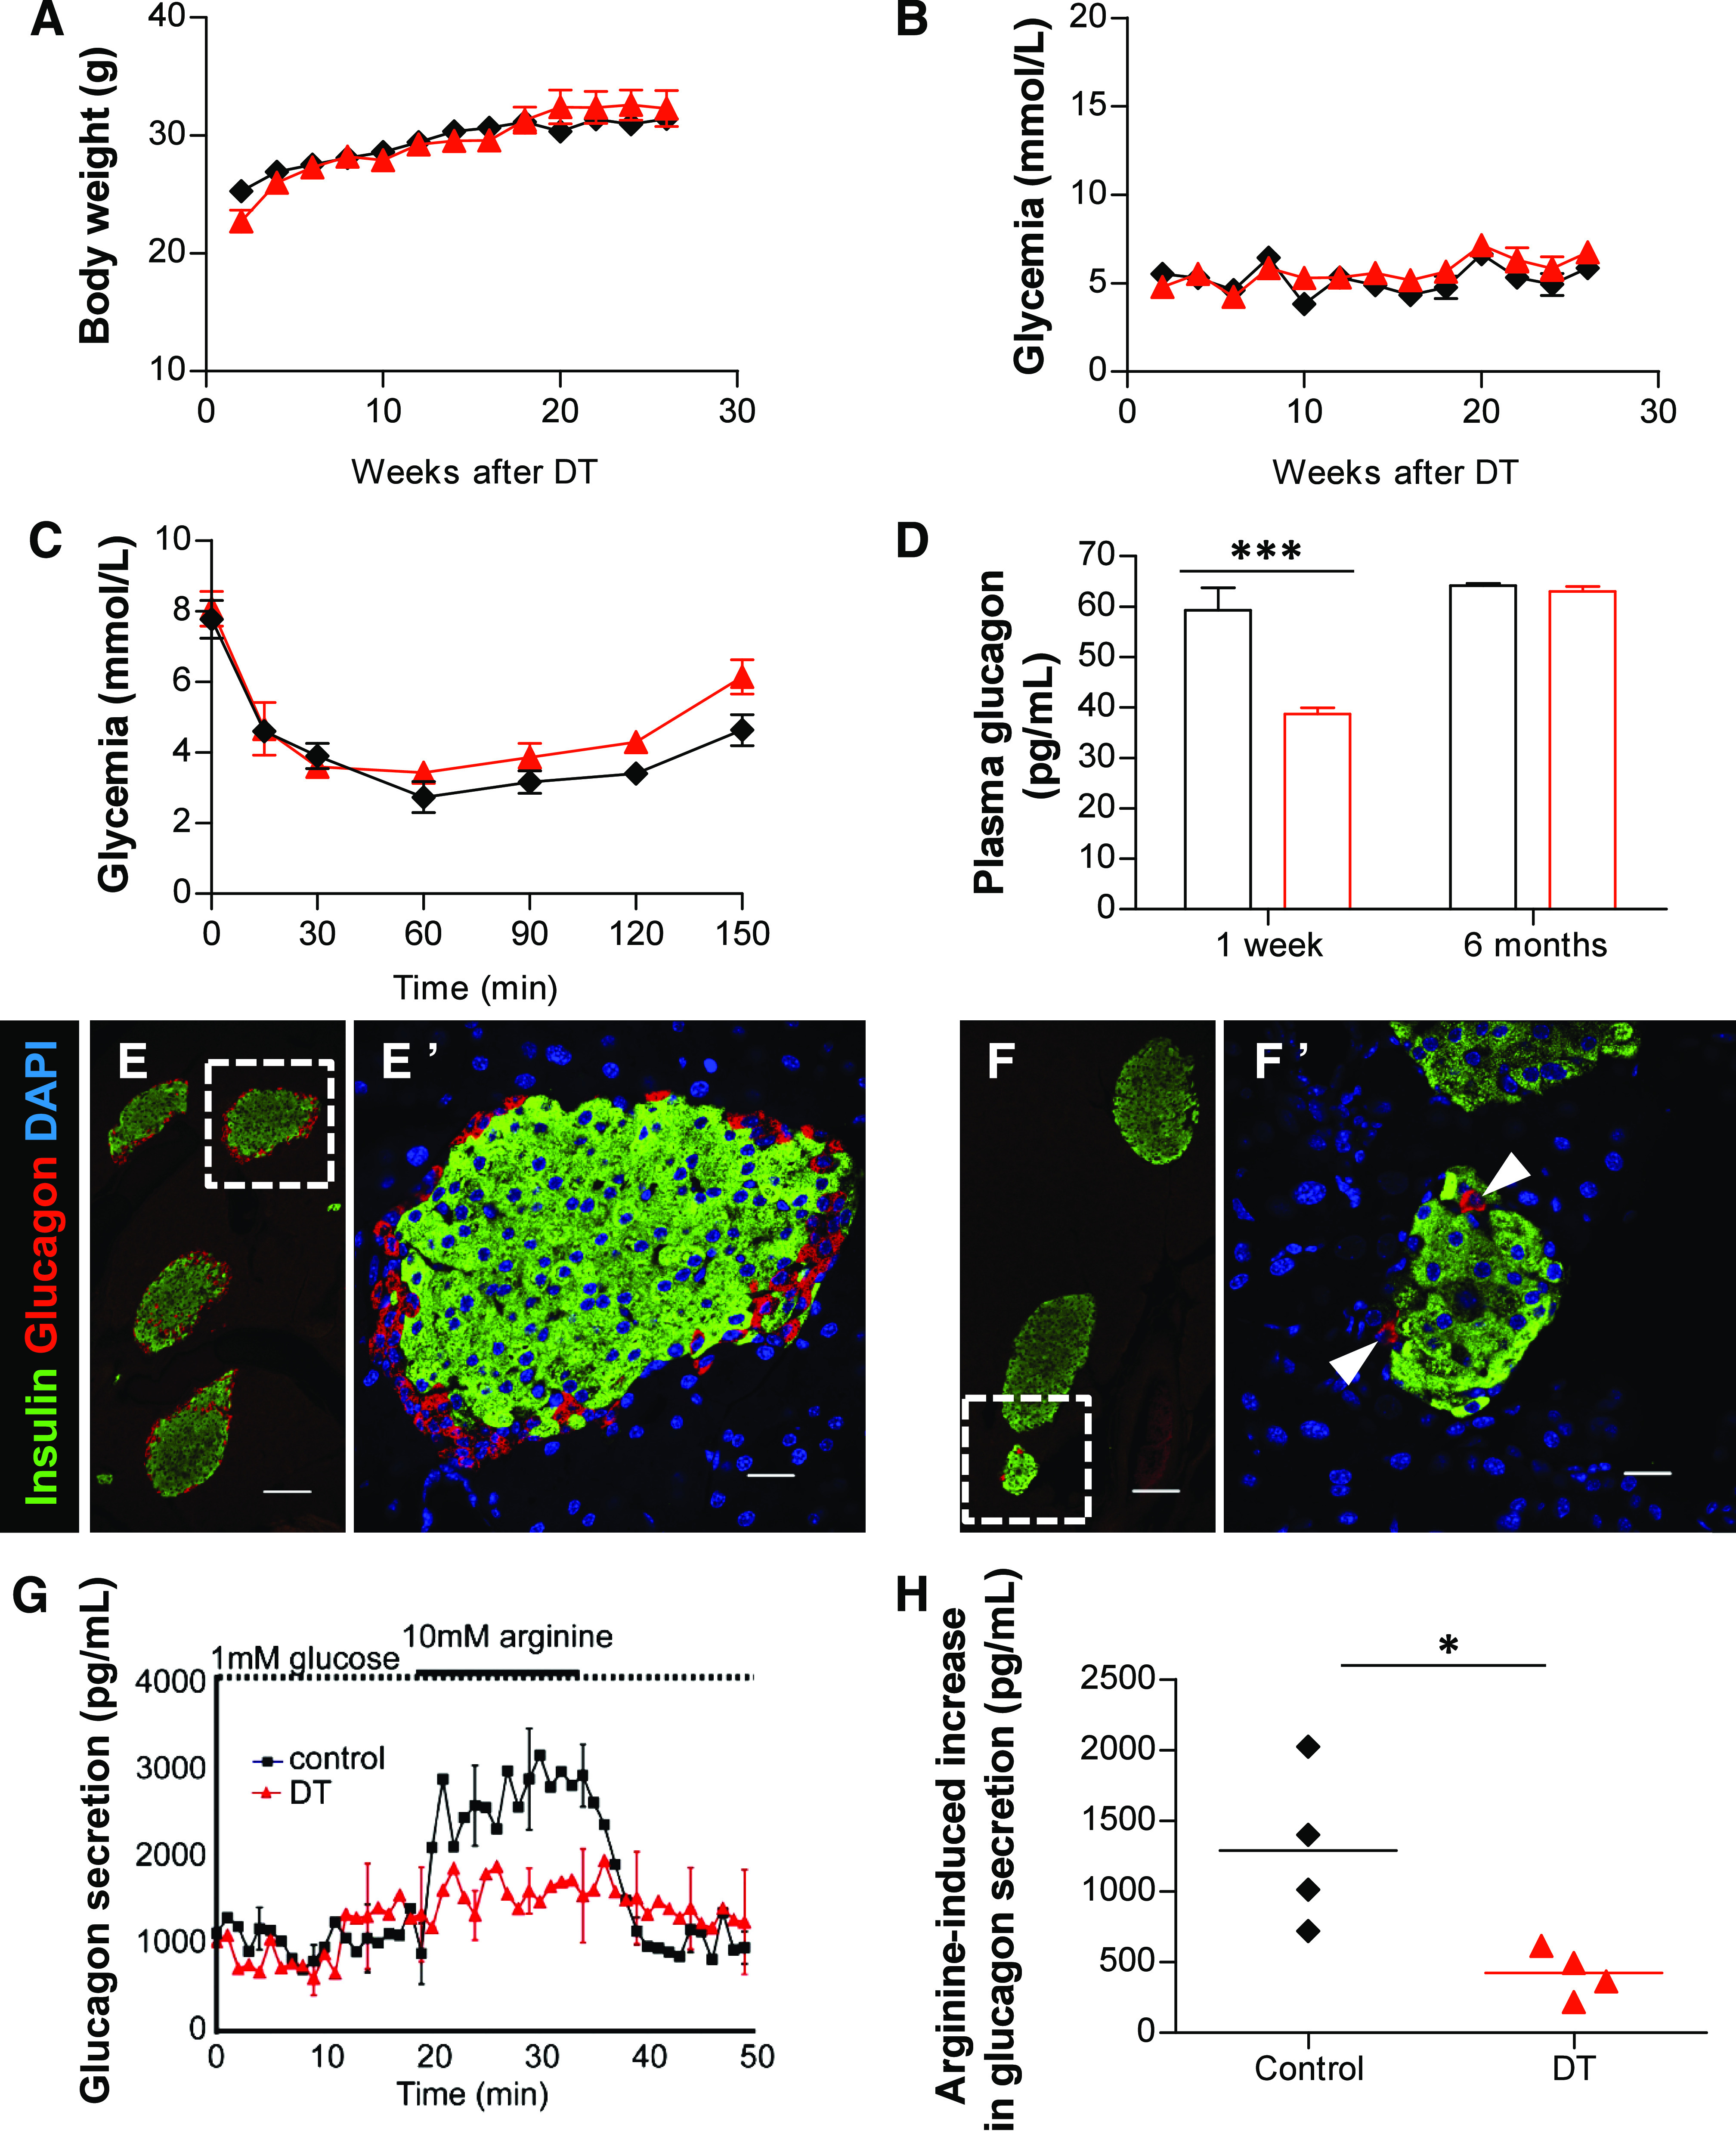
Extreme α-cell loss moderately decreases circulating glucagon and has no effect on the counter-regulatory response. Evolution of body weight (A) and glycemia (B) in fasted controls (n = 3; DT-untreated, black ♦) and DT-treated (n = 3; red ▲) Glucagon-DTR mice. C: Glycemia after insulin-induced hypoglycemia 1 week after α-cell ablation. Blood glucose increased in both DT-treated mice (red ▲) and controls (black ♦) after an insulin challenge (n = 3/group). D: Plasma glucagon 1 week and 6 months after DT (red □) injections and in control (black □) mice. Glucagonemia was significantly reduced by 35% 1 week after DT (***P = 0.001) but returned to normal levels 6 months later (values in Supplementary Table 2). Confocal images of pancreatic sections stained for insulin (green) and glucagon (red) in controls (E) and Glucagon-DTR mice (F). Very few pancreatic α-cells can be observed 1 week after DT. E’ and F’: higher magnification of the dotted areas depicted in E and F, respectively. Scale bars = 100 μm in E and F and 20 μm in E’ and F’. G: Arginine-induced glucagon secretion from perfused pancreas 1 week after DT or in controls. H: Quantification of arginine-induced glucagon secretion upon arginine stimulation (1,290.2 ± 281.9 for controls, and 423.3 ± 85.3 pg/mL for DT-treated Glucagon-DTR mice; *P = 0.014). (A high-quality digital representation of this figure is available in the online issue.)
Because the counter-regulatory response was not impaired in α-cell–depleted mice, we verified their circulating glucagon levels. One week after DT, transgenic animals were hypoglucagonemic (38.7 ± 1.2, n = 10), with a 35% reduction in fasting plasma glucagon compared with controls (59.3 ± 4.5 pg/mL, n = 14; P = 0.001; Fig. 2D). The observed plasma glucagon levels were surprisingly high considering the 98% α-cell loss; we thus explored whether extrapancreatic glucagon was produced in this condition. We found that glucagon was not ectopically secreted from the intestine, because 1) no glucagon-expressing cells were found in the duodenum, jejunum, or ileum (2,261 villi from 4 mice were scored), and 2) no glucagon protein was detected in intestinal extracts 1 week after α-cell removal (Supplementary Fig. 2A and B). Instead, it is likely that the very few pancreatic α-cells that escaped DT accounted for the relatively high glucagonemia found in Glucagon-DTR mice after extreme α-cell ablation (Fig. 2E and F; Supplementary Table 2). We therefore measured glucagon secretion from perfused pancreata after ablation. Interestingly, basal pancreatic glucagon secretion in DT-treated Glucagon-DTR mice was similar to that of controls, thus confirming the pancreatic origin of circulating glucagon after α-cell loss (Fig. 2G). The increase in glucagon secretion upon secretagogue (arginine) induction was very moderate in ablated mice, most likely reflecting the low amount of remnant α-cells (Fig. 2G and H).
We subsequently assessed how the moderate hypoglucagonemia affects hepatic function. The mRNA levels of hepatic gluconeogenic enzymes glucose-6-phosphatase (G6Pase) and PEPCK were not significantly changed 1 week after α-cell loss in Glucagon-DTR mice (Supplementary Fig. 3D). In agreement with this, gluconeogenesis was unaffected in these animals, as assessed by a pyruvate tolerance test (PTT; Supplementary Fig. 3E and F). Interestingly, glucose mobilization after intraperitoneal glucagon injection (glucagon tolerance test) was increased after α-cell ablation (Supplementary Fig. 3G and H). This increased glucagon sensitivity correlated with an observed tendency toward a slight increase in the transcription of hepatic GcgR and glycogen phosphorylase (GP) the key enzyme involved in glycogenolysis (Supplementary Fig. 3D).
Taken together, these observations show that the control of blood glucose is normal 1 week after α-cell ablation and suggest that 2% of the α-cell mass is enough to maintain a plasma glucagon level sufficient to ensure normoglycemia under basal conditions. Furthermore, the decrease in circulating glucagon is rapidly compensated by enhanced glucagon sensitivity and glucose mobilization from the liver.
β-Cell function is unaltered after extreme α-cell ablation.
α-Cells interact with β-cells, most likely by local intraislet interactions, and α- and β-cells express insulin and glucagon receptors, respectively (3,4,16–18). We thus assessed whether α-cells are important for adequate β-cell function. Pancreatic insulin content was unchanged after DT, indicating that near-total α-cell ablation has no effect on global insulin production (Fig. 3A). Glucagon-DTR mice were also able to recover normoglycemia after glucose challenge (glucose tolerance test), either 1 week or 6 months after DT (Fig. 3B and Supplementary Fig. 4) and did not exhibit any defects in basal or glucose-stimulated insulin secretion, as shown by pancreas perfusion experiments (Fig. 3C). These results, together with the long-term follow-up of glycemia in α-cell–depleted Glucagon-DTR mice, reveal that massive loss of α-cells does not affect blood glucose homeostasis or β-cell function.
FIG. 3.
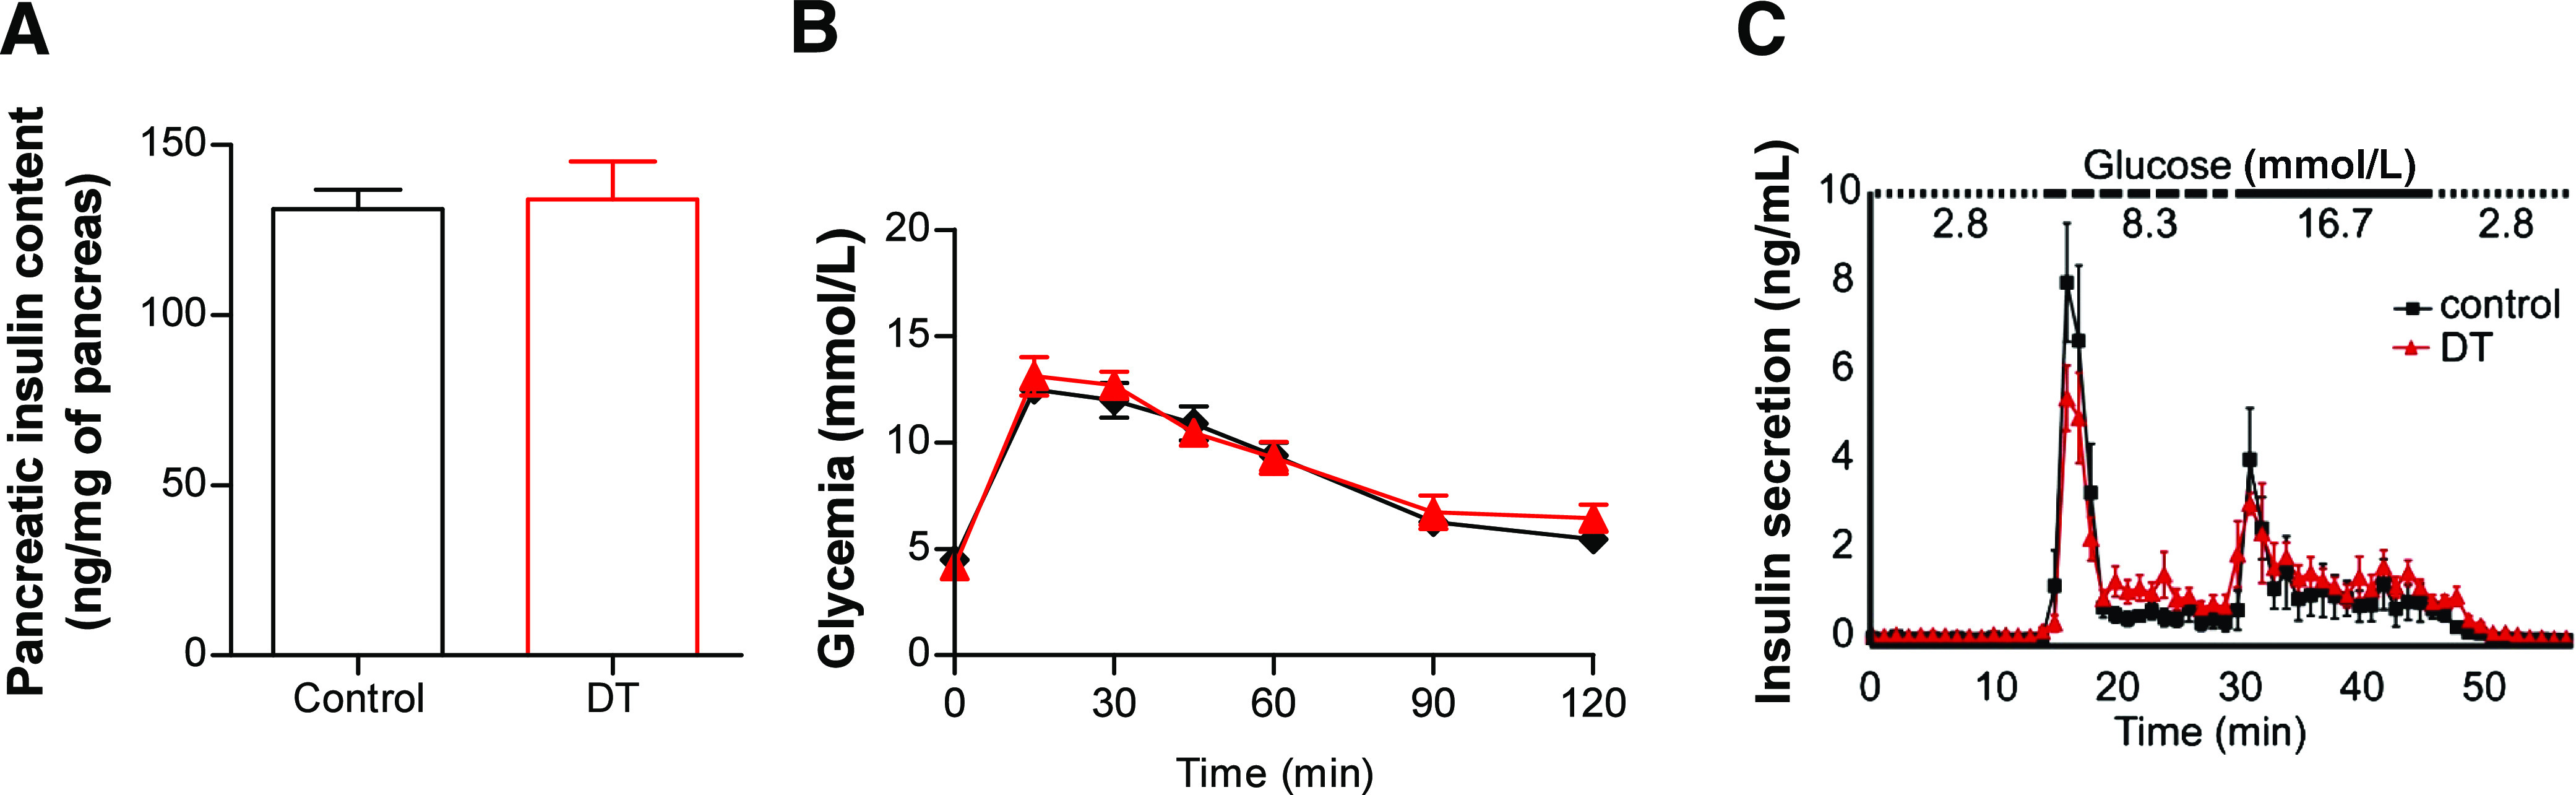
β-Cell function is unaltered after α-cell ablation. A: Pancreatic insulin content measured 1 week after DT. Consistent with the specificity of α-cell ablation, pancreatic insulin content was unaffected after DT (control: 131.1 ± 5.8, n = 6; DT: 134.0 ± 11.0 ng/mg of pancreas, n = 7). B: Glucose tolerance test. DT-treated Glucagon-DTR mice (red ▲) were not intolerant to glucose 1 week after massive α-cell ablation (n = 6 for each group; control, black ♦). C: Insulin secretion measured from perfused pancreas after glucose stimulation. No significant change in insulin secretion was observed 1 week after α-cell ablation (n = 4 for each group).
Limited α-cell regeneration after extreme α-cell ablation.
One week after DT administration, the total pancreatic glucagon content had dropped to 0.86% of control level, but 1 and 6 months later, it was increased by a factor of 6.7- and 14-fold, respectively (Fig. 4A and Table 1). Basal glucagonemia was normal in Glucagon-DTR mice (n = 4) 6 months after α-cell destruction (63.0 ± 0.9 vs. 64.2 ± 0.4 pg/mL in controls, n = 3; Fig. 2D). These observations are consistent with 1) increased glucagon production and secretion with time, by the few remaining α-cells, and 2) the regeneration of new α-cells, or both. To explore these possibilities, we assessed the number of α-cells present in the pancreas 1 week, 1 month, and 6 months after DT (Supplementary Table 1). The total number of α-cells remained unchanged between 1 week and 1 month after DT, but was doubled at 6 months, from 0.17 at 1 month to 0.35 cells/mm2 5 months later (P = 0.0286; Fig. 4B and Table 1). The number of islets was similar between untreated and DT-treated animals at all intervals, suggesting that new islets are not formed after α-cell ablation (Fig. 4C and Table 1). The number of islet sections containing at least 1 α-cell did not increase during the regeneration period under study: the percentage of sections containing α-cells dropped 1 week after DT by about 10-fold compared with untreated controls and remained stable thereafter (Fig. 4D and Table 1). Nevertheless, among the islets that contained α-cells, the number of α-cells per islet section was almost doubled 6 months after DT, from 1.58 at 1 month to 2.48 α-cells/α-cell–containing islets (P = 0.0286; Fig. 4E and Table 1). These findings suggest that the doubling in α-cells observed 6 months post-DT was not due to the appearance of new glucagon-expressing cells in islets devoid of α-cells. Furthermore, we found that α-cell apoptosis and proliferation were not increased at any time after DT administration, thus suggesting that the low α-cell regeneration observed after massive α-cell ablation was not the consequence of a high rate α-cell turnover (Supplementary Figs. 5 and 6).
FIG. 4.
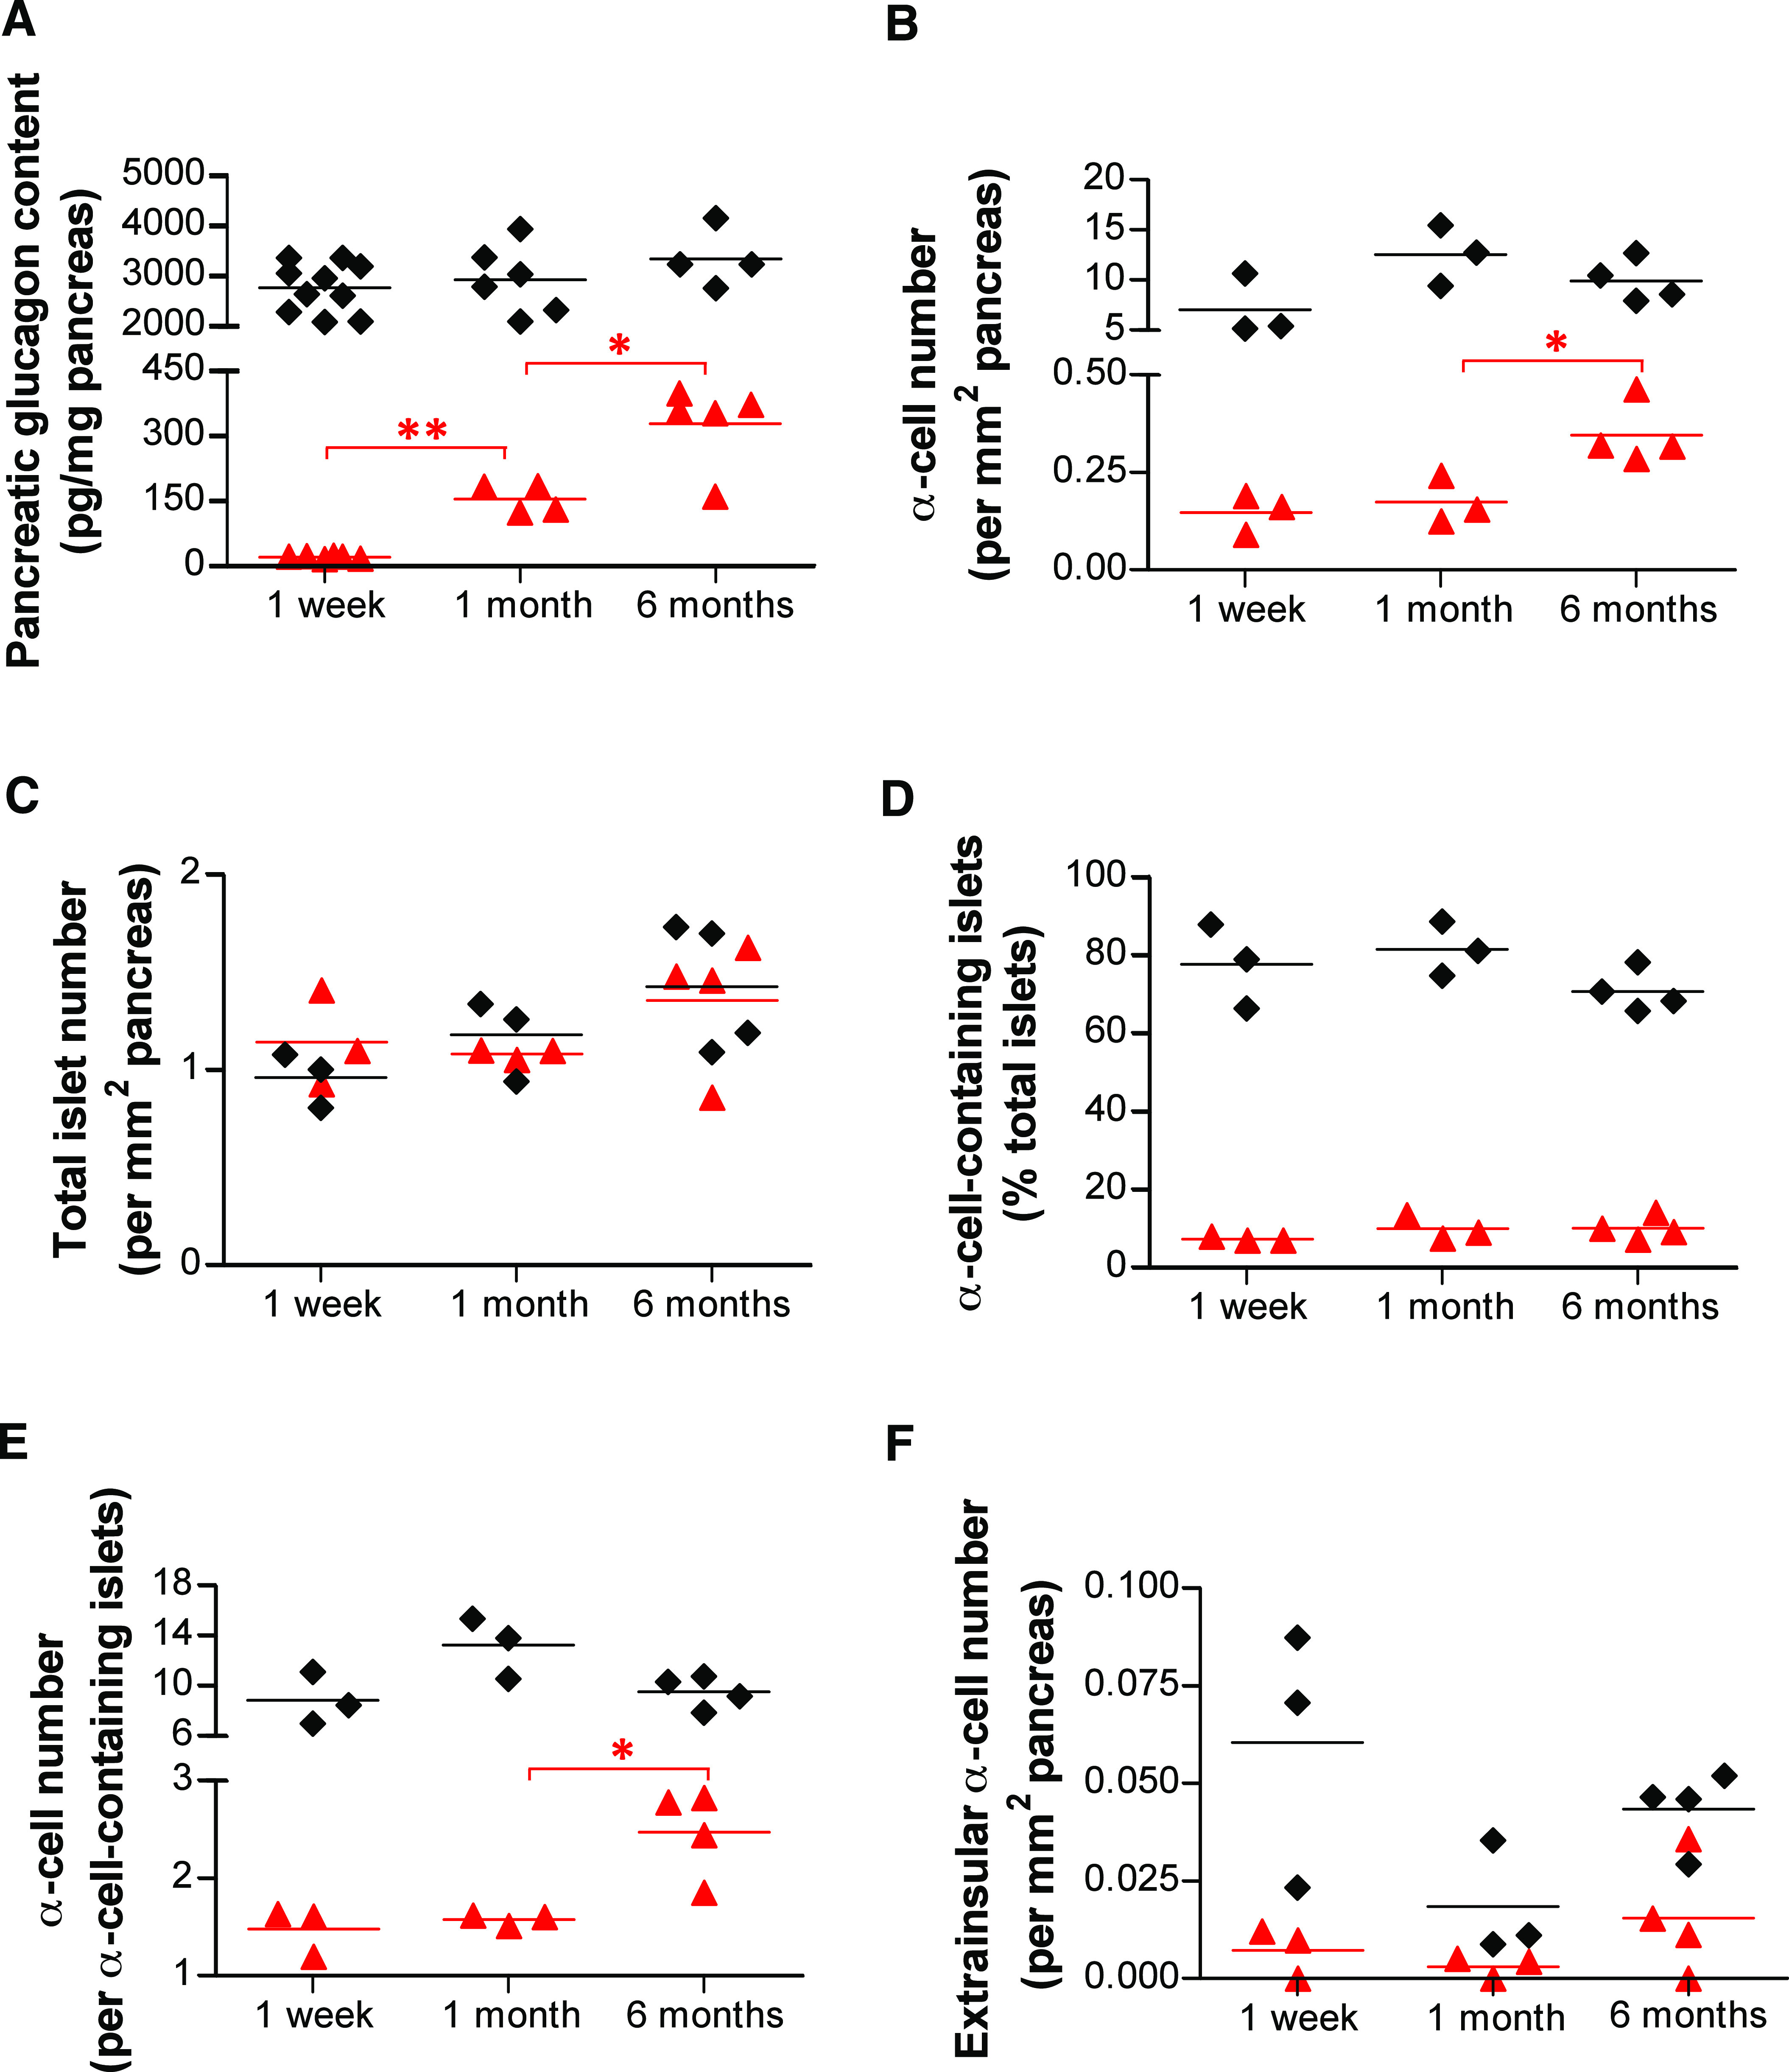
Changes in pancreatic glucagon content and α-cell number after near-total α-cell loss. A: Pancreatic glucagon content was increased almost sevenfold between 1 week and 1 month (from 23.52 to 157.9 pg/mg; **P = 0.0048, one-tailed Mann-Whitney U test) and doubled between 1 and 6 months (157.9 to 331.4 pg/mg; *P = 0.0317, one-tailed Mann-Whitney U test) in DT-treated animals. B: Pancreatic α-cell number was not increased between 1 week and 1 month after DT but was doubled at 6 months. C: The total number of islets (defined as clusters of at least three β-cells) remained unchanged after α-cell ablation. D: The number of islet sections containing at least one α-cell was dramatically reduced after DT treatment, throughout the whole period of analysis. E: The number of α-cells in islet sections containing α-cells after DT treatment was almost doubled at 6 months. F: The number of α-cells located outside of islets was always lower in DT-treated mice than in controls and did not increase significantly with time after DT. A–F: Black ♦: control; red ▲: DT-treated mice.
The number of glucagon-positive cells located outside of islets was decreased after DT treatment by about eightfold 1 week after DT, from 0.0604 to 0.007 α-cells/mm2 (P = 0.05), indicating that DT also kills extrainsular glucagon–expressing cells (Fig. 4F and Table 1). Interestingly, the extrainsular α-cell number always remained lower than that of controls at each interval.
Altogether, these results suggest that 1) although the α-cell number remains unchanged during the first month after ablation, the very few spared α-cells increase their glucagon content; 2) the doubling in the α-cell number seen 6 months after DT is mainly due to the increase of glucagon-expressing cells in islets that retained at least one α-cell after DT, and 3) there is no evidence of α-cell neogenesis from unidentified pancreatic precursors in extraislet structures or in islets totally devoid of α-cells after DT.
We noted here that an in vivo cell lineage clonal analysis showed precisely one α-cell doubling during the first 6 months of postnatal life in normal mice (19).
β-Cells do not reprogram to glucagon expression upon α-cell loss.
We recently showed that adult α-cells spontaneously reprogram to acquire β-cell characteristics after extreme, near-total β-cell destruction (13). We have now investigated whether the reverse β-cell to α-cell transdifferentiation also occurs spontaneously after α-cell ablation; that is, if glucagon-expressing cells found several months after DT administration were indeed β-cells that had been reprogrammed to glucagon production after α-cell loss. For this purpose, we performed a conditional cell lineage tracing using RIP-CreERT, Rosa26YFP, Glucagon-DTR transgenic mice (Fig. 5A). We irreversibly labeled β-cells with the yellow fluorescent protein (YFP) by the administration of tamoxifen before α-cell ablation (Fig. 5B). DT was given to ablate α-cells 2 weeks later. At 1 and 6 months after DT, none of the few glucagon-expressing cells found were YFP-positive (634 islets from 6 mice were scored and 256 glucagon-positive cells analyzed), whereas almost all β-cells were fluorescently tagged (Fig. 5C–J). In conclusion, the glucagon-expressing cells present after massive α-cell ablation are not reprogrammed β-cells.
FIG. 5.
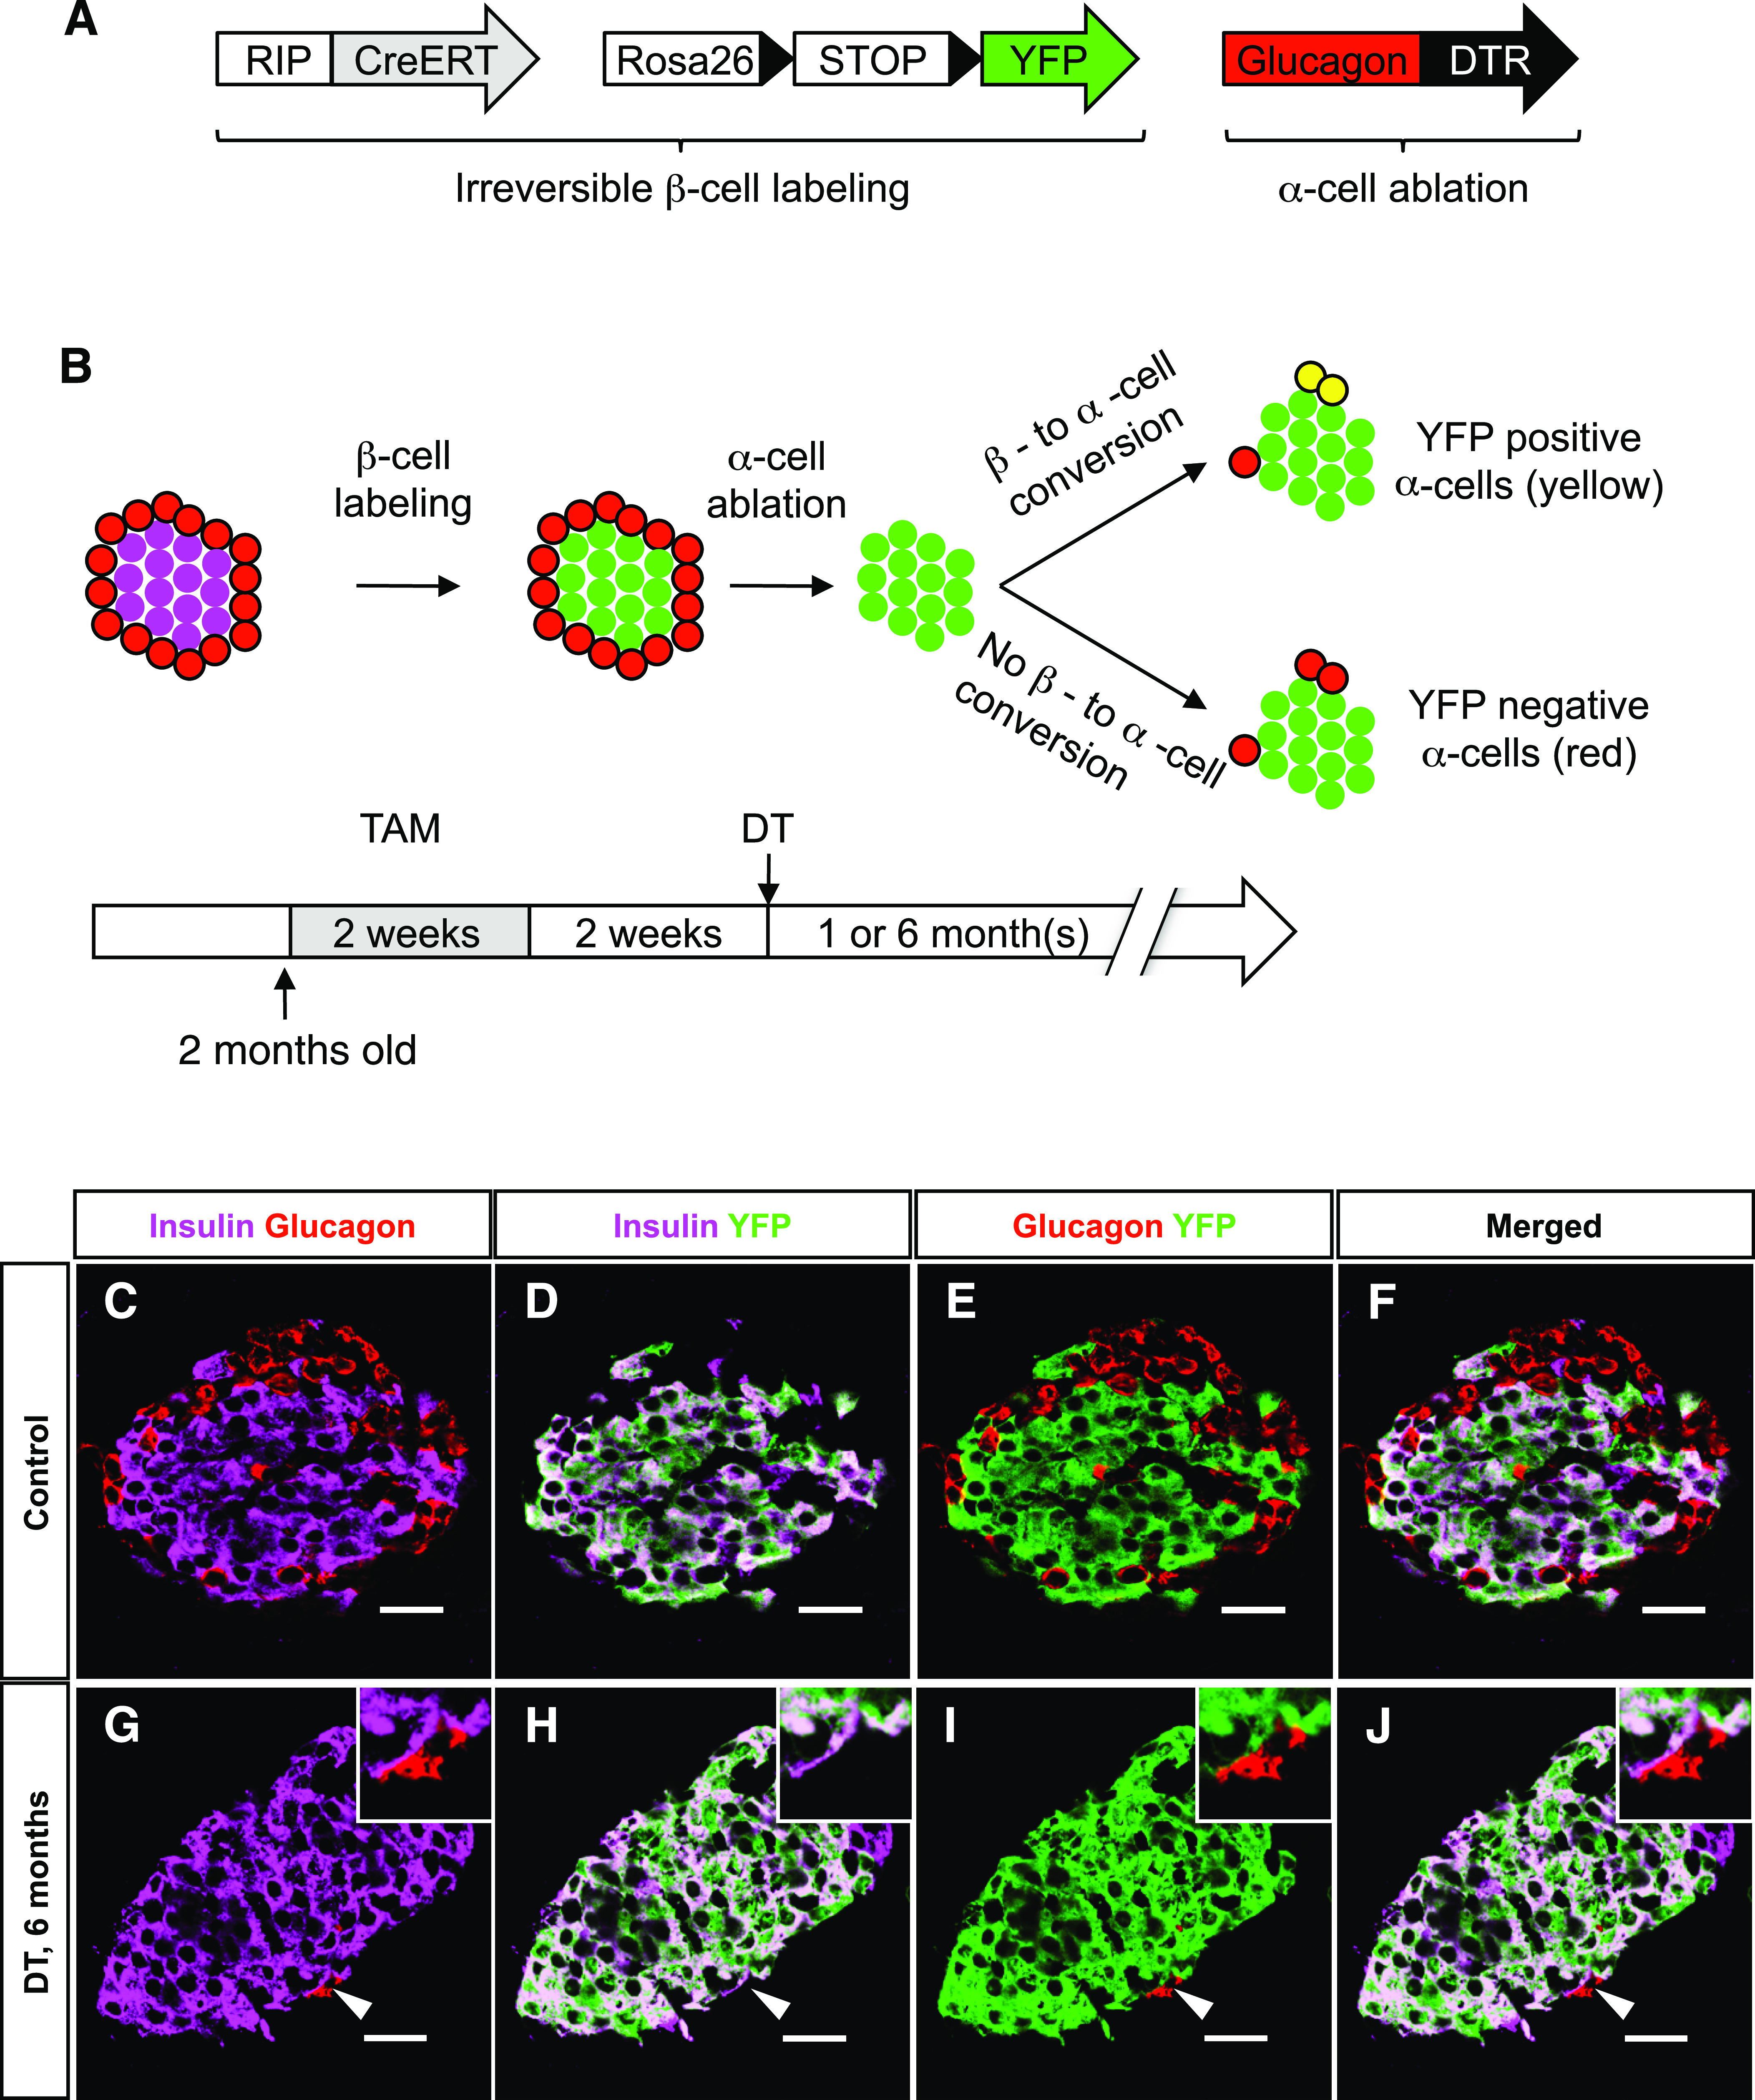
Newly formed α-cells after ablation are not reprogrammed β-cells. A: Transgenes required for the inducible β-cell tracing and α-cell ablation. B: Experimental design for irreversible labeling of adult β-cells before α-cell ablation. C–F: Almost all β-cells were YFP-labeled after tamoxifen (TAM) administration in control animals (DT-untreated). G–J: At 6 months after DT, none of the very rare glucagon-expressing cells were YFP-positive (the arrowhead points to one α-cell, also shown in the top right inset at higher magnification). Scale bars = 20 μm. (A high-quality digital representation of this figure is available in the online issue.)
Taken together, these observations suggest that the few newly formed α-cells in Glucagon-DTR mice mainly arise within islets retaining at least one α-cell after DT, likely through α-cell replication (one event, on average, between 1 and 6 months). Several elements support this view: 1) the number of α-cell–containing islets did not increase with time after ablation, 2) the number of glucagon-positive cells increased by a factor of two only in α-cell–containing islets, and 3) the β-cell lineage-tracing revealed that β-cells do not transdifferentiate spontaneously into α-cells.
Near-total α-cell loss does not prevent diabetes.
Inhibition of glucagon signaling (GcgR−/− mice) was recently shown to prevent STZ-induced diabetes (6). We thus assessed whether near-total α-cell ablation in Glucagon-DTR mice affects or prevents hyperglycemia. For this purpose, Glucagon-DTR mice were treated 1 week after DT with a high dose of STZ (200 μg/g) to induce ∼90% β-cell removal (Fig. 6A–G). Interestingly, mice that had only residual α-cells (arrowheads in Fig. 6D and G) became overtly hyperglycemic and lost weight after β-cell destruction, like diabetic mice with normal α-cell mass (Fig. 6H and I). Similarly, the simultaneous coablation of β- and α-cells (in Glucagon-DTR, RIP-DTR double transgenic mice) (13) also induced hyperglycemia and cachexia (Supplementary Fig. 7). These results show that near-total α-cell ablation does not prevent diabetes, contrary to what happens in GcgR−/− mice (6). This was consistent with the unaltered glucagon secretion and counter-regulatory response after removal of 98% of α-cells under physiologic conditions.
FIG. 6.
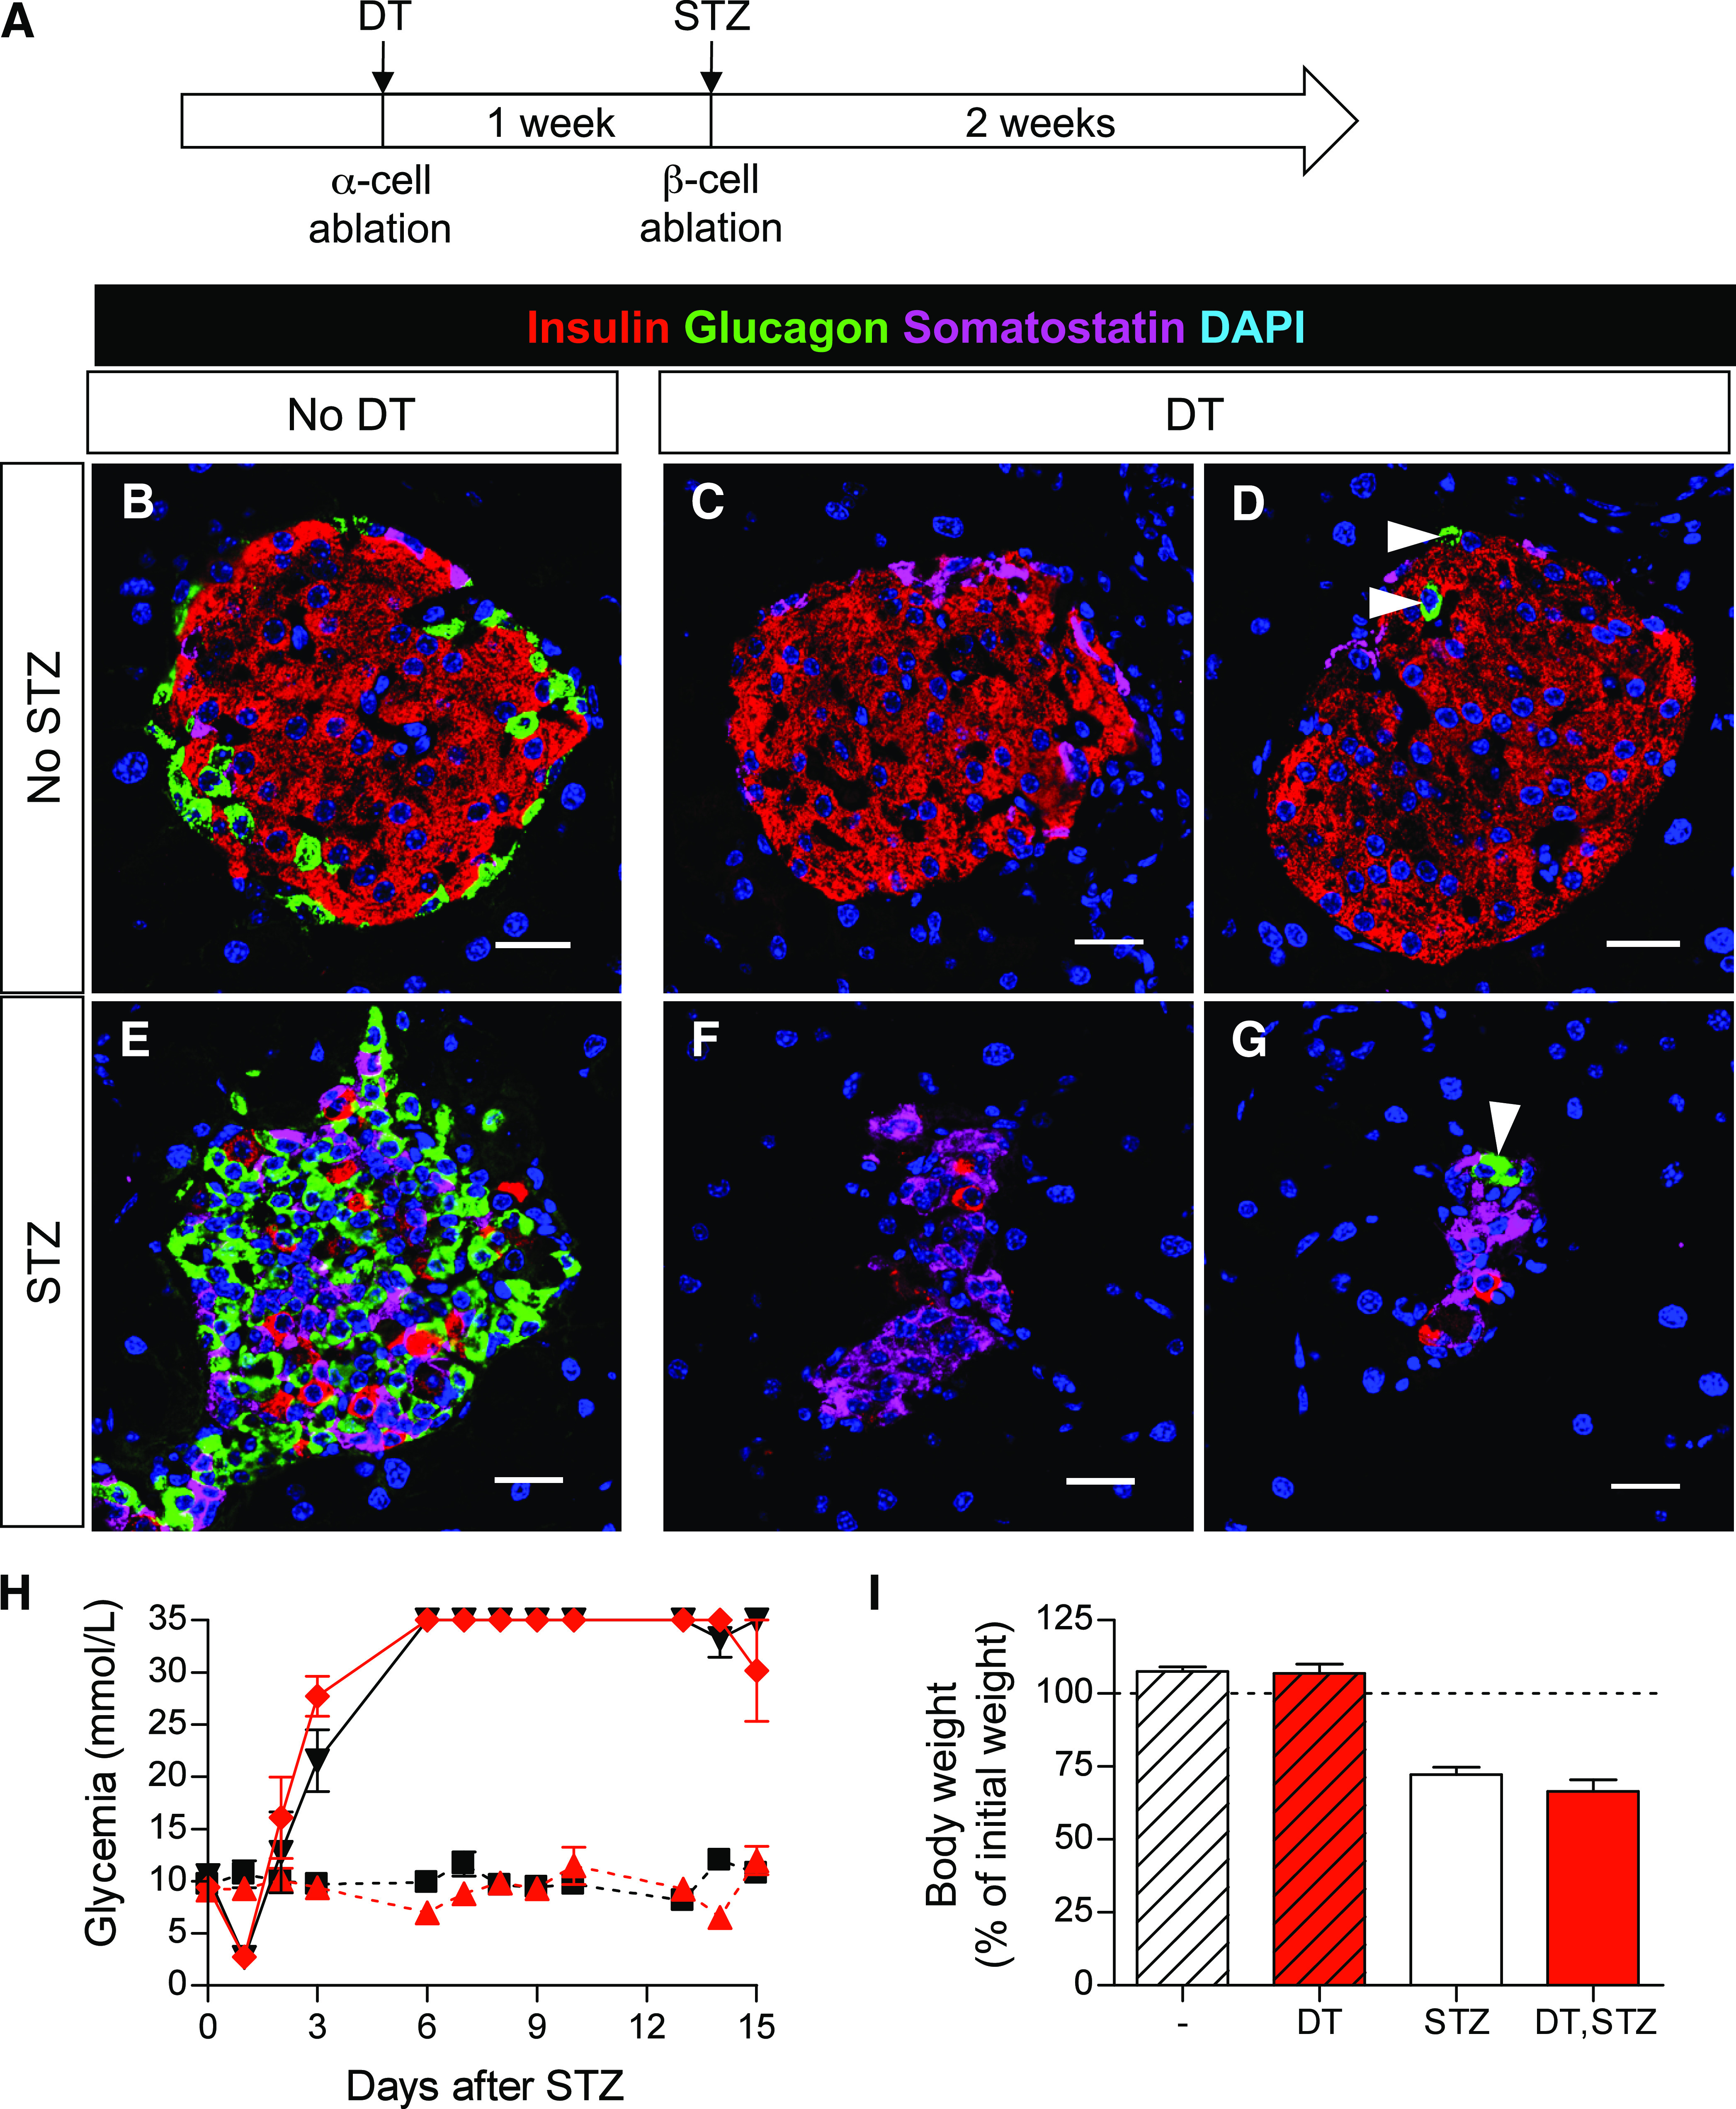
α-Cell ablation does not prevent streptozotocin (STZ)-induced diabetes. A: Experimental design. One high dose of STZ (200 μg/g of mouse weight) was administered to Glucagon-DTR mice to ablate β-cells 1 week after massive DT-mediated α-cell removal. Animals were killed 2 weeks after STZ. B–G: Confocal images of pancreatic sections show DT-mediated α-cell ablation and STZ-mediated β-cell removal. White arrowheads show remaining α-cells after DT. Scale bars = 20 μm. H: Follow up of glycemia. All STZ-treated mice become hyperglycemic irrespective of DT administration. By contrast, animals that did not receive STZ remain normoglycemic (red ♦: Glucagon-DTR mice treated with both DT and STZ, n = 6; black ▼: Glucagon-DTR mice treated only with STZ, n = 6; black ■: untreated Glucagon-DTR mice, n = 3; red ▲: Glucagon-DTR mice treated only with DT). I: Body weight 15 days after STZ. All mice treated with STZ lose weight and develop typical diabetes symptoms. (A high-quality digital representation of this figure is available in the online issue.)
DISCUSSION
We have shown that near-total α-cell loss in adult mice has little effect on glucagonemia and no apparent effect on β-cell function or glucose homeostasis. This reveals that 2 to 4% of the normal α-cell mass is astonishingly sufficient to produce enough glucagon to ensure glycemic control under basal conditions. Massive α-cell loss is associated with a rapid enhancement of glucagon sensitivity, which allows increased glucose mobilization, even if the decrease in glucagonemia is very mild.
A corollary of this observation is that the normal amount of pancreatic α-cells apparently exceeds the physiologic requirement for proper blood glucose homeostasis. Indeed, the total glucagon found in the pancreas when only 2% of the α-cells remain was sufficient to maintain normoglucagonemia. A simple calculation reveals that if all pancreatic glucagon found 1 week after α-cell loss (∼7,400 pg; Supplementary Table 2) were entirely released at once into the circulation, glucagonemia would be more than 120-fold higher than the normal value of about 60 pg (Supplementary Table 2). The amount of glucagon measured in plasma after 98% α-cell ablation (∼40 pg; Supplementary Table 2) only represents 0.5% of the residual pancreatic glucagon content produced by the remaining 2% of α-cells (7,400 pg). This suggests that the intracellular glucagon store in the remaining α-cells is, in principle, sufficient to maintain basal glucagonemia. However, because plasma glucagon has a half-life of only 2 min (20–22), sustained glucagon biosynthesis after α-cell ablation is mandatory to maintain glucagonemia and pancreatic content over time. Indeed, in absence of glucagon biosynthesis, all pancreatic glucagon stocks found after DT should theoretically be finished within ∼6 h vs. ∼17 days in control mice with normal α-cell mass (estimated considering the observed pancreatic glucagon contents and glucagon half-life). In agreement with this, we found that although the number of α-cells had not increased 1 month after the ablation, the glucagon content per cell had doubled. In this situation, the lack of response of the α-cell–ablated pancreata to arginine suggests that the few remaining α-cells have reached a maximum secretion capacity or that glucagon biosynthesis is rate limiting, or both. The inability of Glucagon-DTR mice to ensure normoglucagonemia 1 week after DT, despite having sufficient pancreatic glucagon, indicates that glucagon secretion is limited; however, because two-thirds of normal plasma glucagon level is ensured by just 2% of normal α-cell mass, this indicates that α-cells display a huge secretory capacity. This property may contribute to the excessive glucagon secretion observed in diabetic patients. Alternatively, our observations also suggest that in normal conditions, with a normal α-cell mass, glucagon secretion (relative to α-cell number) is very low.
It is therefore intriguing to observe that α-cells are so numerous. They may somewhat be required for proper endocrine pancreas development. Alternatively, or in addition, their numbers may reflect the effect of selection pressure during evolution: most species must often thrive through long periods of sustained starvation, and glucagon facilitates glucose mobilization during food deprivation. In the latter perspective, the massive loss of α-cells, which we report here, was associated with a rapid enhancement of glucagon sensitivity, which allows an increased glucose mobilization likely through glycogenolysis, rather than gluconeogenesis, as revealed with glucose tolerance tests and a tendency to express higher levels of liver GcgR and GP.
Interestingly, we have seen that extreme α-cell removal in stressful situations, such as prolonged starvation and insulin-induced hypoglycemia, has no obvious consequences on fasting blood glucose and normoglycemia recovery. Furthermore, Unger and colleagues (6) reported that inhibition of glucagon signaling prevented STZ-induced diabetes in mice. By contrast, we show here that near-total α-cell ablation does not prevent hyperglycemia, indicating that a minimal fraction of the α-cell mass is sufficient to mediate normal glucagon signaling. Together, these combined observations strongly suggest that a total α-cell loss, or glucagon-signaling blockade, would be required to prevent hyperglycemia and diabetes after massive β-cell destruction.
Cell–cell signaling between α- and β-cells is thought to be essential for proper blood glucose homeostasis (4), but the direct, physical influence of α-cells on glucose-stimulated insulin release has never been studied in vivo. We know β-cell activity is independent of glucagon signaling because it remains unaltered upon treatment with GcgR antagonists or in GcgR−/− mice (8,23), that is, in situations where α-cells are abundant or expanded. In DT-treated Glucagon-DTR mice, however, almost all islets are totally devoid of α-cells, which prevents any paracrine intraislet direct interaction between these two cell types. Yet, glucose homeostasis in this situation is not affected under basal conditions, thus suggesting that local α-cell–β-cell interactions are dispensable for adequate β-cell function. This conclusion could not be reached in previous studies because the animal model reported here is the first in which adult mice have nearly normal glucagonemia, yet lack most α-cells.
α-Cell hyperplasia has been reported in patients bearing mutations in the GcgR gene (24,25) and in mice exhibiting glucagon deficiency, such as in glucagon−/−, GcgR−/−, and PC2 −/− mice, as well as in wild-type mice treated with GcgR-neutralizing antibody (7,8,26–29). In all these situations, the formation of new α-cells likely represents a compensatory response to deficient glucagon signaling.
The origin of newly formed α-cells in glucagon-deficient conditions is not known. The continuous emergence of α-cells from pancreatic ductal Neurog-3–expressing cells was reported in mice expressing the β-cell–specific transcription factor paired box gene 4 (PAX4) in embryonic α-cells (30). In these animals, α-cells reprogram toward the β-cell phenotype upon PAX4 misexpression, leading to a substantial reduction in postnatal α-cell numbers. The authors proposed that glucagon deficiency was the driving force for the continuous appearance of α-cells, yet glucagonemia was not measured in their study, and the α-cell deficit was similar to the one observed here in DT-treated Glucagon-DTR mice. By contrast, there is no evidence for ductal α-cell neogenesis in Glucagon-DTR mice: the rare α-cells found after DT were never preferentially located within or near ducts. This difference may be attributed to the perturbed metabolic status of mice over-expressing PAX4, which exhibit strong β-cell hyperplasia and very high insulinemia, likely resulting in an abnormally elevated insulin-to-glucagon balance.
We recently reported that adult α-cells reprogram to insulin production after extreme β-cell ablation (13). Here, we explored whether β-cells can reprogram to produce glucagon after massive α-cell loss and failed to observe any such β- to α-cell conversion. However, the interconversion between α- and β-cells may occur in both directions when conditions are appropriate. Indeed, it has been shown that 1) the ectopic expression of the α-cell–specific transcription factor ARX or 2) the conditional inactivation of the DNA methyltransferase gene Dnmt1 in embryonic β-cells converts them to the α-cell phenotype (31,32).
After β-cell destruction in RIP-DTR mice, ∼5% of adult α-cells spontaneously undergo cell reprogramming; this limited number of cells probably determines the extent of β-cell recovery in RIP-DTR transgenic mice (13). This observation alone makes us speculate that promoting the conversion of most α-cells to β-cells, if it could be achieved, might represent an attractive therapeutic strategy for diabetes, once we learn how to modulate autoimmunity. In this regard, it was unclear what the minimal α-cell mass is to ensure enough glucagon production should α-cell reprogramming become a therapy to treat diabetes. The present work reveals that 2 to 4% of functional α-cells is sufficient to guarantee the glycemic control, at least under basal conditions. Reduction of the α-cell pool by reprogramming to β-cells could have the additional beneficial effect of preventing the glucagon excess typical of type 1 diabetes, which enhances the risk for hyperglycemia and ketoacidosis in patients afflicted with the disease (5).
RESEARCH DESIGN AND METHODS
Mice.
The Glucagon-DTR transgenic mice were generated by pronuclear injection, as described (13). Briefly, heparin-binding epidermal growth factor-like growth factor (i.e., the natural receptor to DT, DTR) cDNA was subcloned downstream of a 1.6-kb-long rat glucagon promoter fragment (14). The RIP-DTR, RIP-CreERT, and R26-YFP mice were previously described (33,34). Animals were housed and cared for according to the guidelines of the Direction Générale de la Santé of the Canton de Genève.
Glucose, pyruvate, insulin tolerance tests.
Glucose (1.1 g/kg of body wt; 84100, Sigma, St. Louis, MO), pyruvate (2 g/kg; P2256, Sigma) and glucagon (1 mg/kg; H-6790, Bachem, Bubendorf, Switzerland) were injected intraperitoneally after overnight fasting, when indicated. Insulin (0.5 units/kg; Actrapid, Novo Nordisk A/S, Bagsværd, Denmark) was injected after a 6-h fast.
Pancreas perfusion.
Mice were anesthetized with sodium pentothal (100 mg/kg i.p.) and prepared for pancreas perfusion, as described (35,36). Pancreata were perfused with modified Krebs-Ringer HEPES buffer containing 4% dextran (Pharmacosmos, Holbaek, Denmark) and 0.25% BSA at 37°C; the perfusion rate was 1.5 mL/min. For equilibration, the pancreas was perfused for 30 min before collecting the efflux. Glucose and arginine were added to the perfusion buffer as indicated in Figs. 2G–H and 3C. Insulin was measured using an enzyme immunoassay kit (SPI-BIO, Massy, France). Glucagon was determined by radioimmunoassay using an antiglucagon antibody (Dako Diagnostics, Zug, Switzerland), as described previously (35).
Hormone measurements, immunofluorescence, and morphometric analyses.
Pancreatic glucagon and insulin (immunoassays) and morphometric analyses were performed as described (13,37,38). Paraffin and cryostat sections were 5 μm or 10 μm thick, respectively. The antibodies used were: guinea pig anti-porcine insulin (1:400, Dako), mouse anti-porcine glucagon (1:1,000, Sigma), mouse anti-somatostatin (1:200, Beta Cell Biology Consortium, Nashville, TN), rabbit anti-pancreatic polypeptide (1:200, Bachem), goat anti–glucagon-like peptide 1 (1:200, Santa Cruz Biotechnology, Santa Cruz, CA), rabbit anti-green fluorescent protein (1:200, Molecular Probes Inc., Eugene, OR), and anti-phosphohistone H3 (1:400, Millipore Corp., Billerica, MA). Secondary antibodies were coupled to Alexa Fluor dyes 488, 568, or 647 (Molecular Probes, Inc.), to Cy3, or to Cy5 (Jackson ImmunoResearch Laboratories, Inc., West Grove, PA). Transferase-mediated dUTP nick-end labeling (TUNEL) assay was performed according to manufacturer’s instructions (Apoptag, Chemicon, Temecula, CA).
Sections were examined with a Leica TCS SPE confocal microscope (Leica Microsystems, Bannockburn, IL).
DT, STZ, and tamoxifen treatments.
DT (D0564, Sigma) was given to 2-month-old mice in three intraperitoneal injections during 5 days, the second and third doses on days 3 and 5, respectively. Each injection (200 μL) contained 504 ng of DT in 0.9% NaCl.
STZ (S0130; Sigma) was administrated in one injection (200 μg/g i.p.) after a 4-h fast.
RIP-CreERT mice were given a freshly prepared tamoxifen suspension with a gastric catheter, as previously described (13).
Quantitative PCR.
Liver samples were frozen in liquid nitrogen and kept at −80°C until use. Fragments of 30 μg were subsequently used for total RNA isolation using the Qiagen RNeasy Mini kit (Qiagen, Valencia, CA) with small modifications: due to high glycogen content in hepatocytes, we used 50% ethanol instead of 70% ethanol, as recommended. Four samples per group were analyzed in triplicates, and in a minimum of three independent runs. The quantitative PCR was performed as previously described by us (13), using the following primers:G6Pase forward (5′-GTGGCTGGAGTCTTGTCAGG-3′)/reverse (5′-ATTGTAGATGCCCCGGATG-3′),PEPCK forward (5′-GATGACATTGCCTGGATGAA-3′)/reverse (5′-CGTTTTCTGCTGGGTTGATAGCC-3′),GcgR forward (5′-ACCAATGCCACCACAACC-3′)/reverse (5′-GGAGTACTTGTCGAAGGTTCTGTTAC-3′), andGP forward (5′-ATCAACCCATCCTCCATGTT-3′)/reverse (5′-ACATGCAGGCAGTTCAGAAG-3′).
Blood samples.
Blood samples were collected from the tail vein of mice fasted overnight.
Statistical analyses.
One- or two-tailed Mann-Whitney U tests were used when indicated, using GraphPad Prism 4.00 software (GraphPad, San Diego, CA). Error bars in the figures represent the SEM.
Supplementary Material
ACKNOWLEDGMENTS
P.L.H. is supported by grants from the Juvenile Diabetes Research Foundation, the National Institutes of Health/National Institute of Diabetes and Digestive and Kidney Diseases (Beta Cell Biology Consortium), the European Union (FP7/2007-2013, for the Innovative Medicine Initiative No. 115005), and the Swiss National Science Foundation (National Centers of Competence in Research “Frontiers-in-Genetics”, and National Research Programme [NRP] 63 “Stem Cells and Regenerative Medicine”). P.M. is supported by grants from the Swiss National Science Foundation, the Juvenile Diabetes Research Foundation, and the European Union. C.B.W. was supported by a grant from the Swiss National Science Foundation.
No potential conflicts of interest relevant to this article were reported.
F.T. conceived and performed the experiments and wrote the manuscript. N.D., S.C., and A.W. performed the experiments. B.T., P.M., and C.B.W. participated in discussion and contributed to writing the manuscript. P.L.H. conceived the experiments and wrote the manuscript.
The authors thank Olivier Fazio, Barbara Pinheiro-Tonneau, Carine Gysler, Christian Vesin, and Dorothée Caille (all at Geneva University Medical School, Geneva, Switzerland) for their skillful technical assistance; Asllan Gjinovci (Geneva University Medical School, Geneva, Switzerland) for pancreas perfusion and Frédéric Preitner (Center for Integrative Genomics, Lausanne, Switzerland) for hormone level measurements in the intestine; and Pierre Vassalli (Geneva University Medical School, Geneva, Switzerland), Jacques Philippe (Geneva University Hospital, Geneva, Switzerland), and Valérie McLin (Geneva University Hospital, Geneva, Switzerland) for discussions and comments on the manuscript.
Footnotes
This article contains Supplementary Data online at http://diabetes.diabetesjournals.org/lookup/suppl/doi:10.2337/db11-0876/-/DC1.
REFERENCES
- 1.Bosco D, Armanet M, Morel P, et al. Unique arrangement of alpha- and beta-cells in human islets of Langerhans. Diabetes 2010;59:1202–1210 [DOI] [PMC free article] [PubMed] [Google Scholar]
- 2.Bosco D, Meda P, Morel P, et al. Expression and secretion of alpha1-proteinase inhibitor are regulated by proinflammatory cytokines in human pancreatic islet cells. Diabetologia 2005;48:1523–1533 [DOI] [PubMed] [Google Scholar]
- 3.Gromada J, Franklin I, Wollheim CB. Alpha-cells of the endocrine pancreas: 35 years of research but the enigma remains. Endocr Rev 2007;28:84–116 [DOI] [PubMed] [Google Scholar]
- 4.Unger RH, Orci L. Paracrinology of islets and the paracrinopathy of diabetes. Proc Natl Acad Sci U S A 2010;107:16009–16012 [DOI] [PMC free article] [PubMed] [Google Scholar]
- 5.Fanelli CG, Porcellati F, Rossetti P, Bolli GB. Glucagon: the effects of its excess and deficiency on insulin action. Nutr Metab Cardiovasc Dis 2006;16(Suppl. 1):S28–S34 [DOI] [PubMed] [Google Scholar]
- 6.Lee Y, Wang MY, Du XQ, Charron MJ, Unger RH. Glucagon receptor knockout prevents insulin-deficient type 1 diabetes in mice. Diabetes 2011;60:391–397 [DOI] [PMC free article] [PubMed] [Google Scholar]
- 7.Parker JC, Andrews KM, Allen MR, Stock JL, McNeish JD. Glycemic control in mice with targeted disruption of the glucagon receptor gene. Biochem Biophys Res Commun 2002;290:839–843 [DOI] [PubMed] [Google Scholar]
- 8.Gelling RW, Du XQ, Dichmann DS, et al. Lower blood glucose, hyperglucagonemia, and pancreatic alpha cell hyperplasia in glucagon receptor knockout mice. Proc Natl Acad Sci U S A 2003;100:1438–1443 [DOI] [PMC free article] [PubMed] [Google Scholar]
- 9.Vuguin PM, Kedees MH, Cui L, et al. Ablation of the glucagon receptor gene increases fetal lethality and produces alterations in islet development and maturation. Endocrinology 2006;147:3995–4006 [DOI] [PMC free article] [PubMed] [Google Scholar]
- 10.Furuta M, Yano H, Zhou A, et al. Defective prohormone processing and altered pancreatic islet morphology in mice lacking active SPC2. Proc Natl Acad Sci U S A 1997;94:6646–6651 [DOI] [PMC free article] [PubMed] [Google Scholar]
- 11.Furuta M, Zhou A, Webb G, et al. Severe defect in proglucagon processing in islet A-cells of prohormone convertase 2 null mice. J Biol Chem 2001;276:27197–27202 [DOI] [PubMed] [Google Scholar]
- 12.Hancock AS, Du A, Liu J, Miller M, May CL. Glucagon deficiency reduces hepatic glucose production and improves glucose tolerance in adult mice. Mol Endocrinol 2010;24:1605–1614 [DOI] [PMC free article] [PubMed] [Google Scholar]
- 13.Thorel F, Népote V, Avril I, et al. Conversion of adult pancreatic alpha-cells to beta-cells after extreme beta-cell loss. Nature 2010;464:1149–1154 [DOI] [PMC free article] [PubMed] [Google Scholar]
- 14.Herrera PL. Adult insulin- and glucagon-producing cells differentiate from two independent cell lineages. Development 2000;127:2317–2322 [DOI] [PubMed] [Google Scholar]
- 15.Lee YC, Asa SL, Drucker DJ. Glucagon gene 5′-flanking sequences direct expression of simian virus 40 large T antigen to the intestine, producing carcinoma of the large bowel in transgenic mice. J Biol Chem 1992;267:10705–10708 [PubMed] [Google Scholar]
- 16.Huypens P, Ling Z, Pipeleers D, Schuit F. Glucagon receptors on human islet cells contribute to glucose competence of insulin release. Diabetologia 2000;43:1012–1019 [DOI] [PubMed] [Google Scholar]
- 17.Kawamori D, Kurpad AJ, Hu J, et al. Insulin signaling in alpha cells modulates glucagon secretion in vivo. Cell Metab 2009;9:350–361 [DOI] [PMC free article] [PubMed] [Google Scholar]
- 18.Quesada I, Tudurí E, Ripoll C, Nadal A. Physiology of the pancreatic alpha-cell and glucagon secretion: role in glucose homeostasis and diabetes. J Endocrinol 2008;199:5–19 [DOI] [PubMed] [Google Scholar]
- 19.Desgraz R, Herrera PL. Pancreatic neurogenin 3-expressing cells are unipotent islet precursors. Development 2009;136:3567–3574 [DOI] [PMC free article] [PubMed] [Google Scholar]
- 20.Balage M, Grizard J, Houlier ML, Bonnet Y, Sallas M, Selle A. Glucagon kinetics in growing rats fed different levels of protein and/or energy. Reprod Nutr Dev 1984;24:251–263 [DOI] [PubMed] [Google Scholar]
- 21.Balage M, Grizard J. Relationship between plasma glucagon disappearance and tissue uptake in rats. Reprod Nutr Dev 1986;26:31–38 [DOI] [PubMed] [Google Scholar]
- 22.Kervran A, Dubrasquet M, Blache P, Martinez J, Bataille D. Metabolic clearance rates of oxyntomodulin and glucagon in the rat: contribution of the kidney. Regul Pept 1990;31:41–52 [DOI] [PubMed] [Google Scholar]
- 23.Moens K, Berger V, Ahn JM, et al. Assessment of the role of interstitial glucagon in the acute glucose secretory responsiveness of in situ pancreatic beta-cells. Diabetes 2002;51:669–675 [DOI] [PubMed] [Google Scholar]
- 24.Henopp T, Anlauf M, Schmitt A, et al. Glucagon cell adenomatosis: a newly recognized disease of the endocrine pancreas. J Clin Endocrinol Metab 2009;94:213–217 [DOI] [PubMed] [Google Scholar]
- 25.Zhou C, Dhall D, Nissen NN, Chen CR, Yu R. Homozygous P86S mutation of the human glucagon receptor is associated with hyperglucagonemia, alpha cell hyperplasia, and islet cell tumor. Pancreas 2009;38:941–946 [DOI] [PMC free article] [PubMed] [Google Scholar]
- 26.Vincent M, Guz Y, Rozenberg M, et al. Abrogation of protein convertase 2 activity results in delayed islet cell differentiation and maturation, increased alpha-cell proliferation, and islet neogenesis. Endocrinology 2003;144:4061–4069 [DOI] [PubMed] [Google Scholar]
- 27.Hayashi Y, Yamamoto M, Mizoguchi H, et al. Mice deficient for glucagon gene-derived peptides display normoglycemia and hyperplasia of islet alpha-cells but not of intestinal L-cells. Mol Endocrinol 2009;23:1990–1999 [DOI] [PMC free article] [PubMed] [Google Scholar]
- 28.Gu W, Yan H, Winters KA, et al. Long-term inhibition of the glucagon receptor with a monoclonal antibody in mice causes sustained improvement in glycemic control, with reversible alpha-cell hyperplasia and hyperglucagonemia. J Pharmacol Exp Ther 2009;331:871–881 [DOI] [PubMed] [Google Scholar]
- 29.Yan H, Gu W, Yang J, et al. Fully human monoclonal antibodies antagonizing the glucagon receptor improve glucose homeostasis in mice and monkeys. J Pharmacol Exp Ther 2009;329:102–111 [DOI] [PubMed] [Google Scholar]
- 30.Collombat P, Xu X, Ravassard P, et al. The ectopic expression of Pax4 in the mouse pancreas converts progenitor cells into alpha and subsequently beta cells. Cell 2009;138:449–462 [DOI] [PMC free article] [PubMed] [Google Scholar]
- 31.Collombat P, Hecksher-Sørensen J, Krull J, et al. Embryonic endocrine pancreas and mature beta cells acquire alpha and PP cell phenotypes upon Arx misexpression. J Clin Invest 2007;117:961–970 [DOI] [PMC free article] [PubMed] [Google Scholar]
- 32.Dhawan S, Georgia S, Tschen SI, Fan G, Bhushan A. Pancreatic β cell identity is maintained by DNA methylation-mediated repression of Arx. Dev Cell 2011;20:419–429 [DOI] [PMC free article] [PubMed] [Google Scholar]
- 33.Dor Y, Brown J, Martinez OI, Melton DA. Adult pancreatic beta-cells are formed by self-duplication rather than stem-cell differentiation. Nature 2004;429:41–46 [DOI] [PubMed] [Google Scholar]
- 34.Srinivas S, Watanabe T, Lin CS, et al. Cre reporter strains produced by targeted insertion of EYFP and ECFP into the ROSA26 locus. BMC Dev Biol 2001;1:4. [DOI] [PMC free article] [PubMed] [Google Scholar]
- 35.Franklin I, Gromada J, Gjinovci A, Theander S, Wollheim CB. Beta-cell secretory products activate alpha-cell ATP-dependent potassium channels to inhibit glucagon release. Diabetes 2005;54:1808–1815 [DOI] [PubMed] [Google Scholar]
- 36.Maechler P, Gjinovci A, Wollheim CB. Implication of glutamate in the kinetics of insulin secretion in rat and mouse perfused pancreas. Diabetes 2002;51(Suppl. 1):S99–S102 [DOI] [PubMed] [Google Scholar]
- 37.Herrera PL, Huarte J, Sanvito F, Meda P, Orci L, Vassalli JD. Embryogenesis of the murine endocrine pancreas; early expression of pancreatic polypeptide gene. Development 1991;113:1257–1265 [DOI] [PubMed] [Google Scholar]
- 38.Strom A, Bonal C, Ashery-Padan R, et al. Unique mechanisms of growth regulation and tumor suppression upon Apc inactivation in the pancreas. Development 2007;134:2719–2725 [DOI] [PubMed] [Google Scholar]
Associated Data
This section collects any data citations, data availability statements, or supplementary materials included in this article.