Abstract
Vitamin C and its degradation products participate in chemical modifications of proteins in vivo through non-enzymatic glycation (Maillard reaction) and formation of different products called advanced glycation end products. Vitamin C levels are particularly high in selected tissues, such as lens, brain and adrenal gland, and its degradation products can inflict substantial protein damage via formation of advanced glycation end products. However, the pathways of in vivo vitamin C degradation are poorly understood. Here we have determined the levels of vitamin C oxidation and degradation products dehydroascorbic acid, 2,3-diketogulonic acid, 3-deoxythreosone, xylosone, and threosone in the human lens using o-phenylenediamine to trap both free and protein-bound adducts. In the protein-free fraction and water-soluble proteins (WSP), all five listed degradation products were identified. Dehydroascorbic acid, 2,3-diketogulonic acid, and 3-deoxythreosone were the major products in the protein-free fraction, whereas in the WSP, 3-deoxythreosone was the most abundant measured dicarbonyl. In addition, 3-deoxythreosone in WSP showed positive linear correlation with age (p < 0.05). In water-insoluble proteins, only 3-deoxythreosone and threosone were detected, whereby the level of 3-deoxythreosone was ∼20 times higher than the level of threosone. The identification of 3-deoxythreosone as the major degradation product bound to human lens proteins provides in vivo evidence for the non-oxidative pathway of dehydroascorbate degradation into erythrulose as a major pathway for vitamin C degradation in vivo.
Keywords: G Protein-coupled Receptors (GPCR), G Proteins, Guanine Nucleotide Exchange Factor (GEF), Heterotrimeric G Proteins, RGS Proteins, GPR Motif, Receptor Signaling Complex, Signal Transduction
Introduction
The Maillard reaction or nonenzymatic glycation is a complex series of reactions initiated by reducing carbohydrates and nucleophilic side chains of proteins. The result of this reaction is a plethora of structurally different compounds covalently bound to the proteins collectively called advanced glycation end products (AGEs).3
Growing evidence has shown that ascorbic acid (ASA) can also contribute to nonenzymatic modification of proteins, especially in the lens, where its concentration can reach 3 mm and contribute to protein aggregation and cataractogenesis (1). The similarity between modifications of lens proteins by ASA and those in aged human lenses and cataract provides a solid basis for this concept (2–4). This hypothesis was further supported with a mouse model in which the human sodium-dependent vitamin C transporter 2 was overexpressed in lens, thereby increasing the influx of ASA that led to marked lens browning and AGE accumulation (5).
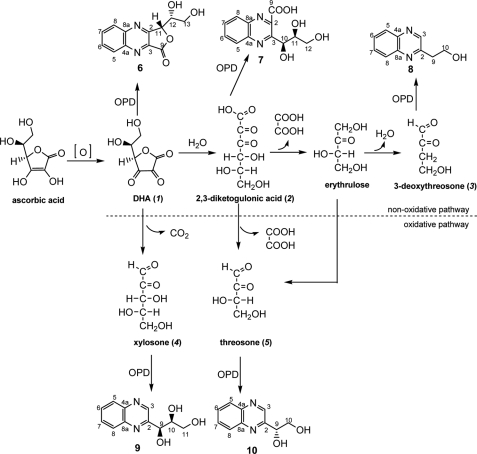
The chemical pathways by which ASA generates glycating agents probably originate from its oxidized form (i.e. dehydroascorbic acid (DHA; 1)), which can react with nucleophiles directly or be rearranged into even more reactive forms. Major DHA degradation products identified are 2,3-diketogulonic acid (2,3-DKG), which further degrades into l-erythrulose and oxalate (6), l-threo-pentos-2-ulose (l-xylosone) (7), and 3,4-dihydroxy-2-oxobutanal (l-threosone) (8). In addition, Lederer and co-workers (9) indirectly demonstrated 4-hydroxy-2-oxobutanal (3-deoxythreosone) as a possible dicarbonyl compound formed by DHA degradation (Scheme 1). Several AGEs were identified as a result of ASA or DHA reaction with proteins, such as CML (10), pentosidine (11), and vesperlysine A (12). However, because other sugars and metabolites also contribute to their formation and specific probes for ascorbate-derived AGEs are not available, it has been a challenge to evaluate the relative role of ascorbic acid in AGE formation in vivo.
SCHEME 1.
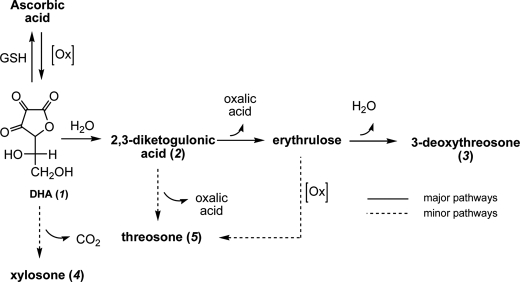
Oxidative and non-oxidative degradation pathways of DHA (1) into reactive dicarbonyls according to Reihl et al. (9), 2,3-DKG (2), 3-deoxythreosone (3), xylosone (4), and threosone (5), and their proposed derivatization products with OPD into corresponding quinoxalines (6–10).
Dicarbonyls are important intermediates of the Maillard reaction, which preferentially react with arginine residues. They can also react with other protein residues (e.g. lysine) to form more or less stable reversible products, and they can serve as precursors of AGEs or mediators of lysine oxidation into allysine (13) or arginine degradation into ornithine (14).
An extensive study of the arginine-glyoxal model system by Glomb and Lang (15) showed that in the early stage of the reaction, only one reversible product could be identified (i.e. 5-(4,5-dihydroxy-2-imino-1-imidazolidinyl)norvaline) (16). Lo et al. (16) demonstrated that 30% of methylglyoxal, another physiological dicarbonyl that can also form from ascorbic acid, binds reversibly to BSA after 4 days of incubation. Despite these and several other studies on reversible binding of dicarbonyls to proteins (17, 18), little is known of the amounts of reversible products formed during reactions of dicarbonyls with proteins in vivo, many of which could play important roles in protein destabilization.
Here we measured the level of dicarbonyl compounds formed by the major vitamin C oxidation product (DHA) and its subsequent degradation products 2,3-DKG, 3-deoxythreosone, xylosone, and threosone in human lenses as well as the amount of these dicarbonyls reversibly bound to water-soluble (WSP) and water insoluble proteins (WIP).
EXPERIMENTAL PROCEDURES
Materials
Reagents were obtained from Sigma unless indicated otherwise. Deionized water (18.2 MΩ/cm2) was used for all experiments. For liquid chromatography electron spray tandem mass spectrometry (LC-ESI-MS/MS) experiments, ultrapure solvents were obtained from Burdick & Jackson (Muskegon, MI). Fructosyl-lysine, 3-deoxythreosone-quinoxaline (8), and threosone-quinoxaline (10) were prepared as described previously (19–21).
NMR
NMR spectra were recorded with a Bruker AV 600 spectrometer operating at 150.91 MHz for 13C and 600.13 MHz for 1H. The spectra were measured in CD3OD solution at 25 °C. Chemical shifts in parts per million were referenced to SiMe4.
Semipreparative Reversed Phase (RP) High Performance Liquid Chromatography (HPLC)
Preparative HPLC was performed with a Varian ProStar HPLC system equipped with a Eurospher 100 C-18 semipreparative column (5 μm; 8 × 250 mm) (flow rate 1.0 ml/min; λ = 350 nm). HPLC solvents were as follows: solvent A (10% methanol in 0.1% trifluoroacetic acid (TFA) in water), solvent B (40% methanol in 0.1% TFA in water), and solvent C (75% methanol in 0.1% TFA in water).
Synthesis of Quinoxalines from DHA Degradation Products
DHA-quinoxaline (6)
DHA (1) (500 mg; 2.87 mmol) was dissolved in methanol (50 ml), and o-phenylenediamine hydrochloride (OPDx2HCl) was added (1.033 mg, 5.74 mmol). The reaction mixture was stirred under argon at room temperature for 5 h. Methanol was evaporated under reduced pressure. The residue was dissolved in solvent B and purified by semipreparative RP HPLC (solvents: 90% B and 10% solvent C; tR = 12.1 min). The fractions containing the pure compound 6 were pooled and partially evaporated under reduced pressure and then freeze dried (199 mg, η = 28% (on DHA)). 1H NMR (CD3OD): δ 3.83–3.92 (2H, H-13, m), 4.39 (1H, H-12, m), 5.96 (1H, H-11, d), 8.00 (1H, H-6, m), 8.06 (1H, H-7, m), 8.28 (1H, H-5, m), 8.33 (1H, H-8, m); 13C NMR δ 61.60 (C-13), 70.84 (C-12), 79.81 (C-11), 128.57 (C-6), 129.86 (C-7), 130.64 (C-5), 132.62 (C-8), 139.31 (C-8a), 143.15 (C-4a), 143.61 (C-2), 158.10 (C-3). MS (m/z): 247.1 [M + H]+, fragments (m/z): 229.0, 198.9, 185.0, 171.0, 157.0, 155.0, 145.1. UV λmax = 203, 240, and 318 nm.
2,3-DKG-quinoxaline (7)
2,3-DKG as potassium salt (2) was prepared as described previously (22). Briefly, ASA (3.2 g; 18.17 mmol) was dissolved in distilled water (17 ml), and potassium periodate (1.3 g; 5.65 mmol) was added. The reaction mixture was neutralized with potassium hydroxide (1 m) and stirred on ice for 2.5 h. The DKG-potassium salt was obtained as a white amorphous precipitate after adding cold ethanol (280 ml) into the reaction mixture followed by separation by centrifugation. Obtained crude product was dissolved in water (12 ml), and OPDx2HCl was added (600 mg, 3.33 mmol). The reaction mixture was stirred under argon at room temperature for 5 h and purified by preparative RP HPLC (10% solvent A and 90% solvent B; tR = 11.5 min). The fractions containing the pure compound 7 were pooled and partially evaporated under reduced pressure and freeze dried (226 mg, η = 4.7% (on ASA)).
1H NMR (CD3OD): δ 3.67–3.80 (2H, H-12, m), 4.19 (1H, H-11, m), 5.66 (1H, H-10, m), 7.89 (1H, H-6, m), 7.94 (1H, H-7, m), 8.18 (2H, H-5 and H-8, m); 13C NMR δ: 62.83 (C-12), 70.84 (C-11), 73.54 (C-10), 127.87 (C-6), 128.42 (C-7), 130.14 (C-5), 131.54 (C-8), 139.37 (C-4a), 140.93 (C-8a), 142.75 (C-2), 154.37 (C-3), 166.22 (C-9). MS (m/z): 265.0 [M + H]+, fragments (m/z): 247.0, 229.0, 221.0, 203.1, 185.1, 161.1, 147.0. UV λmax = 203, 240, and 318 nm.
Xylosone-quinoxaline (9)
Xylosone (4) was prepared as described previously (23). Briefly, xylose (1.0 g; 6.7 mmol) was dissolved in 95% methanol in water (60 ml), and cupric acetate monohydrate (4 g; 20.1 mmol) was added. The reaction mixture was refluxed for 20 min. After cooling, the cuprous oxide was removed by filtration. The excess of cupric acetate was removed by passing the methanolic solution through an Amberlite IR-120 column in hydrogen form. After passing through the column, the methanolic solution was concentrated under reduced pressure (up to 50 ml), and OPDx2HCl (600 mg, 3.33 mmol) was added. The reaction mixture was stirred under argon at room temperature for 5 h. Methanol was evaporated under reduced pressure. The residue was dissolved in solvent A and purified by preparative RP HPLC (solvent A; tR = 11.8 min). The fractions containing the pure compound 9 were pooled and partially evaporated under reduced pressure and then freeze dried (86 mg, η = 5.8% (on xylose)). 1H NMR (CD3OD): δ 3.66–3.81 (2H, H-11, m), 4.04 (1H, H-10, m), 5.07 (1H, H-9, d), 7.81 (2H, H-6 and H-7, m), 8.07 (2H, H-5 and H-8, m), 9.11 (1H, H-3, s); 13C NMR δ 62.33 (C-11), 72.73 (C-10), 73.99 (C-9), 127.75 (C-6), 127.93 (C-7), 129.08 (C-5), 129.57 (C-8), 140.74 (C-4a), 140.76 (C-8a), 143.94 (C-3), 157.21 (C-2). MS (m/z): 220.9 [M + H]+; fragments (m/z): 185.1, 161.1, 160.1, 157.1, 132.1, 131.1, 129.0, 106.0. UV λmax = 203, 240, and 318 nm.
Incubation of DHA (1) with o-phenylenediamine (OPD)
The time course of the derivatization of DHA (5 mm) with OPD (0.5, 1.0, 1.5, 2.0, and 2.5%) was examined in HEPES buffer (500 mm, pH 5.0 and 7.0) at room temperature. The amount of DHA-quinoxaline (6) formed was monitored by analyzing aliquots of the incubation mixtures at 30-min intervals for 12 h and after 24 h, using the LC-MS/MS method described below.
Incubation of Crystallins with DHA
Bovine lens crystallins (30 mg) were incubated with DHA (5 mm) for 7 days in phosphate buffer (pH 7.4, 100 mm, with 1 mm diethylenetriaminepentaacetic acid). After incubation, proteins were washed three times with ice-cold water through a 10-kDa cut-off filter. After washing, protein concentration was measured by a BCA protein assay kit (Pierce), and an equivalent of 2 mg of protein was dissolved in 400 μl of HEPES buffer (pH 5.0 and 7.0), and 100 μl of OPD (1 and 2% dissolved in HEPES, pH 5.0 and 7.0) was added. The samples were blanked with argon and incubated for 6, 10, and 12 h at room temperature in the dark with constant rotation. After incubation, ice-cold trichloroacetic acid (TCA) (40%, 25 μl) was added to an aliquot of the incubation mixtures (100 μl), and the samples were held on ice for 20 min and centrifuged (20,000 × g, 30 min, 4 °C) into 50 μl of the supernatant, and 45 μl of 0.1% TFA and 5 μl of internal standard (IS) were added. From this 70 μl was used for LC-MS/MS analysis. All analyses were done in duplicate.
Incubation of Xylosone with/without Crystallins
Pure water solution of xylosone (4) was prepared following the previously published procedure, and its concentration was determined by the titrimetric method after oxidation with hydrogen peroxide (24). Xylosone (4) at three different concentrations (1.0, 0.5, and 0.25 mm) was preincubated with and without proteins (10 mg/ml) in HEPES buffer (500 mm, pH 7.4, with 0.5 mm DTPH) at room temperature for 3 h. After pH adjustment to 5.0 and incubation with OPD, the level of 4 was measured in the incubation mixtures following the procedures described previously.
Preparation of Lens Proteins and Protein-free Fractions
A total of 17 human non-cataractous lenses were obtained from the National Disease Research Interchange (Philadelphia, PA) under an approved IRB protocol from University Hospitals of Cleveland. Lenses were stored at −80 °C until use. The lenses were homogenized in 5 mm Chelex-100-treated HEPES buffer (pH 5.0) with protease inhibitors added (Roche Applied Science) (2.0 ml/lens) in a Con-Torqueglass homogenizer (Eberbach, Ann Arbor, MI) for 3 min on ice. The homogenate was centrifuged at 20,000 × g for 30 min at 4 °C. The supernatant and pellet were separated. The pellet (WIP) was further washed twice with 1.0 ml of water, and the supernatant was discarded after centrifugation. After washing, the pellet was resuspended in water (1 ml) and freeze-dried. The supernatant fractions that contained WSP were passed through 10-kDa cut-off filters (Pall, Ann Arbor, MI). The filtrate was separated as protein-free fraction (PFF), whereas WSP were washed twice with ice-cold water.
Protein concentration in WSP was measured by the BCA protein assay kit, whereas WIP were weighed after freeze-drying. Ascorbylation using 5 mm DHA for 24 h did not impact on protein yield.
Incubation of Lens Fractions with OPD
Into 50 μl of PFF were added 40 μl of HEPES buffer (500 mm, pH 5.0) and 10 μl of OPD (2% dissolved in HEPES, pH 5.0). After blanketing with argon to prevent oxidation during processing, the samples were incubated for 8 h in the dark at room temperature. After incubation, 45 μl of 0.1% TFA and 5 μl of IS were added into 50 μl of the reaction mixture, and 70 μl was injected into the LC-MS/MS mass spectrometer.
An equivalent of 2 mg of WS or WI proteins was dissolved in up to 400 μl of HEPES buffer (500 mm, pH 5.0), and 100 μl of OPD (2% dissolved in HEPES buffer, pH 5.0) was added. The samples were blanketed with argon and incubated for 8 h at room temperature in the dark with constant rotation. After incubation, ice-cold TCA (40%, 25 μl) was added to an aliquot of the incubation mixture (100 μl), and the samples were held on ice for 20 min and centrifuged (20,000 × g for 30 min at 4 °C). To 50 μl of the supernatant was added 45 μl of 0.1% TFA and 5 μl of IS. 70 μl was injected for LC-MS/MS analysis.
Quantitation by Liquid Chromatography Tandem Mass Spectrometry
LC-ESI-MS/MS analysis was performed with a Waters HPLC system consisting of a model 2695 separation module and a Micromass Ultima triple quadrupole mass spectrometric detector (Waters-Micromass, Manchester, UK). An Atlantis dC-18 column (2.1 × 50 mm; 3 μm; Waters, Milford, MA) was used. Solvents for analysis of the incubation mixtures were 0.1% TFA in water (solvent D) and 90% acetonitrile in water (solvent E). A gradient was applied as follows: 0 min 100% D (0% E), 0–15 min 100% D (0% E) to 60% D (40%E), 15–16 min 60% D (40% E) to 20% D (80% E), 16–20 min 20% D (80% E). Flow rate was 0.2 ml/min. Electron spray positive ionization (ESI+)-mass spectrometric multiple-reaction-monitoring experiments were used for quinoxaline derivatives of DHA (6), 2,3-DKG (7), 3-deoxythreosone (8), xylosone (9), and threosone (10) in the human lenses. The ionization source temperature was 120 °C, and the desolvation gas temperature 300 °C. The cone gas and desolvation gas flow rates were 660 and 85 liters/h, respectively. The capillary voltage was 3.50 kV. Argon gas was in the collision cell. Programmed molecular ion and fragment ion masses were optimized to ±0.1 Da for multiple-reaction-monitoring detection of analyte. Cone voltage was 50 V for all compounds. Other parameters are shown in Table 1. Quantification was performed using the standard addition method using the authentic reference compounds 6–10, which were synthesized as described above (see supplemental Fig. S1). 2,3-Dimethylquinoxaline was used as an internal standard for additional control.
TABLE 1.
LC-MS/MS parameters for quinoxalines
| Quinoxaline derivative of | Parent ion (m/z) | Fragment ionsa (m/z) | Collision energy | tRb |
|---|---|---|---|---|
| eV | min | |||
| DHA (6) | 247.0 | 157.0 | 20 | 11.1 |
| 171.0 | 19 | |||
| 2,3-DKG (7) | 265.0 | 161.1 | 15 | 5.3 |
| 185.1 | 18 | |||
| 3-Deoxythreosone (8) | 175.0 | 156.9 | 20 | 12.9 |
| 131.9 | 22 | |||
| Xylosone (9) | 220.9 | 161.1 | 20 | 7.3 |
| 157.1 | 20 | |||
| Threosone (10) | 191.2 | 160.0 | 20 | 10.5 |
| 144.1 | 20 | |||
| 2,3-Butanedione (IS) | 158.5 | 91.2 | 26 | 14.8 |
| 118.1 | 26 |
a The first fragmentation ion was used as a quantifier ion, whereas the second fragmentation ion was used as a qualifier ion.
b tR, retention time on the HPLC column.
Statistical Analysis
All values were expressed as means ± S.D. Statistical significance of differences in mean values was assessed by Student's t test. p values of <0.05 were considered statistically significant.
RESULTS
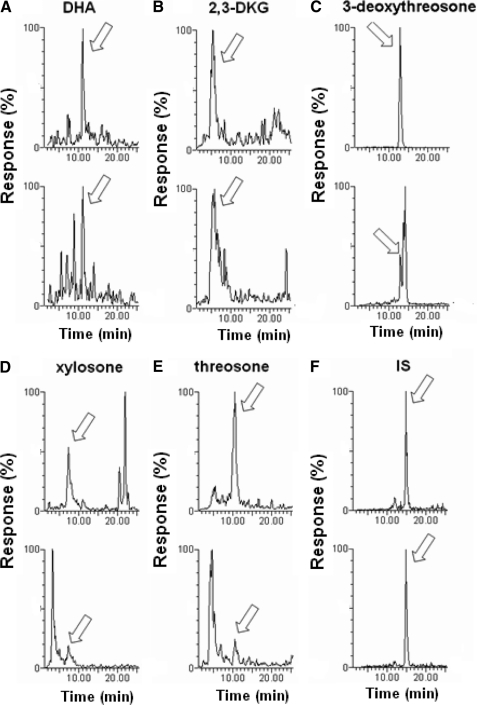
The theoretical oxidative and non-oxidative pathways leading from vitamin C to the dicarbonyl products DHA (1), 2,3-DKG (2), 3-deoxythreosone (3), xylosone (4), and threosone (5) are shown in Scheme 1, which was redrawn according to Reihl et al. (9). To measure the level of these compounds in human lenses, their OPD derivatives were synthesized (6–10) and used as standards for analysis by LC-MS/MS. For each compound, one specific mass spectrometric transition was used as a quantifier ion, and one additional transition was monitored as a qualifier ion. Chromatograms of OPD derivatives are shown in Fig. 1.
FIGURE 1.
Mass spectrometric detection of OPD derivatives of DHA (1) (A; m/z 247. 0 → m/z 157.0 and m/z 247.0 → m/z 171.0 transitions), 2,3-DKG (2) (B; m/z 265.0 → m/z 161.1 and m/z 265.0 → m/z 185.1 transitions), 3-deoxythreosone (3) (C; m/z 175.0 → m/z 131.9 and m/z 175.0 → m/z 156.9 transitions), xylosone (4) (D; m/z 220.9 → m/z 157.1 and m/z 220.9 → m/z 161.1 transitions), threosone (5) (E; m/z 191.2 → m/z 144.1 and m/z 191.2 → m/z 160.0 transitions) and internal standard (IS) (F; m/z 158.5 → m/z 91.2 and m/z 158.5 → m/z 118.1 transitions) by LC-ESI-MS/MS multiple-reaction-monitoring analysis in human lens.
Optimization of Incubation Conditions
HEPES was used as a buffer for derivatization because it was recently shown by Mittelmaier et al. (25) to be a good medium for dicarbonyl derivatization by OPD. DHA (1), being the least reactive of the tested dicarbonyls, was used for optimization of incubation conditions. DHA (1) was incubated in HEPES buffer (500 mm, pH 5.0 and 7.0) with OPD (0.5–2.5%). All incubations were done in the dark at room temperature under argon. A reaction plateau was achieved after 5 h of incubation with OPD at 1% and above (data not shown). Potential de novo formation of examined dicarbonyls 1–5 during incubation was tested by incubating OPD with ASA (5 mm), DHA (5 mm), and fructosyl-lysine (5 mm) under the same incubation conditions. Only de novo formation of 2,3-DKG (2) was observed during incubation of DHA (1) with OPD at pH 7.0.
For optimization of incubation conditions for dicarbonyls reversibly bound to bovine crystallins, the latter were incubated with 5 mm DHA for 7 days in sodium phosphate buffer (100 mm, 1 mm diethylenetriaminepentaacetic acid, pH 7.4), and after washing through a 10-kDa filter, an equivalent of 2 mg was then incubated with OPD (1 and 2%) in the HEPES buffer at pH 5.0 and 7.0. As can be seen in Table 2, 3-deoxythreosone (3) and threosone (5) were detected in the tested proteins. A reaction plateau, at both pH values and OPD concentration, was achieved after 6 h, and the yield of 3 and 5 was not further increased by prolonging the incubation time. On the other hand, increasing the pH from 5.0 to 7.0 resulted in increased formation of 3 by a factor of 2, whereas the yield of 5 was not significantly changed. The same amount of 5 at both pH values suggests that pH 5.0 is sufficient for the trapping of dicarbonyls with OPD in the protein-rich fraction. The higher value of 3 at higher pH, on the other hand, suggests excess formation from other sources in addition to reversibly bound compound 3. Based on this analysis, an incubation time of 8 h, pH 5.0, and 2% OPD was chosen for all subsequent experiments.
TABLE 2.
Ratio of peak areas of quinoxalines formed from protein-bound 3-deoxythreosone (3) and threosone (5) in a reaction with OPD to internal standard (IS) followed after protein incubation and modification with DHA
| OPD | pH | Derivatizing time |
|||
|---|---|---|---|---|---|
| 6 h | 10 h | 12 h | |||
| 3/IS | 1% | 5.0 | 1.7 | 1.8 | 1.8 |
| 7.0 | 3.7 | 3.5 | 3.7 | ||
| 2% | 5.0 | 1.8 | 1.7 | 1.8 | |
| 7.0 | 3.8 | 3.8 | 3.8 | ||
| 5/IS | 1% | 5.0 | 0.2 | 0.3 | 0.2 |
| 7.0 | 0.2 | 0.22 | 0.3 | ||
| 2% | 5.0 | 0.2 | 0.2 | 0.2 | |
| 7.0 | 0.3 | 0.3 | 0.3 | ||
Efficiency of capture by OPD of dicarbonyls associated with the protein-fraction was tested with xylosone (4). The ratios between xylosone level at initial concentration of 1.0, 0.5, and 0.25 mm in the incubation mixtures preincubated with proteins and the incubation mixtures without proteins were 112 ± 23, 82 ± 4, and 86 ± 2%, respectively. Relatively high recovery of xylosone from incubation mixtures with proteins showed very good capture of this dicarbonyl in the presence of different nucleophilic amino acid residues, where the lower recovery of xylosone (4) at some concentrations can be due to formation of irreversible adducts between 4 and proteins. In addition, all dicarbonyls were quantified as their OPD derivatives by quinoxaline addition with an assumption that the reaction between the dicarbonyls and OPD was quantitative. Comparison of values obtained for DHA and xylosone incubated with OPD with values obtained for their pure quinoxaline derivatives showed yields between 59 and 71% in the concentration range between 0.1 and 3.0 mm. This compares well with the recovery reported by Glomb and Tschirnich (26) for glyoxal and methylglyoxal (each about 60%), whereas that of the oxoaldehydes of glucose was above 90%.
ASA Degradation Products in Human Lenses
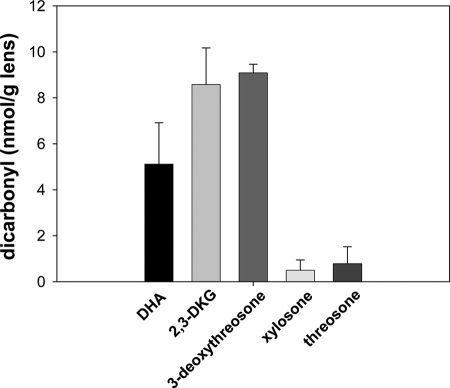
Human lens proteins were separated into three fractions: WSP, WIP, and PFF. All three fractions were incubated with OPD in HEPES buffer and then analyzed by LC-MS/MS for the presence of dicarbonyls 1–5 as OPD derivatives (Figs. 2–4). All five analyzed dicarbonyls were detected in the PFF of the tested lenses, whereby their concentrations were in a range of 0.5–9.1 pmol/mg lens (Fig. 2). The level of 3-deoxythreosone (3) was the highest, followed by 2,3-DKG (2), DHA (1), threosone (5), and xylosone (4) in a relative ratio of 18:17:10:1.6:1, respectively.
FIGURE 2.
Level of free dicarbonyl quinoxalines from DHA (1), 2,3-DKG (2), 3-deoxythreosone (3), xylosone (4), and threosone (5) in human lenses measured as OPD derivatives. Error bars, S.D.
FIGURE 3.
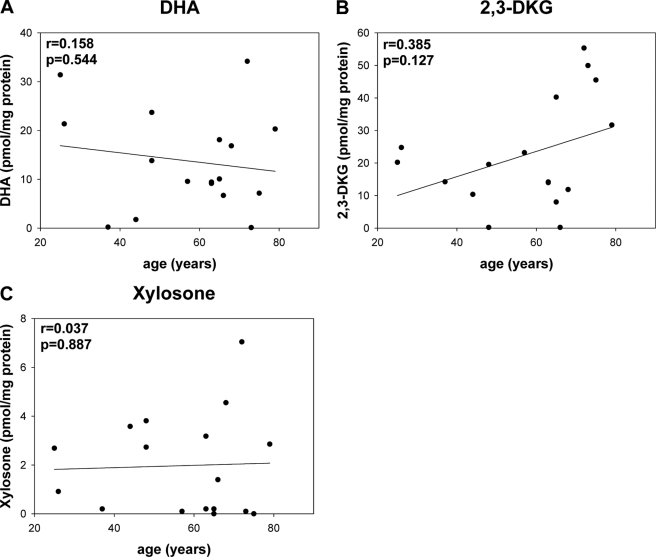
Level of quinoxalines from DHA (1; A), 2,3-DKG (2; B), and xylosone (4; C) reversibly bound to water soluble human lens proteins measured as OPD derivatives versus age.
FIGURE 4.
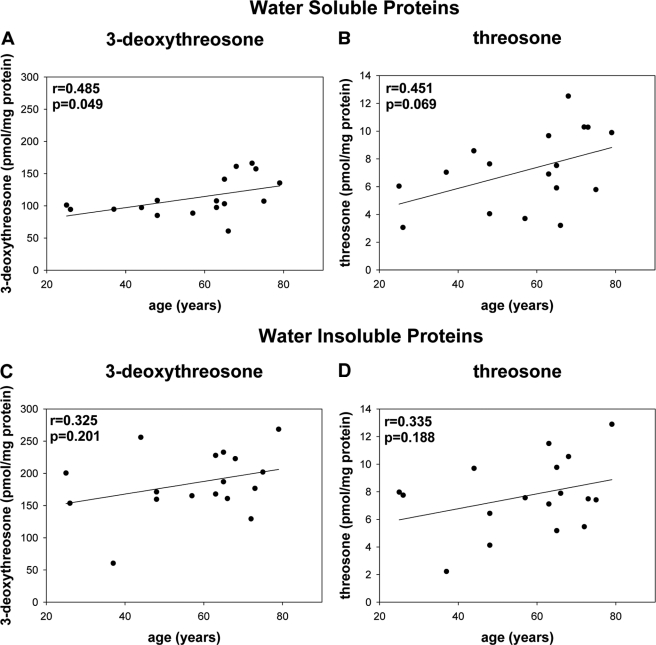
Level of quinoxalines from 3-deoxythreosone (3; A and C) and threosone (5; B and D) reversibly bound to WSP (A and B) and WIP (C and D) human lens proteins measured as OPD derivatives versus age.
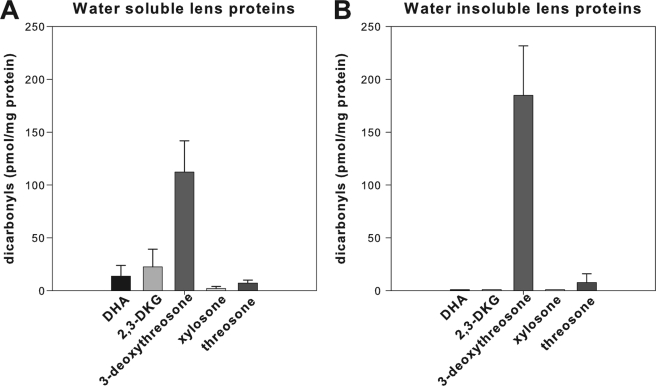
All of these dicarbonyls were also detected in the WSP. In WSP, 3-deoxythreosone (3) was again the most prevalent dicarbonyl, followed by 2,3-DKG (2), DHA (1), threosone (5), and xylosone (4); however, the relative ratio was 58:12:7:3.7:1 (Figs. 3 and 4, A and B). In WIP, on the other hand, only 3-deoxyreosone (3) and threosone (5) were identified (Fig. 4, C and D), whereas the other three dicarbonyls were below the limit of detection. Although the level of threosone (5) was roughly the same in both protein fractions, the mean level of 3-deoxythreosone (3) was 60% higher in WIP versus WSP (Fig. 5). In addition, all quantified dicarbonyls, except DHA, in WSP and WIP showed increases with age. However, the increase was shallow and only significant for 3-deoxythrosone (3) in WSP (Figs. 3 and 4).
FIGURE 5.
Mean ± S.D. levels of quinoxalines from DHA (1), 2,3-DKG (2), 3-deoxythreosone (3), xylosone (4), and threosone (5) reversibly bound to water-soluble (A) and water-insoluble (B) proteins in human lenses (ages 20–80) measured as OPD derivatives. Error bars, S.D.
DISCUSSION
Although the possible products of in vitro vitamin C degradation are known, their contribution to protein modification is still unknown. The lack of specific AGE probes for these products has been a bottleneck in addressing the role of ascorbate in AGE formation and protein modification in aging and diabetes. Reichel et al. (9) isolated and characterized lysine-arginine imidazilydene cross-links i, ii, and iii derived from xylosone (4), threosone (5), and 3-deoxythreosone (3), respectively; however, formation of the products was not demonstrated in vivo. Following the same procedure, cross-links i, ii, and iii were isolated, and the cross-links generated from threosone and 3-deoxythreosone (ii and iii) were identified in bovine lens crystallin incubated with DHA in vitro (20 mg of protein incubated with 5 mm DHA, in 100 mm phosphate buffer with 1 mm diethylenetriaminepentaacetic acid, pH 7.4, 7 days, at 37 °C). However, their amounts in enzymatically digested crystallin isolated from human lenses or even from mouse lenses with overexpressed vitamin C transporter (5) were below the limit of detection (data not shown). These results indicate that these types of protein modifications are not prevalent in vivo.
Our further attempt with quantification of specific modifications from vitamin C focused on isolation and characterization of hydroimidazolone-like products. Although we were able to identify such products in t-butoxycarbonyl-arginine/DHA model systems as major products, they were not stable enough for complete structural characterization. In addition, more than 75% of the compounds were degraded under conditions characteristic for protein enzymatic digestion, a necessary step for AGE quantification in proteins.
To obtain insight into the importance of dicarbonyls generated from vitamin C in vivo, levels of free and reversibly protein-bound dicarbonyls were measured in human lenses. Due to their high reactivity, they were quantified as more stable derivatives after reaction with a trapping reagent (i.e. OPD). Although there is always a possibility of enhanced formation or false positive formation of dicarbonyls during incubation (26), special care was taken during incubation conditions. All incubations were done in a relatively short time and under slightly acid conditions to prevent hydrolysis of DHA (1) into 2,3-DKG (2) and overestimation of 3-deoxythreosone (3). In addition, we were able to confirm that ascorbic acid, DHA, and the Amadori product did not produce extra dicarbonyls during the incubation period.
Detection of all five tested dicarbonyls in the protein-free fraction proves their existence in the human lenses. The relative distribution of 3-deoxthreosone (3)/DHA (1)/2,3-DKG (2)/threosone (5)/xylosone (4) was 18:17:10:1.6:1, providing partial insight into their importance for their reaction with proteins, although their stability and reactivity are important as well.
Quantification of 1–5 in the WSP showed that all of these dicarbonyls are reversibly associated with lens proteins. Although the ratio of 3 versus 5 in WSP kept roughly the same value as in PFF (15.6 in WSP versus 11.6 in PFF), the ratio of 3 versus 1 and 3 versus 2 for both was 4.6 higher in WSP than in PFF (i.e. in line with the expected higher reactivity of 3-deoxythreosone (3) and threosone (5) toward proteins in comparison with DHA (1) and 2,3-DKG (2)).
The major and most important finding in our study is the identification of 3-deoxythreosone as the major lens crystallin-associated vitamin degradation product. This finding confirms the in vitro landmark demonstration by Simpson and Ortwerth (6) that l-erythrulose is the major degradation product resulting from the non-oxidative degradation of DHA (1). Erythrulose in a reaction with an amine (e.g. lysine) via the Amadori product or keto-enol rearrangement and water elimination gives 3-deoxythreosone (3) (9). In addition, oxidation of the C-1 hydroxyl group of l-erythrulose generates threosone (5) (9). This product was detected in both protein fractions. Higher level of 3 versus 5 suggests that concomitant rearrangement of l-erythrulose also goes through a non-oxidative pathway. However, it has to be pointed out that products 3 and 5 can theoretically also form from glucose degradation, whereby oxidative conditions favor formation of product 5 (19, 20). Although the contribution of glucose and vitamin C to 3 and 5 generation has yet to be established, DHA (1), 2,3-DKG (2), and xylosone (4) represent specific markers of vitamin C participation in the Maillard reaction.
In WIP, only 3-deoxythreosone (3) and threosone (5) were in quantifiable amounts. The absence of the other three dicarbonyls in the WIP could potentially be due to heterogeneity of the incubation mixture, although the proteins were constantly stirred to ensure good contact with the trapping reagent. However, higher yield of 3 and 5 in WIP versus WSP indicates completed derivatization. It also has to be taken into account that all of these dicarbonyls are competing for the same amino acid residues as those not considered in this study, notably methylglyoxal, glyoxal, and 3-deoxyglucosone, and because WIP is usually more modified than WSP (13), it can be assumed that in WIP fewer residues are available for the reaction with 1, 2, and 4.
All measured dicarbonyls tended to show increasing formation with age (except DHA (1) in WSP, which is partially hydrolyzed into 2,3-DKG (2) but in sum with 2 also showed an increase) (Figs. 3 and 4). However, because all of the measured products, free and protein-bound, are relatively unstable and short lived, the observed increase is probably not a result of accumulation with age but rather the result of increased dicarbonyl generation in older lenses. This is in agreement with the results from Xing and Lou, who showed that the level of reduced glutathione (GSH), which is needed for maintaining ASA in the reduced state (27), is compromised with age (28). GSH is also a co-enzyme of the glyoxalase enzyme system, which is involved in dicarbonyl detoxification (29).
Finally, one word of caution is warranted concerning the above study. The conclusion that erythrulose is the major vitamin C degradation product in the human lens is based on the assumption that 1) OPD recovery is about equivalent for each of the dicarbonyls measured, and 2) no major differences in ionization of individual OPD derivatives are present. The former statement is supported by our data and that of Glomb and Tschirnich (26) for glucose-derived oxoaldehydes. For chemical reasons, the second assumption certainly applies to the OPD derivatives of threosone, deoxythreosone, and xylosone, whereby minor differences in ionization are unlikely to explain the 10-fold higher levels of deoxythreosone (3) versus threosone and xylosone, proving thereby that erythrulose is the single major in vivo pathway of vitamin C degradation in the anaerobic environment of the human lens (Scheme 2).
SCHEME 2.
Summary of the major in vivo pathways of non-enzymatic protein modifications by ascorbic acid degradation products.
This work was supported, in whole or in part, by NEI, National Institutes of Health, Grant EY07099. This work was also supported by Ministry of Science, Education, and Sports of Croatia Grant 098-0982933-2936.

The on-line version of this article (available at http://www.jbc.org) contains supplemental Fig. S1.
- AGE
- advanced glycation end product
- ASA
- ascorbic acid
- DHA
- dehydroascorbic acid
- 2,3-DKG
- 2,3-diketogulonic acid
- ESI
- electron spray ionization
- IS
- internal standard
- WIP
- water-insoluble proteins
- WSP
- water-soluble proteins
- RP
- reversed phase
- OPD
- o-phenylenediamine
- OPDx2HCl
- o-phenylenediamine hydrochloride
- PFF
- protein-free fraction.
REFERENCES
- 1. Varma S. D., Richards R. D. (1988) Ophthalmic Res. 20, 164–173 [DOI] [PubMed] [Google Scholar]
- 2. Cheng R., Feng Q., Ortwerth B. J. (2006) Biochim. Biophys. Acta 1762, 533–543 [DOI] [PubMed] [Google Scholar]
- 3. Argirov O. K., Lin B., Ortwerth B. J. (2004) J. Biol. Chem. 279, 6487–6495 [DOI] [PubMed] [Google Scholar]
- 4. Atalay A., Ogus A., Bateman O., Slingsby C. (1998) Biochimie 80, 283–288 [DOI] [PubMed] [Google Scholar]
- 5. Fan X., Reneker L. W., Obrenovich M. E., Strauch C., Cheng R., Jarvis S. M., Ortwerth B. J., Monnier V. M. (2006) Proc. Natl. Acad. Sci. U.S.A. 103, 16912–16917 [DOI] [PMC free article] [PubMed] [Google Scholar]
- 6. Simpson G. L., Ortwerth B. J. (2000) Biochim. Biophys. Acta 1501, 12–24 [DOI] [PubMed] [Google Scholar]
- 7. Shin D. B., Feather M. S. (1990) Carbohydr. Res. 208, 246–250 [DOI] [PubMed] [Google Scholar]
- 8. Nishikawa Y., Toyoshima Y., Kurata T. (2001) Biosci. Biotechnol Biochem. 65, 1707–1712 [DOI] [PubMed] [Google Scholar]
- 9. Reihl O., Lederer M. O., Schwack W. (2004) Carbohydr. Res. 339, 483–491 [DOI] [PubMed] [Google Scholar]
- 10. Dunn J. A., Ahmed M. U., Murtiashaw M. H., Richardson J. M., Walla M. D., Thorpe S. R., Baynes J. W. (1990) Biochemistry 29, 10964–10970 [DOI] [PubMed] [Google Scholar]
- 11. Nagaraj R. H., Sell D. R., Prabhakaram M., Ortwerth B. J., Monnier V. M. (1991) Proc. Natl. Acad. Sci. U.S.A. 88, 10257–10261 [DOI] [PMC free article] [PubMed] [Google Scholar]
- 12. Tessier F., Obrenovich M., Monnier V. M. (1999) J. Biol. Chem. 274, 20796–20804 [DOI] [PubMed] [Google Scholar]
- 13. Fan X., Zhang J., Theves M., Strauch C., Nemet I., Liu X., Qian J., Giblin F. J., Monnier V. M. (2009) J. Biol. Chem. 284, 34618–34627 [DOI] [PMC free article] [PubMed] [Google Scholar]
- 14. Sell D. R., Monnier V. M. (2005) Ann. N.Y. Acad. Sci. 1043, 118–128 [DOI] [PubMed] [Google Scholar]
- 15. Glomb M. A., Lang G. (2001) J. Agric. Food Chem. 49, 1493–1501 [DOI] [PubMed] [Google Scholar]
- 16. Lo T. W., Westwood M. E., McLellan A. C., Selwood T., Thornalley P. J. (1994) J. Biol. Chem. 269, 32299–32305 [PubMed] [Google Scholar]
- 17. Patthy L., Smith E. L. (1975) J. Biol. Chem. 250, 557–564 [PubMed] [Google Scholar]
- 18. Takahashi K. (1968) J. Biol. Chem. 243, 6171–6179 [PubMed] [Google Scholar]
- 19. Usui T., Yanagisawa S., Ohguchi M., Yoshino M., Kawabata R., Kishimoto J., Arai Y., Aida K., Watanabe H., Hayase F. (2007) Biosci. Biotechnol Biochem. 71, 2465–2472 [DOI] [PubMed] [Google Scholar]
- 20. Gobert J., Glomb M. A. (2009) J. Agric. Food Chem. 57, 8591–8597 [DOI] [PubMed] [Google Scholar]
- 21. Thornalley P. J., Langborg A., Minhas H. S. (1999) Biochem. J. 344, 109–116 [PMC free article] [PubMed] [Google Scholar]
- 22. Otsuka M., Kurata T., Arakawa N. (1986) Agric. Biol. Chem. 50, 531–533 [Google Scholar]
- 23. Salomon L. L., Burns J. J., King C. G. (1952) J. Am. Chem. Soc. 74, 5161–5162 [Google Scholar]
- 24. Vuorinen T., Serianni A. S. (1990) Carbohydr. Res. 207, 185–210 [DOI] [PubMed] [Google Scholar]
- 25. Mittelmaier S., Fünfrocken M., Fenn D., Fichert T., Pischetsrieder M. (2010) J. Chromatogr. B Analyt. Technol. Biomed. Life Sci. 878, 877–882 [DOI] [PubMed] [Google Scholar]
- 26. Glomb M. A., Tschirnich R. (2001) J. Agric. Food Chem. 49, 5543–5550 [DOI] [PubMed] [Google Scholar]
- 27. Wells W. W., Xu D. P. (1994) J. Bioenerg. Biomembr. 26, 369–377 [DOI] [PubMed] [Google Scholar]
- 28. Xing K. Y., Lou M. F. (2010) Invest. Ophthalmol. Vis. Sci. 51, 6598–6604 [DOI] [PMC free article] [PubMed] [Google Scholar]
- 29. Xue M., Rabbani N., Thornalley P. J. (2011) Semin. Cell Dev. Biol. 22, 293–301 [DOI] [PubMed] [Google Scholar]


