

Abstract
In a two-microelectrode voltage clamp with Xenopus laevis oocytes, a petroleum ether extract of Acorus calamus rhizomes enhanced the GABA-induced chloride current through GABAA receptors of the α1β2γ2S subtype by 277% ± 9.7% (100 μg/mL). β-Asarone (1), (+)-dioxosarcoguaiacol (2), (+)-shyobunone (3), and (+)-preisocalamenediol (4) were subsequently identified as main active principles through HPLC-based activity profiling and targeted isolation. The compounds induced maximum potentiation of the chloride current ranging from 588% ± 126% (EC50: 65.3 ± 21.6 μM) (2) to 1200% ± 163% (EC50: 171.5 ± 34.6 μM) (1), whereas (−)-isoshyobunone (5) and (−)-acorenone (6) exhibited weak GABAA modulating properties (5: 164% ± 42.9%; EC50: 109.4 ± 46.6 μM and 6: 241% ± 23.1%; EC50: 34.0 ± 6.7 μM). The relative configuration of 2 was established as 4R*8S*10R* by NOESY experiments and conformational analysis.
Acorus calamus L. (Acoraceae), commonly known as “sweet flag”, is a polyploidic marsh plant indigenous to Asia and is now distributed along trade routes all over the northern hemisphere.1 The aromatic rhizome has been widely used as an herbal remedy. It contains 1.7–9.3% of a volatile oil composed of monoterpenes, sesquiterpenes, and phenylpropanoids. The most characteristic constituent of the oil is β-asarone, even though its concentration may vary considerably (96% in the tetraploidic form found in eastern and tropical southern Asia, 5% in the triploidic form found in Europe, Himalayan, and temperate Indian regions, and 0% in the diploidic variety growing from North America to Siberia).1–4 In European folk medicine, A. calamus rhizomes have been mainly used as “Amarum aromaticum” to alleviate gastrointestinal ailments such as acute and chronic dyspepsia, gastritis and gastric ulcer, intestinal colic, and anorexia.5,6 Ayurvedic medicine and traditional Chinese medicine (TCM) use the drug preferably to treat central nervous system (CNS) related diseases such as epilepsy, insanity, mental weakness, or insomnia.7–9 Several in vivo studies support a sedative and tranquillizing action of the essential oil and of ethanolic and aqueous extracts of A. calamus.10–12 Up to now, the underlying mechanism of action has remained elusive despite various investigations, even though the pharmacological effect could be mainly attributed to α-asarone and β-asarone.11,13–15
GABAA receptors are pentameric ligand-gated chloride ion channels that are activated by GABA, the major inhibitory neurotransmitter in the CNS. Most likely more than 11 different receptor subtypes, assembled from five varying subunits, exist in the human brain. These are involved in distinct neuronal circuits and are targeted by numerous classes of drugs such as benzodiazepines, barbiturates, and some general anesthetics. The most abundant GABAA receptor in the human brain consists of two α1, two β2, and one γ2S subunit.16–18
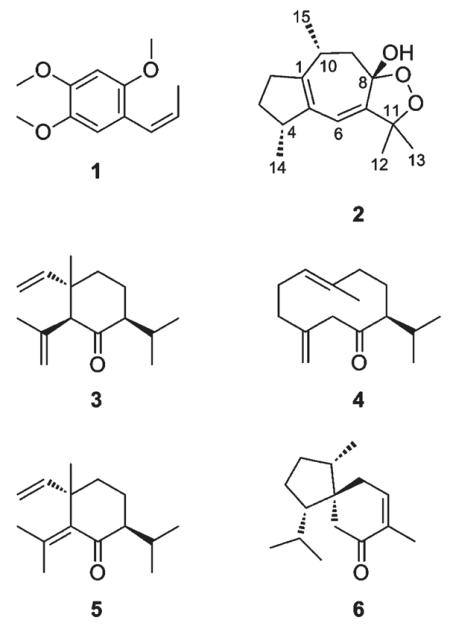
We recently screened a library of 982 extracts using an automated functional two-microelectrode voltage clamp assay with Xenopus oocytes19 that transiently expressed GABAA receptors of the α1β2γ2S subtype. A petroleum ether extract of A. calamus rhizomes showed promising activity. As previously shown, HPLC-based activity profiling is a miniaturized, effective approach to discover new bioactive natural products,20–24 and we have successfully applied it to the discovery of new GABAA receptor modulators of natural origin.25–28 Herein, we describe the identification of GABAA receptor modulating compounds in A. calamus (1–6) and provide information suggesting the complete relative configuration of (+)-dioxosarcoguaiacol (2), a sesquiterpene previously unknown in this plant.
RESULTS AND DISCUSSION
Plant extracts were screened in an automated, fast perfusion system during two-microelectrode voltage clamp measurements with Xenopus oocytes that transiently expressed GABAA receptors of the subunit combination α1β2γ2S.19 At a concentration of 100 μg/mL, the A. calamus petroleum ether extract potentiated the GABA-induced chloride current (IGABA) by 277% ± 9.7% (Figure 1C). To localize the activity within the extract, it was submitted to HPLC-based activity profiling using a previously validated protocol.29 The chromatogram (254 nm) of a semipreparative HPLC separation (10 mg of extract) and the corresponding activity profile of the time-based microfractionation (28 microfractions of 90 s each) are shown in Figure 1B and A, respectively. A major peak of activity was found in fraction 14 (potentiation of IGABA by 237% ± 5.4%), which contained an unresolved complex of peaks containing compounds 3–6. Minor activity was found in fractions 1, 6–8, and 10. Fractions 6 and 7 contained a major compound of the extract and enhanced IGABA by 54.7% ± 9.3% and 73.9% ± 17.7%, respectively. Fraction 8, consisting of a minor compound, showed a potentiation of IGABA by 50.6% ± 17.4%, whereas fraction 10 enhanced IGABA by 33.8% ± 10.3%. Fraction 1 showed marginal activity (38.3% ± 2.9%) but was not further pursued.
Figure 1.

HPLC-based activity profiling of a petroleum ether extract of Acorus calamus L. for GABAA modulating properties. The HPLC chromatogram (254 nm) of a semipreparative separation of 10 mg of extract is shown in B. Peak numbering corresponds to compounds 1–6. The 28 collected time-based fractions, 90 s each, are indicated with dashed lines. Potentiation of the GABA-induced chloride current in Xenopus oocytes (IGABA) of microfractions is shown in A. Potentiation of IGABA by the extract (100 μg/mL) and by open column fractions A–E and L–U (10 μg/mL) are shown in C. Fractions F–K were not tested due to limited amounts (<100 μg). Part D shows analytical HPLC traces (254 nm) of open column fractions A, C, D, L, and M. The active time-windows from the HPLC-based activity profiling (approximately corresponding to microfractions 6–8, 10, and 14) are indicated with dashed lines.
Preparative isolation was focused on the purification of compounds in the active time-based fractions and was started by an open column separation of the extract. An HPLC-ESIMS analysis of the resulting 21 fractions revealed that the extract was significantly more complex than suggested by the semipreparative HPLC chromatogram at 254 nm (Figure 1B). Peaks with retention times fitting to active microfractions were detected in several fractions. Fractions A–E and L–U were submitted to bioassay at a test concentration of 10 μg/mL (Figure 1C). The most active fractions, A, C, L, and M (potentiation of IGABA by 132% ± 41.5%, 157% ± 20.7%, 235% ± 59.0%, and 158% ± 72.9%, respectively), contained peaks that corresponded to the active time windows in the HPLC-based activity profiling (Figure 1D) and were further purified. Fraction D was not further pursued since it was very similar to fraction C. Finally, β-asarone (1), (+)-dioxosarcoguaiacol (2), (+)-shyobunone (3), (+)-preisocalamenediol (4), (−)-isoshyobunone (5), and (−)-acorenone (6) were isolated and unambiguously identified by ESI-TOF-MS, 1D and 2D microprobe NMR, optical rotation, and comparison with published data.30–37 Compounds 1 and 3–6 have been previously isolated from A. calamus.38–41 Their spectroscopic data are given as Supporting Information.
(+)-Dioxosarcoguaiacol (2), a sesquiterpene new for A. calamus, had been described from a Red Sea soft coral (Sarcophyton glaucum). However, assignment of the relative configuration was limited to stereocenters 4S* and 10R*, while the configuration at the bridgehead C-8 was not established.35 Optical rotation and NMR data of 2 were identical to published data. To confirm the relative configuration of the stereocenters at C-4 and C-10, we submitted the four possible stereoisomers of 2 (4R*8S*10R*, 4S*8S*10R*, 4R*8S*10S*, 4S*8S*10S*) to conformational analysis and compared 3JHH coupling constants from 1H NMR and selective TOCSY experiments, and NOESY correlations with the structures of the calculated conformers (relevant NMR data are summarized in Table 1; NMR spectra of 2 are given as Supporting Information). For each stereoisomer, 1–3 conformers were obtained within a 1 kcal/mol range from the corresponding global energy minimum (Figure S1, Supporting Information). However, only one conformer of each stereoisomer reasonably fit to the observed NMR data. These conformers were then submitted to geometrical optimization using density function theory (B3LYP/6-31G*), prior to comparison of optimized dihedral angles and interatomic distances with the experimental data.
Table 1.
NMR Spectroscopic Data (500 MHz, CDCl3) for (+)-Dioxosarcoguaiacol (2)
| position | δCa | mult. | δH (J in Hz) | HMBCb | NOESYc |
|---|---|---|---|---|---|
| 1 | 145.8 | C | |||
| 2 | 35.6 | CH2 | H-2a: 2.58, ddd (16.7, 8.5, 7.2) H-2b: 2.21, ddd (16.7, 10.9, 0) |
H-2a ↔ H-3b, 15 | |
| 3 | 29.9 | CH2 | H-3a: 1.95, m H-3b: 1.40, dddd (16.6, 8.5, 3.5, 0) |
H-3a ↔ 4 H-3b ↔ H-2a, 14 |
|
| 4 | 44.3 | CH | 2.63, m | ||
| 5 | 132.5 | C | |||
| 6 | 114.6 | CH | 5.55, s | C-11, 4, 8, 7, 5 | H-13, 12, 14, 4 |
| 7 | 153.2 | C | |||
| 8 | 103.4 | C | |||
| 8-OH | 3.08, br s | ||||
| 9 | 38.0 | CH2 | H-9a: 1.63, dd (13.4, 13.4) H-9b: 2.03, dd (13.4, 5.2) |
C-14, 10, 8, 7, 1 | H-9a ↔ H-15 H-9b ↔ H-15 |
| 10 | 31.5 | CH | 2.71, m | ||
| 11 | 85.3 | C | |||
| 12 | 28.0 | CH3 | 1.37, s | C-15, 11, 7 | H-6 |
| 13 | 24.8 | CH3 | 1.43, s | C-12, 11, 7 | H-6 |
| 14 | 20.1 | CH3 | 1.04, d (7.1) | C-3, 4, 5 | |
| 15 | 19.6 | CH3 | 1.12, d (7.1) | C-10, 9, 8, 1 | H-9a, 9b, 2a |
13C shifts are deduced from HSQC and HMBC experiments.
HMBC correlations from hmbcgp experiment (NS: 128, DS: 16), optimized for 10 Hz, are from proton(s) stated to the indicated carbon.
Critical NOESY correlations from noesygpphpp experiment (mixing time 0.75 s, NS: 32, DS: 16)
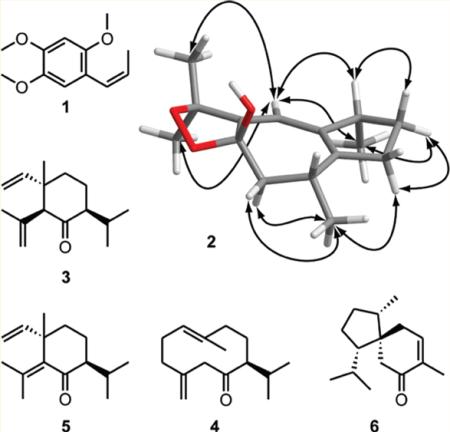
Unambiguous assignment of the methylene protons at C-2 and C-3 was established on the basis of 3JHH H-2b/H-3b of 0 Hz, indicative of their perpendicular orientation. This was corroborated by a NOESY correlation between H-3b and H-2a. 3JHH coupling constants H-9b/H-10 (5.2 Hz) and H-9a/H-10 (13.4 Hz) corresponded to dihedral angles of approximately 60° and 180°, respectively. Geometrically optimized conformers matched with the above-mentioned NMR data. However, two stereoisomers (4R*8S*10S*, 4S*8S*10S*) could be discarded since the interatomic distances between H-2a and CH3-15, and between H-6 and both methyl groups at C-11, were not in accord with the observed NOESY correlations. Assignment of the relative configuration at C-4 was supported by NOESY correlations between H-3a and H-4, and H-3b and CH3-14. Hence, only the 4R*8S*10R* stereoisomer fully matched with the NMR data of (+)-dioxosarcoguaiacol (2) (Figure 2). A synoptical table (Table S6) of the stereoisomers is given as Supporting Information.
Figure 2.
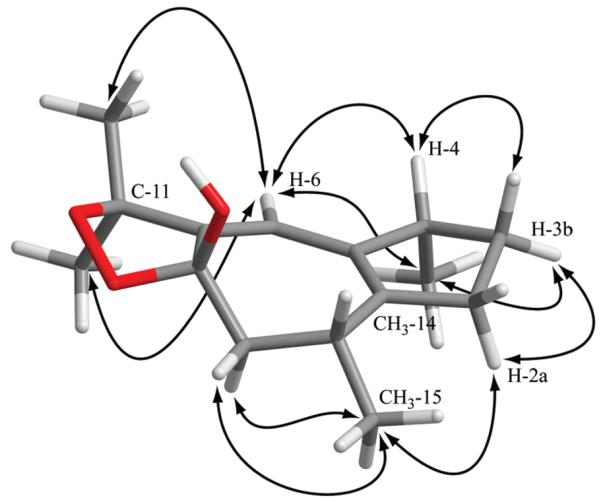
Geometrically optimized structure of 4R*8S*10R*-(+)-dioxosarcoguaiacol (2). Critical NOESY correlations for assigning the relative configuration are indicated with arrows. The geometrical optimization was performed using density function theory at the B3LYP/6-31G* level.
(+)-Dioxosarcoguaiacol35 was previously published with a 4S*10R* configuration, and with NMR shifts and optical rotation identical to compound 2. 4R10R-Calamusenone, the 8-oxo, Δ7,11 analogue of 2, was previously reported from A. calamus essential oil, and its absolute configuration determined by X-ray crystallographic analysis.42 The formation of 2 can be plausibly explained via photo-oxygenation of calamusenone by “ene-type” addition of O2 at C-11 and subsequent ring closure to the endoperoxide.43 1H NMR integrals of 2 showed an enantiomeric excess of the 8S* epimer [8-OH: δ 3.08, 8S* and δ 2.94, 8R* (95:5); H-6: δ 5.55, 8S* and δ 5.51, 8R* (95:5)]. The comparison of computationally optimized conformers of 2 with structural information obtained by 1D and 2D NMR experiments allowed us to unambiguously identify the relative configuration of (+)-dioxosarcoguaiacol (2) as 4R*8S*10R*, which contradicted the previously reported structure.35 Our findings were supported by the existence of a putative precursor, 4R10R-calamusenone, with known absolute configuration.
Compounds 1–6 were tested in the oocyte assay at concentrations ranging from 0.1 to 1000 μM. To varying degrees, all compounds enhanced IGABA at a GABA EC5–10 in a concentration-dependent manner (Figure 3). Compared to other natural products,25,27,44 compounds 1–4 showed high efficiencies on α1β2γ2S GABAA receptors. Potentiation of IGABA ranged from 588% ± 126% (2) to 1197% ± 163% (1) (Table 2). Compounds with higher efficiency usually displayed lower potencies (higher concentrations for half-maximal stimulation of IGABA; EC50) and vice versa. Compound 6 showed the highest potency (34.0 ± 6.7 μM) but a maximum stimulation of IGABA of only 241% ± 23.1%.
Figure 3.

Part A shows the concentration–response curves for compounds 1–6 on GABAA receptors (α1,β2, and γ2S subunit composition) using a GABA EC5–10. Typical traces for modulation of chloride currents through α1β2γ2S GABAA receptors for compounds 1–6 are given in B.
Table 2.
Potencies (EC50) and Efficiencies (Maximum Stimulation of the GABA-Induced Chloride Current) of Compounds 1–6 for GABAA Receptors of the Subunit Composition α1β2γ2S
| compd | EC50 [μM] ± SE | maximum stimulation of IGABA (EC5–10) ± SE [%] | Hill coefficienta (nH) ± SE | no. of experiments (n) |
|---|---|---|---|---|
| 1 | 171.5 ± 34.6 | 1200 ± 163 | 1.8 ± 0.2 | 6 |
| 2 | 65.3 ± 21.6 | 588 ± 126 | 1.6 ± 0.3 | 5 |
| 3 | 64.8 ± 19.8 | 669 ± 112 | 1.7 ± 0.3 | 6 |
| 4 | 135.1 ± 34.4 | 886 ± 105 | 1.6 ± 0.2 | 5 |
| 5 | 109.4 ± 46.6 | 164 ± 42.9 | 2.1 ± 0.8 | 6 |
| 6 | 34.0 ± 6.7 | 241 ± 23.1 | 1.6 ± 0.3 | 5 |
Indicates the slope of the concentration–response curve at the EC50. Hill coefficients > 1 indicate positive cooperativity during receptor binding.62
Even though the set of compounds tested was too small for a study of structure–activity relationships, some interesting observations were made: (+)-shyobunone (3) and (+)-preisocalamenediol (4), which both derive from acoragermacrone,40,45 showed comparably high efficiencies. The potency of 4 was lower, which could be due to the high conformational flexibility of the germacrane-type scaffold. (−)-Isoshyobunone (5) was much less efficient than its presumed precursor 346 (Figure 3; Table 2), which can only be explained by the varying C-2 substitution and the consequential conformational difference. Interestingly, 5 showed a weak (less than GABA EC5–10) direct activation of the α1β2γ2S GABAA receptor, whereas 3 did not evoke any agonistic effect. Only weak GABAA receptor modulation was found for (—)-acorenone (6). Compounds 2–6 broaden the spectrum of sesquiterpenes acting at the GABAA receptors. Up to now only a few sequiterpenes have been reported as GABAA receptor modulators. The most prominent is picrotoxin, a strong GABAA receptor inhibitor47 that is widely used as an experimental compound for animal convulsion models. Valerenic acid from Valeriana officinalis roots is a β2/3-subunit-specific positive allosteric modulator44,48 with anxiolytic effects in vivo.48,49 This compound has served as a new scaffold for GABAA receptor ligands.49,50
Among the compounds identified by the profiling of Acorus extract, the simple phenylpropanoid β-asarone (1) induced the highest potentiation of IGABA (1200% ± 163% with an EC50 of 171.5 ± 34.6 μM). Its efficiency at a GABA EC5–10 was significantly higher than that of known GABAA receptor modulators such as benzodiazepines (triazolam: 253% ± 12%, midazolam: 342% ± 64%, clotiazepam: 260% ± 27%)51 or natural products such as valerenic acid (400% ± 78%).44 The structure of 1 is somewhat reminiscent of propofol, a general anesthetic acting at the GABAA receptor. However, the pharmacological potential of 1 is certainly limited due to its known toxicity.52–54 There are many reports of sedative and tranquillizing properties of Acorus extracts and essential oil in animal models, but the mechanism of action was not established up to now.10–15,55 Given that β-asarone (1) is a major compound of the essential oil, its sedative and tranquillizing activities may be due to the GABAA receptor modulating properties of 1. The quantity of β-asarone in Acorus rhizome and essential oil, however, depends on the chemotype and thus varies considerably.3,4 Medicinal preparations made of the diploidic or triplodic form are free of the toxic β-asarone and are, therefore, recommended for therapeutic use.8 It is interesting to note that there seems to be a correlation between β-asarone content in the three chemotypes of A. calamus and their traditional uses. The tetraploidic, β-asarone-rich types growing in Asia have been traditionally used in Ayurvedic medicine and TCM as sedatives, whereas such uses have not been reported from the β-asarone-poor European and North American chemotypes. The reason for “Eastern” traditional usage as a sedative and “Western” traditional usage as an aromatic bitter could possibly be explained by limited access in the past to the geographically separated chemotypes of A. calamus.
The essential oil and extracts of A. calamus roots have multiple pharmacological and biological effects,56 but there is not much published data on bioactivity of sesquiterpenes 3–6 and (+)-dioxosarcoguaiacol (2). The compounds represent interesting drug-like structures, since they all fulfill Lipinski’s “rule of five”.57 From a pharmacological perspective, however, further investigations may be limited to the highly efficient sesquiterpenes 3 and 4 and to the minor compound 2. Further pharmacological and toxicological studies are needed to substantiate the sedative and tranquillizing properties of pure compounds and of the essential oil.
EXPERIMENTAL SECTION
General Experimental Procedures
Optical rotations of compounds 2–6 were measured on a Perkin-Elmer polarimeter (model 341) equipped with a 10 cm microcell. The optical rotation for the Na-D-line (589 nm) was extrapolated from the lines of a mercury lamp using the Drude equation.58 NMR spectra were recorded at room temperature with a Bruker Biospin Avance III spectrometer operating at 500.13 MHz. 1H NMR, COSY, DEPT-edited HSQC, HMBC, 1D-TOCSY, and 2D-NOESY spectra were measured with a 1 mm TXI probe. Spectra were analyzed using Bruker TopSpin 2.1 software. ESI-TOF-MS spectra of compounds 1–6 were recorded in positive mode on a Bruker Daltonics microTOF ESIMS system. Nitrogen was used as a nebulizing gas at a pressure of 2.0 bar and as a drying gas at a flow rate of 9.0 L/min (dry gas temperature 240 °C). Capillary voltage was set at 4500 V, hexapole at 230.0 Vpp. Instrument calibration was performed using a reference solution of sodium formate 0.1% in 2-propanol/water (1:1) containing 5 mM NaOH.
HPLC-PDA-ESIMS spectra were obtained in positive mode on a Bruker Daltonics Esquire 3000 Plus ion trap MS system connected via T-splitter (1:5) to an Agilent HP 1100 series system consisting of a binary pump, autosampler, column oven, and diode array detector (G1315B). Data acquisition and processing of all mass spectra was performed using Bruker HyStar 3.0 software.
Semipreparative HPLC separations were performed on a Waters Alliance 2690 separation module connected to a 996 photodiode array detector. Data acquisition and processing was performed using Waters Empower Pro software. Preparative HPLC separation was performed using a Shimadzu LC-8A preparative separation chromatograph equipped with a SPD-M10A VP diode array detector. Medium-pressure liquid chromatography (MPLC) was done on prepacked normal-phase cartridges (40–63 μm, 40 × 150 mm) using a Buchi Sepacore system consisting of a control unit C-620, a fraction collector C-660, and two pump modules C-605. The MPLC unit was controlled with the Buchi SepacoreControl software (version 1.0.3000.1). Deuterated chloroform (100 atom % D, stabilized with Ag) for NMR experiments was purchased from Armar Chemicals. HPLC-grade MeOH (Scharlau Chemie S.A.) and water were used for HPLC separations. Solvents used for extraction, open column chromatography, and MPLC were of technical grade and purified by distillation. Silica gel (63–200 μm, Merck) was used for open column chromatography.
Plant Material
Dried and cut rhizomes of A. calamus Ph. Helv. were purchased from Haenseler AG (Herisau, Switzerland) (batch 2009.12.0224). The identity of the plant material was confirmed at the Division of Pharmaceutical Biology, University of Basel, where a voucher specimen (00 380) is deposited.
Microfractionation for Activity Profiling
An aliquot (approximately 20 g) of ground roots was macerated at room temperature with petroleum ether (3 × 0.5 L, 1 h each). Microfractionation for GABAA receptor activity profiling was performed as previously described,25,27–29 with minor modifications; separation was carried out on a Waters SunFire Prep C18 (5 μm, 10 × 150 mm) column with MeOH (solvent A) and H2O (solvent B) using the following gradient: 60% A to 100% A in 30 min, hold for 10 min. The flow rate was 4 mL/min, and 100 μL of the extract (100 mg/mL in DMSO) was injected. A total of 28 time-based microfractions of 90 s each were collected. Microfractions were evaporated in parallel with a Genevac EZ-2 Plus vacuum centrifuge. The dry films were redissolved in 1 mL of MeOH; aliquots of 0.5 mL were dispensed in two vials, dried under N2 gas, and submitted to bioassay.
Preparative Extraction and Isolation
The plant material was ground with a Retsch ZM1 ultracentrifugal mill. Ground roots (630 g) were extracted by maceration at room temperature with petroleum ether (4 × 2.5 L, 1 h each). The solvent was evaporated at reduced pressure to yield 20.7 g of petroleum ether extract. A portion of the extract (18.8 g) was separated by open column chromatography (9 × 80 cm, 1.2 kg silica gel) using a step gradient of petroleum ether and ethyl acetate (95:5, 10 L; 90:10, 4 L; 80:20, 2 L; 70:30, 2 L; 60:40, 2 L; 50:50, 4 L; 25:75, 1.8 L; 100:0, 2 L). The flow rate was approximately 15 mL/min. The effluents were combined to 21 fractions (A–U) based on TLC patterns (detection at 254 nm and at daylight after staining with anisaldehyde–sulfuric acid reagent). Fractions A–U were analyzed by HPLC-PDA-ESIMS on a Waters SunFire C18 (3.5 μm, 3.0 × 150 mm) column with MeOH (solvent A) and H2O (solvent B), both containing 0.1% formic acid. A gradient of 60% A to 100% A in 30 min, hold for 10 min, and a flow rate of 0.4 mL/min were used. The sample concentration was 10mg/mL in DMSO, and the injection volume was 5 μL. The fractions were then submitted to bioassay. A portion (700 mg) of fraction A (1.32 g) was separated into 21 fractions (A1–A21) by MPLC using toluene, hexane, and CH2Cl2 in the following gradient: 10:90:0 to 100:0:0 in 3 h, 0:0:100 for 1 h at a flow rate of 30 mL/min. Fractions A10 (60.9 mg), A14 (140.8 mg), and A18 (19.2 mg) consisted of (+)-shyobunone (3), (+)-preisocalamenediol (4), and (−)-isoshyobunone (5), respectively. A portion (750 mg) of fraction C (920 mg) was separated into five fractions (C1–C5) by MPLC using a gradient of hexane and ethyl acetate (100:0 to 95:5 in 1.5 h, flow rate 30 mL/min) to yield 376 mg (fraction C3) of (−)-acorenone (6). Fraction L (385 mg) was separated by MPLC using a gradient of a CHCl3/EtOAc [9:1] mixture and hexane (20:80 to 50:50 in 2 h, flow rate 30 mL/min), which yielded 15 fractions (L1–L15). Fraction L13 (29.5 mg) was dissolved in 400 μL of DMSO and separated by preparative HPLC on a Waters SunFire Prep C18 OBD (5 μm, 30 × 150 mm) column using a gradient of MeOH/H2O (50:50 to 100:0 in 30 min, flow rate 20 mL/min) to obtain 3.8 mg of (+)-dioxosarcoguaiacol (2). A portion (790 mg) of fraction M (952 mg) was separated by MPLC using a gradient of a CH2Cl2/EtOAc [9:1] mixture and hexane (20:80 to 50:50 in 2 h, flow rate 30 mL/min), which yielded 12 fractions (M1–M12). Fraction M2 (290.9 mg) was identified as β-asarone (1). A portion (30 mg) of fraction M5 (83.4 mg) was dissolved in hexane (300 μL) and submitted repeatedly to semipreparative HPLC on a Merck LiChroSorb 100 Diol (10 μm, 10 × 250 mm) column (hexane/2-propanol (97:3) isocratic, flow rate 5 mL/min) to isolate another 18.5 mg of (+)-dioxosarcoguaiacol (2).
(+)-Dioxosarcoguaiacol (2): yellow oil; [α]22D +36 (c 0.16, CHCl3); UV (MeOH) λmax 260 (sh), 267 nm; NMR data see Table 1 and Supporting Information; ESI-TOF-MS m/z 273.1447 [M + Na]+ (calcd for C15H22O3Na, 273.1463).
Compounds 1 and 3–6 were unambiguously identified by means of 1D and 2D NMR experiments, ESI-TOF-MS, and optical rotation in the case of chiral compounds. The data were compared with published values30–37 and are available as Supporting Information.
Conformational Analysis and Geometrical Optimization
Conformational analysis of the stereoisomers of 2 was performed with Schrödinger 9.1 software at the OPLS_2005 level in CHCl3. Selection of the conformers was done within a 1 kcal/mol energy window. Conformers not fitting to NMR data were discarded (exclusion criteria: (i) dihedral angles clearly mismatching the 3JHH coupling constants between H-10/H-9a and H-10/H-9b or (ii) dihedral angles mismatching J2b,3b 0 Hz and interatomic distances between H-6/H-12 and H-6/H-13 mismatching the corresponding NOESY correlations). The Gaussian 03 package59 was used for optimizing the remaining starting geometries by means of the density function theory with the B3LYP functional and the 6-31G* basis set in the gas phase.60 Dihedral angles and interatomic distances were taken from minimized conformers and compared with NMR data.
Expression of GABAA Receptors
Stage V–VI oocytes from Xenopus laevis were prepared and cRNA was injected as previously described by Khom et al. (2006).51 Female X. laevis (NASCO, Fort Atkinson, WI) were anesthetized by exposing them for 15 min to a 0.2% MS-222 (3-aminobenzoic acid ethyl ester methanesulfonate, Sigma-Aldrich, Munich, Germany) solution before surgically removing parts of the ovaries. Follicle membranes from isolated oocytes were enzymatically digested with 2 mg/mL collagenase from Clostridium histolyticum (Type 1A, Sigma-Aldrich). Synthesis of capped runoff poly(A+) cRNA transcripts was obtained from linearized cDNA templates (pCMV vector). One day after enzymatic isolation, the oocytes were injected with 50 nL of DEPC-treated H2O (Sigma-Aldrich) containing different cRNAs at a concentration of approximately 300–3000 pg/nL per subunit. The amount of injected cRNA mixture was determined by means of a NanoDrop ND-1000 (Kisker Biotech, Steinfurt, Germany). Rat cRNAs were mixed in a 1:1:10 ratio to ensure expression of the gamma subunit in α1β2γ2S receptors. Oocytes were then stored at 18 °C in an aqueous solution of 90 mM NaCl, 1 mM KCl, 1 mM MgCl2, 1 mM CaCl2, and 5 mM HEPES (pH 7.4), containing 1% of penicillin–streptomycin solution (Sigma-Aldrich).61 Voltage clamp measurements were performed between days 1 and 5 after cRNA injection.
Two-Microelectrode Voltage Clamp Studies
Electrophysiological experiments were performed by the two-microelectrode voltage clamp method at a holding potential of −70 mV making use of a TURBO TEC 03X amplifier (npi Electronic GmbH, Tamm, Germany) and an Axon Digidata 1322A interface (Molecular Devices, Sunnyvale, CA). Data were recorded by using pCLAMP v10.2 data acquisition software (Molecular Devices). Currents were low-pass-filtered at 1 kHz and sampled at 3 kHz. The bath solution contained 90 mM NaCl, 1 mM KCl, 1 mM MgCl2, 1 mM CaCl2, and 5 mM HEPES (pH 7.4). Electrode filling solution contained 2 M KCl.
Fast Solution Exchange during IGABA Recordings
Test solutions (100 μL) of extracts, fractions, and pure compounds were applied to the oocytes at a speed of 300 μL/s by means of the Screening Tool automated fast perfusion system (npi Electronic GmbH).19 In order to determine GABA EC5–10 (typically between 3 and 10 μM for receptors of the subunit combination α1β2γ2S), a concentration–response experiment with GABA concentrations ranging from 0.1 μM to 1 mM was performed. Stock solutions (10 mg/mL in DMSO) of A. calamus extract and open column fractions (1–21) were diluted to concentrations of 100 and 10 μg/mL, respectively, with bath solution containing GABA EC5–10. As previously described in a validated protocol, microfractions collected from the semipreparative HPLC separations were dissolved in 30 μL of DMSO and subsequently mixed with 2.97 mL of bath solution containing GABA EC5–10.29 For concentration–response experiments, bath solution containing compounds 1–6 in concentrations ranging from 0.1 to 1000 μM was applied to the oocyte. After a 20 s incubation period, a second application immediately followed containing the corresponding compound solution combined with GABA EC5–10.
Data Analysis
Enhancement of the GABA-induced chloride current (IGABA) was defined as I(GABA+Comp)/IGABA − 1, where I(GABA+Comp) is the current response in the presence of a given compound, and IGABA is the control GABA-induced chloride current. Data were analyzed using the ORIGIN 7.0 SR0 software (OriginLab Corporation) and are given as mean ± SE of at least 2 oocytes and ≥2 oocyte batches.
Supplementary Material
Supporting Information. Spectral characterization data of compounds 1 and 3–6 including 1H and 13C shifts from 1H NMR and 2D-heteronuclear NMR spectra, critical NOE enhancement data, accurate masses from ESI-TOF-MS spectra, and optical rotation values. Proton NMR, 2D homonuclear, and 2D heteronuclear NMR spectra of compound 2. Table summarizing the assignment of the relative configuration of 2 by molecular modeling and 1D and 2D NMR. Conformers of the stereoisomers of 2 were found by conformational analysis. This material is available free of charge via the Internet at http://pubs.acs.org.
ACKNOWLEDGMENT
We thank Dr. M. Smiesko of the Division of Molecular Modeling, University of Basel, Switzerland, and the URZ (Rechenzentrum of University of Basel) for support. Financial support from the Swiss National Science Foundation (Projects 31600-113109 and 205321-116157/1), the Mathieu-Stiftung of the University of Basel, Switzerland, and FWF (P22395) is gratefully acknowledged.
REFERENCES
- (1).Motley TJ. Econ. Bot. 1994;48:397–412. [Google Scholar]
- (2).Keller K, Stahl E. Planta Med. 1983;47:71–74. doi: 10.1055/s-2007-969954. [DOI] [PubMed] [Google Scholar]
- (3).Mazza GJ. Chromatogr. 1985;328:179–194. [Google Scholar]
- (4).Stahl E, Keller K. Planta Med. 1981;43:128–140. doi: 10.1055/s-2007-971489. [DOI] [PubMed] [Google Scholar]
- (5).Barnes J, Anderson LA, Phillipson JD. Herbal Medicines. Pharmaceutical Press, RPS Publishing; London, Grayslake: 2007. pp. 118–119. [Google Scholar]
- (6).Wichtl M, Bauer R, Blaschek W, Buff W, Hiller K, Lichius JJ, Loew D, Stahl-Biskup E, Teuscher E. Teedrogen und Phytopharmaka. Wissenschaftliche Vertragsgesellschaft mbH; Stuttgart: 2009. p. 98. [Google Scholar]
- (7).Chang H-M, But PP-H. Pharmacology and Applications of Chinese Materia Medica. World Scientific Publishing Co. Pte. Ltd.; Singapore: 1987. pp. 261–266. [Google Scholar]
- (8).Khare CP. Indian Herbal Remedies. Springer-Verlag; Berlin: 2004. pp. 19–20. [Google Scholar]
- (9).Williamson EM. Major Herbs of Ayurveda. Churchill Livingstone; Elsevier Science Ltd; London: 2002. pp. 16–19. [Google Scholar]
- (10).Dandiya PC, Cullumbine H, Sellers EA. J. Pharmacol. Exp. Ther. 1959;126:334–337. [PubMed] [Google Scholar]
- (11).Dandiya PC, Menon MK. Br. J. Pharmacol. 1963;20:436–442. doi: 10.1111/j.1476-5381.1963.tb01480.x. [DOI] [PMC free article] [PubMed] [Google Scholar]
- (12).Vohora SB, Shah SA, Dandiya PC. J. Ethnopharmacol. 1990;28:53–62. doi: 10.1016/0378-8741(90)90065-2. [DOI] [PubMed] [Google Scholar]
- (13).Liao JF, Huang SY, Jan YM, Yu LL, Chen CF. J. Ethnopharmacol. 1998;61:185–193. doi: 10.1016/s0378-8741(98)00042-7. [DOI] [PubMed] [Google Scholar]
- (14).Menon MK, Dandiya PC. J. Pharm. Pharmacol. 1967;19:170–175. doi: 10.1111/j.2042-7158.1967.tb08060.x. [DOI] [PubMed] [Google Scholar]
- (15).Zanoli P, Avallone R, Baraldi M. Phytother. Res. 1998;12:S114–S116. [Google Scholar]
- (16).Simon J, Wakimoto H, Fujita N, Lalande M, Barnard EA. J. Biol. Chem. 2004;279:41422–41435. doi: 10.1074/jbc.M401354200. [DOI] [PubMed] [Google Scholar]
- (17).Olsen RW, Sieghart W. Pharmacol. Rev. 2008;60:243–260. doi: 10.1124/pr.108.00505. [DOI] [PMC free article] [PubMed] [Google Scholar]
- (18).Olsen RW, Sieghart W. Neuropharmacol. 2009;56:141–148. doi: 10.1016/j.neuropharm.2008.07.045. [DOI] [PMC free article] [PubMed] [Google Scholar]
- (19).Baburin I, Beyl S, Hering S. Pflug. Arch. Eur. J. Phy. 2006;453:117–123. doi: 10.1007/s00424-006-0125-y. [DOI] [PMC free article] [PubMed] [Google Scholar]
- (20).Adams M, Christen M, Plitzko I, Zimmermann S, Brun R, Kaiser M, Hamburger M. J. Nat. Prod. 2010;73:897–900. doi: 10.1021/np100031c. [DOI] [PubMed] [Google Scholar]
- (21).Danz H, Stoyanova S, Wippich P, Brattstroem A, Hamburger M. Planta Med. 2001;67:411–416. doi: 10.1055/s-2001-15805. [DOI] [PubMed] [Google Scholar]
- (22).Dittmann K, Gerhaeuser C, Klimo K, Hamburger M. Planta Med. 2004;70:909–913. doi: 10.1055/s-2004-832615. [DOI] [PubMed] [Google Scholar]
- (23).Potterat O, Hamburger M. Curr. Org. Chem. 2006;10:899–920. [Google Scholar]
- (24).Potterat O, Wagner K, Gemmecker G, Mack J, Puder C, Vettermann R, Streicher R. J. Nat. Prod. 2004;67:1528–1531. doi: 10.1021/np040093o. [DOI] [PubMed] [Google Scholar]
- (25).Li Y, Plitzko I, Zaugg J, Hering S, Hamburger M. J. Nat. Prod. 2010;73:768–770. doi: 10.1021/np900803w. [DOI] [PubMed] [Google Scholar]
- (26).Yang X, Baburin I, Plitzko I, Hering S, Hamburger M. Mol. Diversity. 2011 doi: 10.1007/s11030-010-9297-7. DOI: 10.1007/s11030-010-9297-7. [DOI] [PMC free article] [PubMed] [Google Scholar]
- (27).Zaugg J, Baburin I, Strommer B, Kim HJ, Hering S, Hamburger M. J. Nat. Prod. 2010;73:185–91. doi: 10.1021/np900656g. [DOI] [PMC free article] [PubMed] [Google Scholar]
- (28).Zaugg J, Eickmeier E, Rueda DC, Hering S, Hamburger M. Fitoterapia. 2011 doi: 10.1016/j.fitote.2010.12.001. DOI: 10.1016/j.fitote.2010.12.001. [DOI] [PubMed] [Google Scholar]
- (29).Kim HJ, Baburin I, Khom S, Hering S, Hamburger M. Planta Med. 2008;74:521–526. doi: 10.1055/s-2008-1074491. [DOI] [PMC free article] [PubMed] [Google Scholar]
- (30).Baldwin SW, Fredericks JE. Tetrahedron Lett. 1982;23:1235–1238. [Google Scholar]
- (31).Delvalle DM, Schwenker G. Planta Med. 1987;53:230. doi: 10.1055/s-2006-962687. [DOI] [PubMed] [Google Scholar]
- (32).Niwa M, Terada Y, Iguchi M, Yamamura S. Chem. Lett. 1977:1415–1418. [Google Scholar]
- (33).Patra A, Mitra AK. J. Nat. Prod. 1981;44:668–669. [Google Scholar]
- (34).Rascher W, Wolf H. Tetrahedron. 1977;33:575–577. [Google Scholar]
- (35).Sawant SS, Youssef DTA, Sylwester PW, Wali V, El Sayed KA. Nat. Prod. Commun. 2007;2:117–119. [Google Scholar]
- (36).Weyerstahl P, Rilk R, Marschall-Weyerstahl H. Liebigs Ann. Chem. 1987;2:89–101. [Google Scholar]
- (37).Zdero C, Bohlmann F, Solomon JC, King RM, Robinson H. Phytochemistry. 1989;28:531–542. [Google Scholar]
- (38).Baxter RM, Dandiya PC, Kandel SI, Okany A, Walker GC. Nature. 1960;185:466–467. doi: 10.1038/185466a0. [DOI] [PubMed] [Google Scholar]
- (39).Iguchi M, Nishiyama A, Koyama H, Yamamura S, Hirata Y. Tetrahedron Lett. 1968;51:5315–5318. doi: 10.1016/s0040-4039(01)88499-9. [DOI] [PubMed] [Google Scholar]
- (40).Iguchi M, Nishiyama A, Yamamura S, Hirata Y. Tetrahedron Lett. 1970;11:855–857. doi: 10.1016/s0040-4039(01)88499-9. [DOI] [PubMed] [Google Scholar]
- (41).Vrkoc J, Herout V, Sorm F. Collect. Czech. Chem. Commun. 1961;26:3183–3185. [Google Scholar]
- (42).Rohr M, Naegeli P, Daly JJ. Phytochemistry. 1979;18:279–281. [Google Scholar]
- (43).Wong HF, Brown GD. J. Chem. Res. 2002;S:30–33. [Google Scholar]
- (44).Khom S, Baburin I, Timin E, Hohaus A, Trauner G, Kopp B, Hering S. Neuropharmacology. 2007;53:178–187. doi: 10.1016/j.neuropharm.2007.04.018. [DOI] [PubMed] [Google Scholar]
- (45).Stahl E, Keller K. Planta Med. 1983;47:75–78. doi: 10.1055/s-2007-969955. [DOI] [PubMed] [Google Scholar]
- (46).Yamamura S, Iguchi M, Nishiyama A, Niwa M, Koyama H, Hirata Y. Tetrahedron. 1971;27:5419–5431. [Google Scholar]
- (47).Twyman RE, Rogers CJ, Macdonald RL. Neurosci. Lett. 1989;96:89–95. doi: 10.1016/0304-3940(89)90248-6. [DOI] [PubMed] [Google Scholar]
- (48).Benke D, Barberis A, Kopp S, Altmann KH, Schubiger M, Vogt KE, Rudolph U, Mohler H. Neuropharmacology. 2009;56:174–81. doi: 10.1016/j.neuropharm.2008.06.013. [DOI] [PubMed] [Google Scholar]
- (49).Khom S, Strommer B, Ramharter J, Schwarz T, Schwarzer C, Erker T, Ecker GF, Mulzer J, Hering S. Br. J. Pharmacol. 2010;161:65–78. doi: 10.1111/j.1476-5381.2010.00865.x. [DOI] [PMC free article] [PubMed] [Google Scholar]
- (50).Kopp S, Baur R, Sigel E, Mohler H, Altmann KH. Chem. Med. Chem. 2010;5:678–81. doi: 10.1002/cmdc.201000062. [DOI] [PubMed] [Google Scholar]
- (51).Khom S, Baburin I, Timin EN, Hohaus A, Sieghart W, Hering S. Mol. Pharmacol. 2006;69:640–9. doi: 10.1124/mol.105.017236. [DOI] [PubMed] [Google Scholar]
- (52).Abel G. Planta Med. 1987;53:251–253. doi: 10.1055/s-2006-962694. [DOI] [PubMed] [Google Scholar]
- (53).Goeggelmann W, Schirmer O. Mutat. Res. 1983;121:191–194. doi: 10.1016/0165-7992(83)90202-6. [DOI] [PubMed] [Google Scholar]
- (54).Taylor JM, Jones WI, Hagan EC, Gross MA, Davis DA, Cook EL. Toxicol. Appl. Pharmacol. 1967;10:405. [Google Scholar]
- (55).Malhotra CL, Das PK, Dhalla NS. Arch. Int. Pharmacodyn. Ther. 1962;138:537–547. [PubMed] [Google Scholar]
- (56).Mukherjee PK, Kumar V, Mal M, Houghton PJ. Pharm. Biol. 2007;45:651–666. [Google Scholar]
- (57).Lipinski CA, Lombardo F, Dominy BW, Feeney PJ. Adv. Drug Delivery Rev. 1997;23:3–25. doi: 10.1016/s0169-409x(00)00129-0. [DOI] [PubMed] [Google Scholar]
- (58).Fluegge J. Grundlagen der Polarimetrie. Zeiss Verlag; Oberkochen, Ost-Württemberg: 1970. p. 62.p. 88. [Google Scholar]
- (59).Frisch MJ, Trucks GW, Schlegel HB, Scuseria GE, Robb MA, Cheeseman JR, Montgomery JA, Jr., Vreven T, Kudin KN, Burant JC, Millam JM, Iyengar SS, Tomasi J, Barone V, Mennucci B, Cossi M, Scalmani G, Rega N, Petersson GA, Nakatsuji H, Hada M, Ehara M, Toyota K, Fukuda R, Hasegawa J, Ishida M, Nakajima T, Honda Y, Kitao O, Nakai H, Klene M, Li X, Knox JE, Hratchian HP, Cross JB, Bakken V, Adamo C, Jaramillo J, Gomperts R, Stratmann RE, Yazyev O, Austin AJ, Cammi R, Pomelli C, Ochterski JW, Ayala PY, Morokuma K, Voth GA, Salvador P, Dannenberg JJ, Zakrzewski VG, Dapprich S, Daniels AD, Strain MC, Farkas O, Malick DK, Rabuck AD, Raghavachari K, Foresman JB, Ortiz JV, Cui Q, Baboul AG, Clifford S, Cioslowski J, Stefanov BB, Liu G, Liashenko A, Piskorz P, Komaromi I, Martin RL, Fox DJ, Keith T, Al-Laham MA, Peng CY, Nanayakkara A, Challacombe M, Gill PMW, Johnson B, Chen W, Wong MW, Gonzalez C, Pople JA. Gaussian 03. Revision E.01 Gaussian, Inc.; Wallingford, CT: 2004. [Google Scholar]
- (60).Bringmann G, Bruhn T, Makismenka K, Hemberger Y. Eur. J. Org. Chem. 2009;17:2717–2727. [Google Scholar]
- (61).Methfessel C, Witzemann V, Takahashi T, Mishina M, Numa S, Sakmann B. Pflug. Arch. Eur. J. Phys. 1986;407:577–588. doi: 10.1007/BF00582635. [DOI] [PubMed] [Google Scholar]
- (62).Krampfl K, Wolfes H, Dengler R, Bufler J. Eur. J. Pharmacol. 2002;435:1–8. doi: 10.1016/s0014-2999(01)01558-8. [DOI] [PubMed] [Google Scholar]
Associated Data
This section collects any data citations, data availability statements, or supplementary materials included in this article.
Supplementary Materials
Supporting Information. Spectral characterization data of compounds 1 and 3–6 including 1H and 13C shifts from 1H NMR and 2D-heteronuclear NMR spectra, critical NOE enhancement data, accurate masses from ESI-TOF-MS spectra, and optical rotation values. Proton NMR, 2D homonuclear, and 2D heteronuclear NMR spectra of compound 2. Table summarizing the assignment of the relative configuration of 2 by molecular modeling and 1D and 2D NMR. Conformers of the stereoisomers of 2 were found by conformational analysis. This material is available free of charge via the Internet at http://pubs.acs.org.