Abstract
The G-protein activator mastoparan (MP) was found to elicit the hypersensitive response (HR) in isolated Asparagus sprengeri mesophyll cells at micromolar concentrations. The HR was characterized by cell death, extracellular alkalinization, and an oxidative burst, indicated by the reduction of molecular O2 to O2⋅−. To our knowledge, this study was the first to monitor photosynthesis during the HR. MP had rapid and dramatic effects on photosynthetic electron transport and excitation energy transfer as determined by variable chlorophyll a fluorescence measurements. A large increase in nonphotochemical quenching of chlorophyll a fluorescence accompanied the initial stages of the oxidative burst. The minimal level of fluorescence was also quenched, which suggests the origin of this nonphotochemical quenching to be a decrease in the antenna size of photosystem II. In contrast, photochemical quenching of fluorescence decreased dramatically during the latter stages of the oxidative burst, indicating a somewhat slower inhibition of photosystem II electron transport. The net consumption of O2 and the initial rate of O2 uptake, elicited by MP, were higher in the light than in the dark. These data indicate that light enhances the oxidative burst and suggest a complex relationship between photosynthesis and the HR.
Plants employ a wide array of defense mechanisms against pathogenic microbes. Although plants have protective structures that are always in place (including cuticle layers and thick cell walls) and constitutive biochemical defenses (such as fungitoxic exudates), many resistance strategies are induced after an encounter with a pathogen (Johal et al., 1995). The HR is an induced plant-resistance mechanism. The HR has been defined as localized cell death in an area of pathogen invasion, a phenomenon that may function to isolate and thus limit colonization by biotrophic pathogens (Mehdy, 1994). Certain characteristics have consistently been observed in conjunction with hypersensitive cell death. These include ion fluxes across the plasma membrane (namely Ca2+ influx and K+ and Cl− effluxes), external pH changes (usually alkalinization; Atkinson et al., 1985; Levine et al., 1994), plasma membrane depolarization (Keppler and Novacky, 1986), and the oxidative burst, which features the consumption of molecular O2 and its reduction to O2⋅− at the plasma membrane (Bolwell et al., 1995). Cell death accompanied by these phenomena provides substantial evidence for the HR.
Micromolar concentrations of MP have been used to evoke cellular responses, similar to those evoked by fungal elicitors, in suspension cultures of parsley (Kauss and Jeblick, 1995) and soybean cells (Legendre et al., 1992, 1993; Chandra et al., 1996), as well as in etiolated cucumber hypocotyls (Kauss and Jeblick, 1996). First isolated from wasp venom, MP is an amphipathic tetradecapeptide. Although MP possesses numerous biological activities, at micromolar concentrations it is best known for its ability to activate G proteins (Higashijima et al., 1988, 1990). Although it exists as a random coil in aqueous solution, MP takes on an α-helical secondary structure when associated with a lipid bilayer (Higashijima et al., 1983). In this form MP displays four positive charges similar to the cytosolic domain of an activated ligand-receptor complex in the plasma membrane. MP accelerates the exchange of GDP (bound by inactive G protein) for GTP (bound by active G protein) in the α-subunit (Ross and Higashijima, 1994). Thus, MP activation of the HR provides evidence for G-protein signal transduction linking of elicitor recognition and the HR.
The centrality of photosynthesis to plant function argues for the use of photosynthetic tissue or cells in the investigation of plant responses to environmental stimuli. In particular, investigations of the HR using nonphotosynthetic plant cell cultures may misrepresent the in situ response of photosynthetic cells that may be affected directly or indirectly by light. There is some evidence for light stimulation of the HR. For example, severe necrosis was observed in 11-week-old tomato plants that had been unshaded, whereas heavily shaded plants of the same type and age were nonnecrotic. Thus, the “reduction of light prevented the development of typical symptoms of necrosis” (Langford, 1948). In another study necrosis in tomato leaf tissue induced by incompatible fungal elicitation was delayed in the dark (Peever and Higgins, 1989). In Arabidopsis mutants necrotic lesions were induced by red and white light in the absence of a pathogen (Genoud et al., 1998). Conversely, cell death in response to the HR will inevitably inhibit photosynthesis. Chlorophyll fluorescence is inversely related to photosynthetic activity. Thus, fluorescence signals may offer a mechanism to investigate events associated with the HR-induced cell death, but the relationship between photosynthesis and the HR remains unclear.
Investigations using mesophyll cells isolated from Asparagus sprengeri Regel may elucidate these relationships. Mechanical isolation yields a suspension of photosynthetically competent cells that is separated from in planta conditions by only 1 or 2 h (Colman et al., 1979). The photosynthetic capacity of these cells makes PAM fluorometry measurements of chlorophyll a fluorescence possible. We used in vivo chlorophyll fluorescence measurements to monitor the status of photosynthesis in hypersensitively responding cells. To our knowledge, this is the first study that analyzes the HR with PAM fluorometry.
The questions posed in this study are: Does MP induce the HR, or is it merely cytotoxic? Does light stimulate the MP-induced oxidative burst? Does MP inhibit photosynthesis?
MATERIALS AND METHODS
Cell Isolation and Incubation
Photosynthetically competent mesophyll cells from greenhouse-grown Asparagus sprengeri Regel were isolated mechanically each day (Colman et al., 1979). For 5 min prior to initiation of measurements, cells were preincubated in a 5 mm Mes buffer (pH 6.0) that contained 1 mm CaSO4. For alkalinization experiments cells were resuspended in 1 mm CaSO4 without buffer. Depending on the experiment, cell-suspension volumes varied from 1 to 5 mL and cell concentrations ranged from 1.5 × 10⁶ to 6 × 10⁶ cells mL−1. Cell suspensions were gently stirred. All chemicals added to cell suspensions were in aqueous solution, and the concentrations indicated were final. MP from Vespula lewisii and Mas17, an inactive MP analog, were obtained from Peninsula Laboratories (Belmont, CA) and Bachem BioSciences (Philadelphia, PA). Mas7, a potent and inexpensive analog of MP obtained from Calbiochem, achieved results indistinguishable from those induced by MP and thus was used in later experiments. Since MP partitions into membranes (Cho et al., 1995), the effective concentration depends on cell density. Thus, although nominal MP concentrations are reported in micromolar units, when expressed in terms of cell number, they ranged from 4.2 to 8.8 nmol 106 cells−1.
Cell Viability Determination
Uptake of Evan's blue dye was used to visualize dead mesophyll cells (Colman et al., 1979). Cells were counted with a hemocytometer and percentages of dead cells were tabulated. Mechanically isolated cell suspensions normally had 16% to 17% dead cells. Only cell suspensions with more than 75% viable cells were used in our experiments. Cells were also incubated simultaneously with Evan's blue dye and fluorescein diacetate to assess cell viability (Withers, 1985). Cells that accumulated free fluorescein and fluoresced yellow-green upon UV irradiation were deemed viable. Using a fluorescent microscope (Wild Leitz, Heerbrugg, Switzerland) equipped with a camera, photographs of cells were taken from the same field of view under both bright and dark fields to evaluate viability with Evan's blue dye and fluorescein diacetate, respectively. To determine the complementarity of the two viability tests, cell death was quantified from the photographs.
Measurement of Extracellular Alkalinization
MP-induced alkalinization of the A. sprengeri mesophyll cell-suspension medium was monitored with a recording pH apparatus (PHM 64 research pH meter and REC 61 Servograph, Radiometer, Copenhagen, Denmark) (McCutcheon and Bown, 1987). Three milliliters of suspension (containing 4.5 × 10⁶ cells in 1 mm CaSO4) was transferred to a water-jacketed vessel at 25°C. The initial pH was adjusted to 5 with dilute H2SO4. After 5 min of dark adaptation, 13.2 μm MP was added, keeping the suspension in the dark. After alkalinization was completed, back-titration with standard 0.10 n HCl allowed us to quantify the nanomoles of H+ per 106 cells involved in the alkalinization response.
Chlorophyll a Fluorescence Measurements
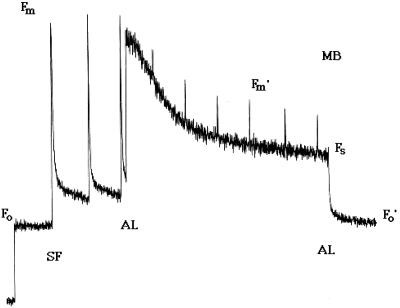
Modulated chlorophyll a fluorescence emission was measured in vivo using a PAM fluorometer (PAM 101, Heinz Walz, Effeltrich, Germany) (Genty et al., 1989). The intensity of the measuring beam was approximately 0.02 μmol m−2 s−1 at a frequency of 1.6 kHz. This intensity was insufficient to drive appreciable photosynthetic O2 evolution. Measuring beam frequency was switched to 100 kHz during periods in which actinic light was employed to drive photosynthesis, to enhance the resolution of the signal. Three million cells in 2 mL of 5 mm Mes and 1 mm CaSO4, pH 6.0, were dark-adapted for 5 min at 25°C with 500 μm KHCO3. An initial exposure to the measuring beam, in addition to far-red light, was done to establish the Fo (Fig. 1). At Fo all PSII reaction centers have an oxidized QA. Subsequently, 500-ms saturating flashes were delivered at 20- or 40-s intervals to transiently reduce QA, producing Fm. After several saturating flashes (approximately 6000 μmol m−2 s−1 each), continuous white actinic light (60 μmol m−2 s−1) from a halogen lamp was added. This intensity maximized photosynthetic O2 evolution while minimizing photoinhibition. The actinic light generated Fs after 1 to 2 min. Saturating flashes applied in the presence of actinic light produce Fm′ levels, which are lower than Fm due to the presence of qN of fluorescence. Fo′ was determined by extinguishing the white actinic light, by illuminating the cells with far-red light, and, in experiments where O2 had been consumed by the MP-induced oxidative burst, by the reintroduction of O2. Fm, Fm′, Fo, Fo′, and Fs levels were used to calculate qP and qN as described by van Kooten and Snel (1990):
 |
 |
Figure 1.
Sample of PAM chlorophyll a fluorescence yield from a suspension of isolated asparagus mesophyll cells. AL, Actinic light; MB, measuring beam; SF, saturating flash.
Measurement of [O2]
The photosynthetic O2 evolution of 3 × 10⁶ cells in 2 mL of 5 mm Mes and 1 mm CaSO4, pH 6.0, at 25°C was measured using a Clark-type electrode (DW1, Hansatech, King's Lynn, Norfolk, UK), which was calibrated using sodium dithionite. Light sources used in chlorophyll fluorescence measurements were set up around the O2 electrode so that fluorescence and O2 could be measured simultaneously. Before the dark adaptation prior to each experiment, 500 μm KHCO3 was added to ensure that the cells did not exhaust dissolved inorganic C. The actinic light (as described above) was used to induce photosynthetic O2 evolution. Initial rates of O2 consumption in response to MP or Mas 7 are expressed in micromoles of O2 per milligram of chlorophyll per hour, and net O2 consumption is expressed in micromoles of O2 per milligram of chlorophyll.
Measurement of O2⋅−
To measure O2⋅−, 3 × 10⁶ cells were incubated for 5 min in 330 μL of 1 mm CaSO4, pH 5.5. After the addition of 5 μm Mas7, a 200-μL aliquot of cell suspension was transferred to a cuvette containing 700 μL of 100 μm Gly-NaOH buffer, 1 mm EDTA, and 110 μm lucigenin, pH 9.0 (Jabs et al., 1997). Chemiluminescence was measured within approximately 5 s of the transfer, and the time course of O2⋅− production was monitored using a recorder connected to a luminometer (model 1250, LKB Wallac Oy, Turku, Finland).
RESULTS
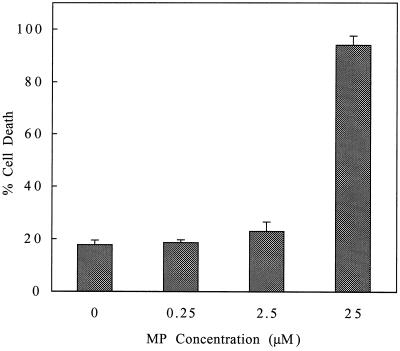
Cell viability was assessed with Evan's blue dye after incubating cell suspensions with either 0, 0.25, 2.5, or 25 μm MP (Fig. 2). Although cell viability after incubation with 0.25 and 2.5 μm MP did not differ notably from the control levels (0 μm MP), incubation with 25 μm MP resulted in a significantly higher percentage of dead cells (94.0%) as compared with the control (17.7%). Thus, the threshold concentration of MP required to induce cell death is between 2.5 and 25 μm.
Figure 2.
Cell viability as a function of MP concentration. Two-milliliter cell suspensions containing 12 × 106 cells were incubated with either 0, 0.25, 2.5, or 25 μm MP. After 16 min of incubation with MP, the cells were incubated with Evan's blue dye for assessment of viability. Percentage cell death represents the mean of three experiments. se bars are shown.
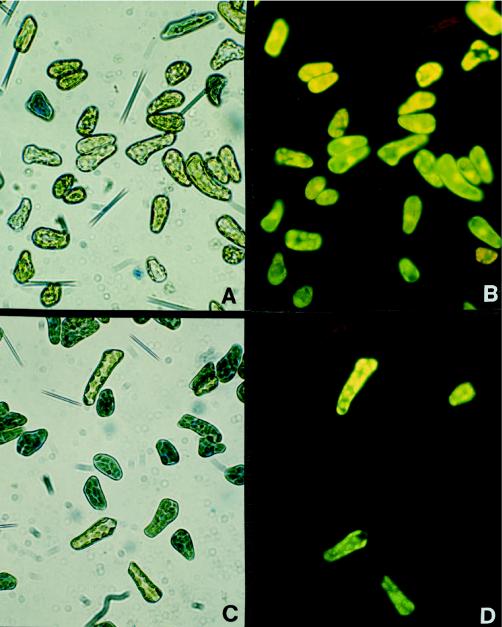
To confirm viability determinations with Evan's blue dye, the viability of cells incubated ±25 μm MP was assessed with Evan's blue dye in conjunction with fluorescein diacetate. Photographs confirmed the complementarity of the two tests; Evan's blue dye and fluorescein diacetate viability tests identified the same cells to be dead (Fig. 3). In the absence of MP, the two tests indicated 15% cell death (n = 250 cells), and in the presence of MP, both tests indicated 80% dead cells (n = 100 cells).
Figure 3.
Individual cell viability assayed with Evan's blue dye and fluorescein diacetate. Two 2.5-mL cell suspensions, each containing 10 × 106 cells, were incubated for 16 min with and without 25 μm MP, respectively. Cells were then incubated with fluorescein diacetate in conjunction with Evan's blue dye. Photographs were taken of the same fields of view under both bright and dark fields. These photographs represent control cells under bright (A) and dark (B) fields, and MP-treated cells under bright (C) and dark (D) fields.
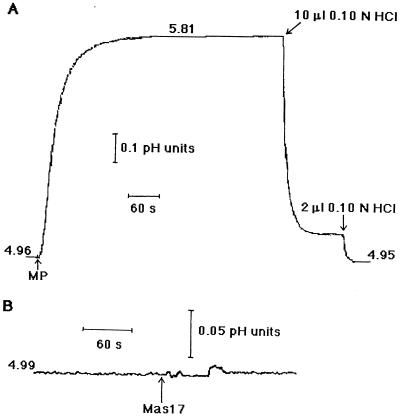
Cell death is indicative of the HR, as are rapid changes in the pH of the cell-suspension medium. MP initiated alkalinization within 2 s. The pH rose 0.85 pH units, which was equivalent to 270 nmol H+ 106 cells−1 (Fig. 4A). The addition of Mas17, an inactive analog of MP, did not result in alkalinization (Fig. 4B). The cell-dependent alkalinization was not reversed after 20 min and was pH dependent. When the initial pH was 6.0, only a slight alkalinization was observed, and when the initial pH was 7.0, no alkalinization occurred in response to MP (data not shown). Repeat additions of MP after approximately 4 to 5 min did not result in further alkalinization of the medium (data not shown).
Figure 4.
The effect of MP and Mas17 on the pH of the incubating medium. The pH of suspensions containing 4.5 × 10⁶ cells in 3 mL of 1 mm CaSO4 was adjusted to approximately 5.0. A, The addition of 13.2 μm MP and two aliquots of 0.10 n HCl (for back-titration) are indicated by arrows. B, The addition of 13.2 μm Mas17 is indicated by an arrow. This figure is a representative of five runs.
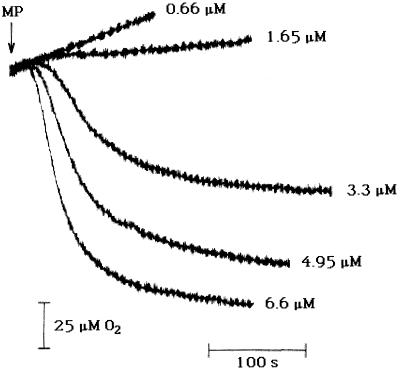
Another characteristic of the HR is the consumption of molecular O2. The concentration dependence of MP-induced O2 consumption was investigated (Fig. 5). Of the five MP concentrations involved, only 3.3, 4.95, and 6.6 μm caused net O2 consumption. Thus, the threshold MP concentration for the stimulation of rapid and transient O2 consumption is between 1.65 and 3.3 μm. The threshold MP concentration for decreasing viability of cells is between 2.5 and 25 μm (Fig. 2). These threshold concentration ranges overlap, suggesting a single mechanism that results in an oxidative burst and in increased cell death.
Figure 5.
The effect of MP concentration on O2 consumption in the light. This figure shows O2 consumption measurements compiled from five separate PAM experiments. In each experiment 2 mL of 5 mm Mes and 1 mm CaSO4, pH 6.0, contained 3 × 10⁶ cells. Aliquots of MP were added to give the concentrations indicated.
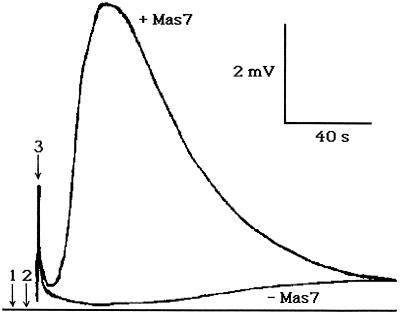
The consumption of O2 has been attributed to its reduction to O2⋅−. The chemiluminescent lucigenin assay for O2⋅− demonstrated that Mas7, a highly potent MP analog, stimulated O2⋅− production (Fig. 6). A burst of O2⋅− was initiated 20 s after Mas7 addition and lasted approximately 80 s. The disappearance of O2 and the appearance of O2⋅− were highly synchronous events (Figs. 7 and 6, respectively).
Figure 6.
The effect of Mas7 on O2⋅− production. Three million cells were incubated in 330 mL of 1 mm CaSO4, pH 5.5, for 5 min. Arrow 1 indicates the addition of 5 μm Mas7 to the cell suspension. Arrow 2 indicates transfer of 200 μL of the cell suspension to the luminometer cuvette. Arrow 3 indicates an artifact due to stray light detected by the photomultiplier as the cuvette is inserted into the luminometer. This figure is a representative of six runs.
Figure 7.
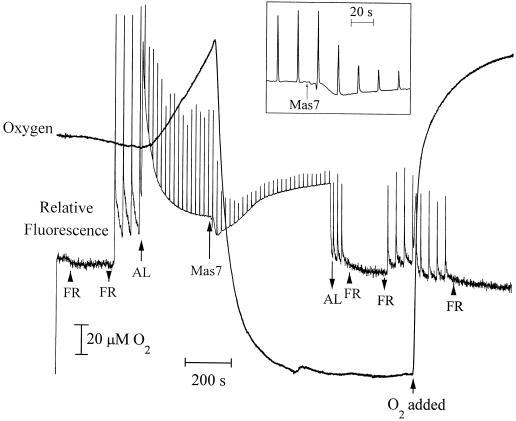
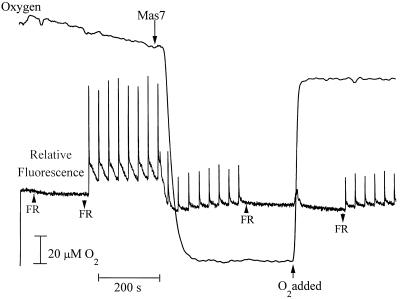
The effect of Mas7 on chlorophyll a fluorescence yield and O2 level in the light. Two milliliters of 5 mm Mes and 1 mm CaSO4, pH 6.0, contained 3 × 10⁶ cells. Far-red light (FR), actinic light (AL), 22 μm MP, and O2 were added (↑) or removed (↓) as indicated. The inset represents relative fluorescence immediately before and after Mas7 addition. This figure is a representative of 20 runs.
A PAM fluorometer in conjunction with an O2 electrode was used to obtain simultaneous measures of O2 consumption and relative fluorescence in illuminated cells. O2 consumption was initiated 12 (±1 se) s after Mas7 addition. Net consumption of 387 (±22 se) nmol of O2 occurred within 100 to 200 s (Fig. 7).
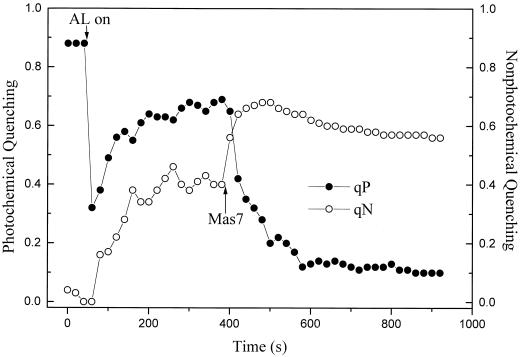
After this consumption of O2 no further photosynthetic O2 evolution was measured. During the rapid initial consumption of O2 the PAM fluorescence trace was dominated by a dramatic decrease of Fs and Fm′ (Fig. 7). The decrease in Fm′ indicated an increase in qN, whereas the decrease in Fs reflected a maintenance of qP (Fig. 8). These results demonstrate a continued oxidation of QA during the period in which the cells were rapidly consuming O2. In some experiments a small increase in qP immediately followed the addition of Mas7 (data not shown).
Figure 8.
The effect of Mas7 on qP and qN, respectively over time. Values of qP and qN shown were calculated from one representative trial. Actinic light (AL) and 22 μm Mas7 were administered as indicated by the arrows.
As the oxidative burst continued and the [O2] approached its minimum value, Fs and Fm′ increased (Fig. 7). These changes were indicative of a large decrease in qP and a relatively smaller decrease in qN (Fig. 8). In spite of this small decrease, qN remained higher than at any time before the addition of Mas7. After the actinic light was extinguished, Fs dropped dramatically but Fm′ was unchanged (Fig. 7). This indicates that qP quickly increased in the dark, whereas qN was unaffected by the actinic illumination (not shown). Finally, the subsequent addition of O2 decreased Fs and Fm′ (Fig. 7). This is indicative of a small O2-induced increase in qN and a very small increase in qP (not shown). These effects of O2 on qN and qP are consistent with the dual role of O2 as a quencher of excitation energy in the antenna and as an acceptor of electrons from the electron transport chain in the Mehler reaction (Vidaver et al., 1981).
In other experiments (data not shown), it was demonstrated that the high qN always observed after the addition of Mas7 could not be relieved by the addition of the uncoupler nigericin. Nigericin was, however, competent to relieve any light-induced qN observed in the absence of Mas7 (data not shown). In other control experiments neither the addition of Mas7 to cells killed by freezing in liquid nitrogen nor the addition of Mas17 to living cells resulted in O2 consumption or in changes in chlorophyll fluorescence.
When Mas7 was added to nonilluminated cells, net O2 consumption and a dramatic decrease in Fm′ were observed as in the light (Fig. 9). The oxidative burst and the increase in qN were therefore not light dependent. In the absence of light, however, the rate and extent of Mas7-induced O2 consumption were significantly lower (Table I). The Fo level upon addition of Mas7 was lower than the initial Fo level achieved with far-red illumination, suggesting a change in organization of the antenna in response to Mas7. In contrast to experiments in the light, Fs did not increase after the oxidative burst, which suggests the origin of the decreased qP observed in the light to be a limitation on the electron acceptor side of PSII. As observed in the light, the reintroduction of O2 in the dark was accompanied by a small increase in qN.
Figure 9.
The effect of Mas7 on chlorophyll a fluorescence yield and O2 level in the dark. Two milliliters of 5 mm Mes and 1 mm CaSO4, pH 6.0, contained 3 × 10⁶ cells. Cell suspensions were not illuminated with actinic light. Far-red light (FR), 22 μm MP, and O2 were added (↑) or removed (↓) as indicated. This figure is a representative of 10 runs.
Table I.
The effect of MP on O2 consumption in the light and in dark
| Condition | Initial Rate of O2 Consumption | Net O2 Consumption |
|---|---|---|
| μmol O2 mg−1 chlorophyll hr−1 | μmol mg−1 chlorophyll | |
| Light | 260 ± 4 | 3.8 ± 0.03 |
| Dark | 210 ± 4 | 2.4 ± 0.16 |
Two milliliters of 5 mm Mes and 1 mm CaSO4, pH 6.0, contained 3 × 10⁶ cells. MP (13.2 μm) was added to cell suspensions that were irradiated with actinic light and to suspensions kept in the dark. Mean initial rates of O2 consumption after MP addition and mean net O2 consumption values are shown. se values are included (n = 3). Wilcoxon rank sign analysis indicates that the probability that both of these parameters are not significantly different from the light to the dark is 0.05.
DISCUSSION
Characteristics of the HR include alkalinization of the extracellular medium, O2 consumption, production of O2⋅−, and cell death (Boller, 1989; Ebel and Cosio, 1994; Hammond-Kosack and Jones, 1996). In asparagus mesophyll cells, MP or its active analog Mas7 induces cell death (Fig. 2), alkalinization of the medium (Fig. 4A), O2 consumption (Figs. 5, 7, and 9), and concurrent O2⋅− generation (Fig. 6). Thus, the evidence indicates that MP induces the HR in asparagus cells and is not merely cytotoxic. Previous work demonstrated a MP-stimulated oxidative burst in suspension-cultured soybean (Legendre et al., 1992, 1993) and parsley cells (Kauss and Jeblick, 1995). Furthermore, 10 μm MP (as well as guanine nucleotides) was shown to stimulate plasma membrane NADH oxidase activity in etiolated soybean hypocotyls (Morré et al., 1993). Because the oxidative burst is a critical component of the HR (Doke, 1983), the stimulation of the oxidative burst by MP (Fig. 5) or Mas7 (Figs. 7 and 8) is consistent with elicitation of the HR by these agents.
MP is a tetradecapeptide found in wasp venom and is known to activate G proteins in animal cells (Higashijima et al., 1988, 1990). In plant cells evidence for G-protein activation by MP is indirect. Various measures of phosphoinositide-based signal transduction in plants have been obtained in response to MP. Transient MP-stimulated increases in inositol triphosphate levels have been observed in Samanea saman pulvini protoplasts (Kim et al., 1996), cultured carrot cells (Drøbak and Watkins, 1994; Cho et al., 1995), and A. sprengeri mesophyll cells (data not shown). Enhanced phospholipase C activity has also been measured in wheat root microsomes in response to 25 μm MP (Jones and Kochian, 1995). In addition, microinjection of Mas7 into staminal hairs of Setcreasea purpurea induced an increase in intracellular Ca2+, an effect that was mimicked by inositol triphosphate microinjection (Tucker and Boss, 1996). MP elicited a greater oxidative burst in etiolated cucumber hypocotyls in comparison with fungal elicitor and other fungally derived compounds, indicating that the rate of the MP-stimulated oxidative burst was not limited by elicitor-receptor binding in contrast with the other “elicitors” (Kauss and Jeblick, 1996). The data are consistent with G-protein activation of the oxidative burst by MP.
The death of asparagus cells was assessed with Evan's blue dye (Fig. 2) and was confirmed with fluorescein diacetate (Fig. 3). The use of a fluorescent inclusion dye in conjunction with a nonfluorescent exclusion dye to test plant cell viability has been demonstrated previously (Huang et al., 1986) and allows for simultaneous, independent tests for living cells. Because complementary data were generated with these two tests (Fig. 3), it can be concluded that the Evan's blue test alone provides a good measure of cell death.
The alkalinization observed in response to MP (Fig. 4) was not reversed after 20 min and was pH dependent. Only slight alkalinization was observed when the starting pH was 6.0 and none occurred with a starting pH of 7.0. Furthermore, after MP addition to the cells, titration of the suspension medium indicated an 18% increase in buffering capacity (data not shown). Alternatively, alkalinization due to the elicitation of cultured tomato cells by ergosterol was transient, lasting from 10 to 15 min (Granado et al., 1995). The present findings are more consistent with electrolyte leakage from hypersensitively responding cells than with altered H+ translocation mechanisms.
The oxidative burst stimulated by MP was confirmed by two separate measurements, the consumption of O2 (Fig. 5) and the production of O2⋅− (Fig. 6). Superoxide production was calibrated using O2⋅− generated by xanthine/xanthine oxidase (Murphy and Auh, 1996). Over 95% of the O2 consumed could be accounted for by O2⋅− production.
Many investigations of the HR have been performed using suspension-cultured plant cells. Such cells are nonphotosynthetic. In this study the PAM fluorometer was used to measure chlorophyll a fluorescence and O2 levels as photosynthetic asparagus cells underwent a MP-stimulated oxidative burst.
Significant changes in photosynthesis occur during the MP-stimulated oxidative burst. The cessation of net photosynthetic O2 evolution (Fig. 7) indicates an inhibition of linear electron transport. During the oxidative burst a large degree of qP of fluorescence was maintained as indicated by the low level of Fs compared with Fm′. This indicates that the QA of PSII was still being oxidized in the light during the oxidative burst. Upon completion of the oxidative burst the Fs increased and approached the Fm′ level, indicating almost complete inhibition of qP and therefore of photosynthetic electron transport. These phenomena were also observed when the cells were placed in a high osmoticum buffer, containing 330 m[scap]m sorbitol and 5 mm MgCl, ruling out the possibility that the changes were due to bursting of the chloroplasts and/or to destacking of the thylakoid membranes.
Another dramatic change in PSII was the large increase in qN characterized by the large decrease in Fm′, which accompanied the oxidative burst in the light (Fig. 7) and in the dark (Fig. 9). Most qN is caused by “energization” of thylakoid membranes, which results from the formation of a pH gradient. It is therefore termed “energy-dependent” quenching (Neubauer and Schreiber, 1988; Schreiber et al., 1991). Some stromal alkalinization and lumen acidification normally occur due to the proton pumping associated with photosynthetic electron transport. Thus, in the light, a degree of qN is observed. qN due to ΔpH formation may be relieved by the protonophore nigericin. MP-induced qN was not relieved by the addition of nigericin (data not shown), indicating that it is not a result of a pH gradient across thylakoid membranes. Photoinhibition is not a likely explanation of the increase in qN because the effect occurred in the dark as well. An inhibition of the electron donor side of PSII and/or a decrease in its antenna size would also result in an increase in qN (Bruce et al., 1997). Support for this decrease in antenna size is provided by the decrease in Fo level observed in response to Mas7. Further experiments are required to investigate these possibilities.
The data indicate that light stimulates the rate and extent of O2 consumption in the oxidative burst (Table I). They complement previous reports indicating that light may stimulate the HR (Langford, 1948; Peever and Higgins, 1989; Genoud et al., 1998). Application of the HR elicitor cryptogein to tobacco cells results in an oxidation of NADPH, which triggers activation of the pentose phosphate pathway, providing NADPH for a plasma membrane NADPH oxidase. These events are essential for the HR; inhibition of the pentose phosphate pathway in turn inhibits the oxidative burst, external alkalinization, and cytoplasmic acidification (Pugin et al., 1997). The depletion of reducing power may in fact lead to the death of the cells.
In response to the questions posed in this study, we have drawn the following conclusions: (a) MP induces the HR, (b) light stimulates the MP-induced oxidative burst, and (c) MP ultimately inhibits photosynthesis.
ACKNOWLEDGMENT
We would like to thank Thomas Burian for calibrating the O2⋅− produced by the cells.
Abbreviations:
- Fm
maximal fluorescence
- Fm′
maximal fluorescence in any light-adapted state
- Fo
minimal (background) fluorescence
- Fo′
minimal fluorescence in any light-adapted state
- Fs
steady-state fluorescence
- HR
hypersensitive response
- MP
mastoparan
- PAM
pulse-amplitude-modulated
- QA
the primary quinone electron acceptor of PSII
- qN
nonphotochemical quenching
- qP
photochemical quenching
Footnotes
This work was supported by operating grants from the Natural Sciences and Engineering Research Council (NSERC) of Canada to A.W.B. and D.H.B. L.J.A. and R.S.K. were the recipients of NSERC postgraduate scholarships.
LITERATURE CITED
- Atkinson MM, Huang J-S, Knopp JA. The hypersensitive reaction of tobacco to Pseudomonas syringae pv. pisi. Activation of a plasmalemma K+/H+ exchange mechanism. Plant Physiol. 1985;79:843–847. doi: 10.1104/pp.79.3.843. [DOI] [PMC free article] [PubMed] [Google Scholar]
- Boller T (1989) Primary signals and second messengers in the reaction of plants to pathogens. In WF Boss, DJ Morré, eds, Second Messengers in Plant Growth and Development. Alan R. Liss, New York, pp 227–255
- Bolwell GP, Butt VS, Davies DR, Zimmerlin A. The origin of the oxidative burst in plants. Free Radical Research. 1995;23:517–532. doi: 10.3109/10715769509065273. [DOI] [PubMed] [Google Scholar]
- Bruce D, Samson G, Carpenter C. The origins of nonphotochemical quenching of chlorophyll fluorescence in photosynthesis: direct quenching by P680+ in PSII enriched membranes at low pH. Biochemistry. 1997;36:749–755. doi: 10.1021/bi962216c. [DOI] [PubMed] [Google Scholar]
- Chandra S, Heinstein PF, Low PS. Activation of phospholipase A by plant defense elicitors. Plant Physiol. 1996;110:979–986. doi: 10.1104/pp.110.3.979. [DOI] [PMC free article] [PubMed] [Google Scholar]
- Cho MH, Tan Z, Erneux C, Shears SB, Boss WF. The effects of mastoparan on the carrot cell plasma membrane polyphosphoinositide phospholipase C. Plant Physiol. 1995;107:845–856. doi: 10.1104/pp.107.3.845. [DOI] [PMC free article] [PubMed] [Google Scholar]
- Colman B, Mawson BT, Espie GS. The rapid isolation of photosynthetically active mesophyll cells from Asparagus cladophylls. Can J Bot. 1979;57:1505–1510. [Google Scholar]
- Doke N. Involvement of superoxide anion generation in the hypersensitive response of potato tuber tissues to infection with an incompatible race of Phytophthora infestans and to the hyphal wall components. Physiol Plant Pathol. 1983;23:345–357. [Google Scholar]
- Drøbak BK, Watkins PAC. Inositol(1,4,5)trisphosphate production in plant cells: stimulation by the venom peptides, melittin and mastoparan. Biochem Biophys Res Commun. 1994;205:739–745. doi: 10.1006/bbrc.1994.2727. [DOI] [PubMed] [Google Scholar]
- Ebel J, Cosio EG. Elicitors of plant defense responses. Intl Rev Cytol. 1994;148:1–36. [Google Scholar]
- Genoud T, Millar AJ, Nishizawa N, Kay SA, Schäfer E, Nagatani A, Chua N-H. An Arabidopsis mutant hypersensitive to red and far-red light signals. Plant Cell. 1998;10:889–904. doi: 10.1105/tpc.10.6.889. [DOI] [PMC free article] [PubMed] [Google Scholar]
- Genty B, Briantais J-M, Baker NR. The relationship between the quantum yield of photosynthetic electron transport and quenching of chlorophyll fluorescence. Biochim Biophys Acta. 1989;990:87–92. [Google Scholar]
- Granado J, Felix G, Boller T. Perception of fungal sterols in plants. Plant Physiol. 1995;107:485–490. doi: 10.1104/pp.107.2.485. [DOI] [PMC free article] [PubMed] [Google Scholar]
- Hammond-Kosack KE, Jones JDG. Resistance gene-dependent plant defense responses. Plant Cell. 1996;8:1773–1791. doi: 10.1105/tpc.8.10.1773. [DOI] [PMC free article] [PubMed] [Google Scholar]
- Higashijima T, Burnier J, Ross EM. Regulation of Gi and Go by mastoparan, related amphiphilic peptides, and hydrophobic amines. J Biol Chem. 1990;265:14176–14186. [PubMed] [Google Scholar]
- Higashijima T, Uzu S, Nakajima T, Ross EM. Mastoparan, a peptide toxin from wasp venom, mimics receptors by activating GTP-binding regulatory proteins (G-proteins) J Biol Chem. 1988;263:6491–6494. [PubMed] [Google Scholar]
- Higashijima T, Wakamatsu K, Takemitsu M, Fujino M, Nakajima T, Miyazawa T. Conformational change of mastoparan from wasp venom on binding with phospholipid membrane. FEBS Lett. 1983;152:227–230. doi: 10.1016/0014-5793(83)80385-8. [DOI] [PubMed] [Google Scholar]
- Huang CN, Cornejo MJ, Bush DS, Jones RL. Estimating viability of plant protoplasts using double and single staining. Protoplasma. 1986;135:80–87. [Google Scholar]
- Jabs T, Tschöpe M, Colling C, Hahlbrock K, Scheel D. Elicitor-stimulated ion fluxes and O2⋅− from the oxidative burst are essential components in triggering defense gene activation and phytoalexin synthesis in parsley. Proc Natl Acad Sci USA. 1997;94:4800–4805. doi: 10.1073/pnas.94.9.4800. [DOI] [PMC free article] [PubMed] [Google Scholar]
- Johal GS, Gray J, Gruis D, Briggs SP. Convergent insights into mechanisms determining disease and resistance response in plant-fungal interactions. Can J Bot Suppl. 1995;73:S468–S474. [Google Scholar]
- Jones DL, Kochian LV. Aluminum inhibition of the inositol 1,4,5-trisphosphate signal transduction pathway in wheat roots: a role in aluminum toxicity. Plant Cell. 1995;7:1913–1922. doi: 10.1105/tpc.7.11.1913. [DOI] [PMC free article] [PubMed] [Google Scholar]
- Kauss H, Jeblick W. Pretreatment of parsley suspension cultures with salicylic acid enhances spontaneous and elicited production of H2O2. Plant Physiol. 1995;108:1171–1178. doi: 10.1104/pp.108.3.1171. [DOI] [PMC free article] [PubMed] [Google Scholar]
- Kauss H, Jeblick W. Influence of salicylic acid on the induction of competence for H2O2 elicitation: comparison of ergosterol with other elicitors. Plant Physiol. 1996;111:755–763. doi: 10.1104/pp.111.3.755. [DOI] [PMC free article] [PubMed] [Google Scholar]
- Keppler LD, Novacky A. Involvement of membrane lipid peroxidation in the development of a bacterially induced hypersensitive reaction. Phytopathology. 1986;76:104–108. [Google Scholar]
- Kim HY, Coté GG, Crain RC. Inositol 1,4,5-trisphosphate may mediate closure of K+ channels by light and darkness in Samanea saman motor cells. Planta. 1996;198:279–287. doi: 10.1007/BF00206254. [DOI] [PubMed] [Google Scholar]
- Langford AN. Autogenous necrosis in tomatoes immune from Cladosporium fulvum Cooke. Can J Res Sect C Bot Sci. 1948;26:35–64. doi: 10.1139/cjr48c-006. [DOI] [PubMed] [Google Scholar]
- Legendre L, Heinstein PF, Low PS. Evidence for participation of GTP-binding proteins in elicitation of the rapid oxidative burst in cultured soybean cells. J Biol Chem. 1992;267:20140–20147. [PubMed] [Google Scholar]
- Legendre L, Rueter S, Heinstein PF, Low PS. Characterization of the oligogalacturonide-induced oxidative burst in cultured soybean (Glycine max) cells. Plant Physiol. 1993;102:233–240. doi: 10.1104/pp.102.1.233. [DOI] [PMC free article] [PubMed] [Google Scholar]
- Levine A, Tenhaken R, Dixon R, Lamb C. H2O2 from the oxidative burst orchestrates the plant hypersensitive disease resistance response. Cell. 1994;79:583–593. doi: 10.1016/0092-8674(94)90544-4. [DOI] [PubMed] [Google Scholar]
- McCutcheon SL, Bown AW. Evidence for a specific glutamate/H+ cotransport in isolated mesophyll cells. Plant Physiol. 1987;83:691–697. doi: 10.1104/pp.83.3.691. [DOI] [PMC free article] [PubMed] [Google Scholar]
- Mehdy M. Active oxygen species in plant defense against pathogens. Plant Physiol. 1994;105:467–472. doi: 10.1104/pp.105.2.467. [DOI] [PMC free article] [PubMed] [Google Scholar]
- Morré DJ, Brightman AO, Barr R, Davidson M, Crane FL. NADH oxidase activity of plasma membranes of soybean hypocotyls is activated by guanine nucleotides. Plant Physiol. 1993;102:595–602. doi: 10.1104/pp.102.2.595. [DOI] [PMC free article] [PubMed] [Google Scholar]
- Murphy TM, Auh C-K. The superoxide synthases of plasma membrane preparations from cultured rose cells. Plant Physiol. 1996;110:621–629. doi: 10.1104/pp.110.2.621. [DOI] [PMC free article] [PubMed] [Google Scholar]
- Neubauer C, Schreiber U. Photochemical and nonphotochemical quenching of chlorophyll fluorescence induced by hydrogen peroxide. Z Naturforsch. 1988;44c:262–270. [Google Scholar]
- Peever TL, Higgins VJ. Electrolyte leakage, lipoxygenase, and lipid peroxidation induced in tomato leaf tissue by specific and nonspecific elicitors from Cladosporium fulvum. Plant Physiol. 1989;90:867–875. doi: 10.1104/pp.90.3.867. [DOI] [PMC free article] [PubMed] [Google Scholar]
- Pugin A, Frachisse J-M, Tavernier E, Bligny R, Gout E, Douce R, Guern J. Early events induced by the elicitor cryptogein in tobacco cells: involvement of a plasma membrane NADPH oxidase and activation of glycolysis and the pentose phosphate pathway. Plant Cell. 1997;9:2077–2091. doi: 10.1105/tpc.9.11.2077. [DOI] [PMC free article] [PubMed] [Google Scholar]
- Ross EM, Higashijima T. Regulation of G-protein activation by mastoparans and other cationic peptides. Methods Enzymol. 1994;237:26–37. doi: 10.1016/s0076-6879(94)37050-8. [DOI] [PubMed] [Google Scholar]
- Schreiber U, Reising H, Neubauer C. Contrasting pH-optima of light-driven O2- and H2O2-reduction in spinach chloroplasts as measured via chlorophyll fluorescence quenching. Z Naturforsch. 1991;46c:635–643. [Google Scholar]
- Tucker EB, Boss WF. Mastoparan-induced intracellular Ca2+ fluxes may regulate cell-to-cell communication in plants. Plant Physiol. 1996;111:459–467. doi: 10.1104/pp.111.2.459. [DOI] [PMC free article] [PubMed] [Google Scholar]
- van Kooten O, Snel JFH. The use of chlorophyll fluorescence nomenclature in plant stress physiology. Photosynth Res. 1990;25:147–150. doi: 10.1007/BF00033156. [DOI] [PubMed] [Google Scholar]
- Vidaver W, Popovic R, Bruce D, Colbow K. Oxygen quenching of chlorophyll fluorescence in chloroplasts. Photochem Photobiol. 1981;34:633–636. [Google Scholar]
- Withers LA. Cryopreservation and storage of germplasm. In: Dixon RA, editor. Plant Cell Culture: A Practical Approach. Washington, DC: IRL Press; 1985. pp. 184–185. [Google Scholar]


