

Abstract
Traditional neuroimaging studies in Alzheimer’s disease (AD) typically employ independent and pairwise analyses between multimodal data, which treat imaging biomarkers, cognitive measures, and disease status as isolated units. To enhance mechanistic understanding of AD, in this paper, we conduct a new study for identifying imaging biomarkers that are associated with both cognitive measures and AD. To achieve this goal, we propose a new sparse joint classification and regression method. The imaging biomarkers identified by our method are AD-sensitive and cognition-relevant and can help reveal complex relationships among brain structure, cognition and disease status. Using the imaging and cognition data from Alzheimer’s Disease Neuroimaging Initiative database, the effectiveness of the proposed method is demonstrated by clearly improved performance on predicting both cognitive scores and disease status.
1 Introduction
Neuroimaging is a powerful tool for characterizing neurodegenerative process in the progression of Alzheimer’s disease (AD). Pattern classification methods have been widely employed to predict disease status using neuroimaging measures [2, 3]. Since AD is a neurodegenerative disorder characterized by progressive impairment of memory and other cognitive functions, regression models have been investigated to predict clinical scores from individual magnetic resonance imaging (MRI) and/or positron emission tomography (PET) scans [8, 9]. For example, in [9], stepwise regression was performed in a pairwise fashion to relate each of MRI and FDG-PET measures of eight candidate regions to each of four Rey’s Auditory Verbal Learning Test (RAVLT) memory scores.
Predicting disease status and predicting memory performance, using neuroimaging data, are both important learning tasks. Prior research typically studied these tasks separately. One example is to first determine disease-relevant cognitive scores and then identify imaging biomarkers associated with these scores so that interesting pathways from brain structure to cognition to symptom can potentially be discovered. However, a specific cognitive function could be related to multiple imaging measures associated with different biological pathways (some of them are not related to AD). As a result, the identified imaging biomarkers are not necessarily all disease specific. To have a better understanding of the underlying mechanism specific to AD, an interesting topic would be to only discover imaging biomarkers associated with both cognitive function and AD status.
To identify AD-sensitive and cognition-relevant imaging biomarkers, we propose a new joint classification and regression learning model to simultaneously performing two heterogeneous tasks, i.e., imaging-to-disease classification and imaging-to-cognition regression. We use magnetic resonance imaging (MRI) measures as predictors and cognitive memory scores and disease status as response variables. For each individual regression or classification task, we employ a multitask learning model [1] in which tasks for predicting different memory performances (or those for predicting AD and control dummy variables in classification) are considered as homogeneous tasks. Different to LASSO and other related methods that mainly find the imaging features correlated to each individual memory score, our method selects the imaging features that tend to play an important role on influencing multiple homogenous tasks.
Our new method utilizes the sparse regularization to perform imaging biomarker selection and learn a sparse parameter matrix under a unified framework that integrates both heterogeneous and homogenous tasks. Specifically, by recognizing that the formation [6] and maintenance [4] of memory are synergically accomplished by a few brain areas, such as medial temporal lobe structures, medial and lateral parietal, as well as prefrontal cortical areas, we use the ℓ2,1-norm regularization to select features that can predict most memory scores and classify AD versus control. Empirical comparison with the existing methods demonstrates that the proposed method not only yields improved performance on predicting both cognitive scores and disease status, but also discovers a small set of AD-sensitive and cognition-relevant biomarkers in accordance with prior findings.
2 Sparse Model for Joint Classification and Regression
When we study either regression or classification via a multi-task learning model, given a set of input variables, (i.e., features, such as imaging biomarkers), we are interested in learning a set of related models (e.g., associations between image biomarkers and cognitive scores) for predicting multiple homogenous tasks (such as predicting cognitive scores). Since these homogenous tasks are typically interrelated, they share a common input space. As a result, it is desirable to learn all the models jointly rather than treating each task as an independent one. Such multi-task learning methods can help discover robust patterns, especially when significant patterns in a single task become outliers for other tasks, and potentially increase the predictive power.
To identify AD-sensitive and cognition-relevant biomarkers from imaging data, we formulate a new problem to jointly learn two heterogeneous tasks: classification and regression. We propose a new sparse model for joint classification and regression to perform multivariate regression for cognitive memory scores predictions and logistic regression for disease classification tasks simultaneously.
Notation
We write matrices and vectors as bold uppercase and lowercase letters respectively. Given a matrix M = [mij], we denote its i-th row as mi and j-th column as mj. The Frobenius norm of the matrix M is denoted as ||M||F, and the ℓ2,1-norm [5] of M is defined as .
2.1 Objective of Sparse Joint Classification and Regression
First, logistic regression is used for disease classification. Given the training data X = [x1,…,xn] ε ℝd×n, each data point xi is associated with a label vector yi = [yi1,…,yic1] ε ℝc1. If xi belongs to the k-th class, yik = 1, otherwise yik = 0. We write Y = [(y1)T,…,(yn)T]T ε ℝn×c1. In traditional multi-class logistic regression, under a projection matrix W ε ℝd×c1, we have
where p (k | xi, W) is the probability that xi belongs to the k-th class, and p (yi | xi, W) is the probability that xi is associated with the given label yi. Therefore, the multi-class logistic loss that maximizes the Log-likelihood can be achieved by minimizing:
| (1) |
In AD classification, we have two classes, i.e., AD and health control (HC).
Second, we use multivariate least square regression to predict cognitive scores, which minimizes:
| (2) |
where X is the data matrix, Z = [(z1)T,…,(zn)T]T ε ℝn×c2 is the label matrix for the c2 regression tasks, and P ε ℝd×c2 is the projection matrix.
The objective for joint classification and regression to identify AD-sensitive and cognition-relevant imaging biomarkers can now be formulated as follows:
| (3) |
where V = [W P] ε ℝd×(c1+c2). Thanks to the ℓ2,1-norm regularization on V [1], the biomarkers are identified across all tasks so that they are not only correlated to cognitive scores but also discriminative to disease status.
2.2 An Efficient Iterative Algorithm
Due to the non-smoothness of the ℓ2,1-norm term, J in Eq. (3) is hard to solve in general. Thus we derive an efficient iterative algorithm as follows.
Taking the derivatives of J w.r.t. W and P, we set them to be zeros:
| (4) |
where D is a diagonal matrix whose k-th diagonal element is . Because D depends on V, it is also an unknown variable. Following standard optimization procedures in statistical learning, we alternately optimize V and D.
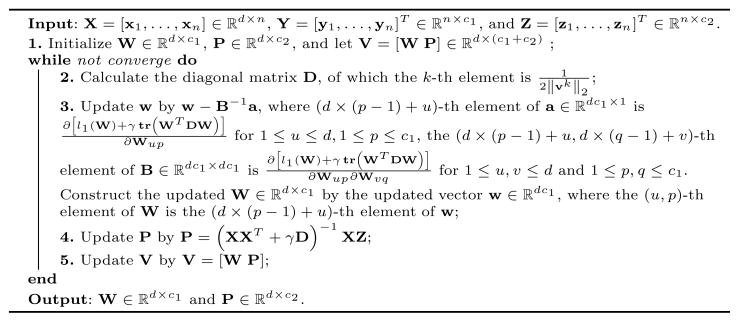
First, we randomly initialize V ε ℝd×(c1+c2), upon which we calculate D. After obtaining D, we update the solution V = [W P] using Eq. (4). To be more precise, P is updated by P = (XXT + γD)−1 XZ. Because we cannot update W with a closed form solution upon Eq. (4), we employ Newton’s method to obtain updated W by solving the following problem: minW l1 (W) + γ tr (WT DW).
Once we obtain the updated V = [W P], we can calculate D. This procedure repeats until convergence. The detailed algorithm is summarized in Algorithm 1, whose convergence is proved as following.
Algorithm 1.
An efficient algorithm to solve Eq. (3).
|
Lemma 1
For any vector v and v0, we have . Proof is available in [5].
Theorem 1
Algorithm 1 decreases the objective value of J in every iteration.
Proof
In each iteration, denote the updated W as W̃, the updated P as P̃, thus the updated V is Ṽ = [W̃ P̃]. According to step 3 of Algorithm 1, we have
| (5) |
According to step 4 we know that
| (6) |
According to the definition of D and Lemma 1, we have the following inequality:
| (7) |
Because tr (VT DV) = tr (WT DW) + tr (PT DP), by adding Eqs. (5–7) at the both sides, we arrive at
| (8) |
Thus, Algorithm 1 decreases the value of J in Eq. (3) in every iteration.
Because J in Eq. (3) is obviously lower-bounded by 0, Theorem 1 guarantees the convergence of Algorithm 1. In addition, because J is convex, Algorithm 1 converges at the global optimum of the problem.
3 Experimental Results
We evaluate our method by applying it to the Alzheimer’s Disease Neuroimaging Initiative (ADNI) cohort. The goal is to select a compact set of AD-sensitive and cognition-relevant imaging biomarkers while maintaining high predictive power.
Data preparation
We downloaded data from the ADNI database (http://adni.loni.ucla.edu). We used baseline MRI data, from which we extracted 56 volumetric and cortical thickness values (Fig. 1) using FreeSurfer (http://surfer.nmr.mgh.harvard.edu), as described in [7]. We included memory scores from three different cognitive assessments including Mini-Mental State Exam (MMSE), Rey’s Auditory Verbal Learning Test (RAVLT), and TRAILS. Details about these assessments are available in the ADNI procedure manuals (http://www.adni-info.org/Scientists/ProceduresManuals.aspx).
Fig. 1.

Weight maps of the joint classification and regression tasks. One binary classification task for AD and HC. Three different groups of cognitive scores for regression: (a) MMSE score, (b) RAVLT score, (c) TRAILS score. “−L” indicates the FreeSurfer biomarkers at the left side, and “−R” indicates those at the right side.
3.1 Biomarker Identification
The proposed method aims to identify imaging biomarkers that are associated with both disease status and cognitive scores in a joint classification and regression framework. Here we first examine the identified biomarkers. Fig. 1 shows a summarization of selected features for the three experiments (one for each type of cognitive scores) where the regression/classification weights are color-mapped for each feature and each task. Fig. 2 visualizes the cortical maps of selected features for both classification and regression in different tasks.
Fig. 2.

Cortical map of selected features for cognitive score prediction using FreeSurfer measures in the three joint classification and regression tasks.
Fig. 1 and Fig. 2 show that a small set of MRI measures are identified, including hippocampal volume (HippVol), entorhinal cortex thickness (EntCtx), amygdala volume (AmygVol), inferior parietal gyrus thickness (InfParietal), and middle temporal gyrus thickness (MidTemporal). These are all well-known AD-relevant biomarkers. Our method also shows that these markers are jointly associated with one or more memory scores. Although we know that MRI measures, cognitive scores and diagnosis are highly correlated, the complex relationships among them remain to be discovered for a better understanding of AD mechanism. This is one major focus of our work. As shown in Fig. 1, different AD-sensitive MRI measures could be related to different cognitive tasks. The proposed sparse method for joint classification and regression enables us to sort out MRI-cognition relationships while focusing on AD-sensitive markers.
3.2 Improved Prediction Performance
Now we evaluate the performance of joint classification and regression for AD detection and cognitive score prediction using MRI data. We performed standard 5-fold cross-validation, where the parameter γ of our method in Eq. (3) was fine tuned in the range of {10−5,…, 1,…, 105 }by an internal 5-fold cross-validation in the training data of each of the 5 trials. For classification, we compared the proposed method against two baseline methods including logistic regression and support vector machine (SVM). For SVM, we implemented three different kernels including linear, polynomial and Gaussian kernels. For polynomial kernel, we searched the best results when the polynomial order varied in the range of {1, 2,…, 10}; for Gaussian kernel, we fine tuned the parameter α in the same range as that for our method and fixed parameter C as 1. For regression, we compared our method against two widely used methods including multivariate regression and ridge regression. For the latter, we fine tuned its parameter in the same range as that for our method. The results are reported in Table 1.
Table 1.
Comparison of classification and regression performance.
| Our method | Classification accuracy | RMSE (mean ± std) | |||||||
|---|---|---|---|---|---|---|---|---|---|
| Memory score | # subjects | # AD | # HC | Classification accuracy | Regression RMSE | Logistic regression | SVM | Multivariate regression | Ridge regression |
| MMSE | 378 | 175 | 203 | 0.881 | 0.034 ±0.002 | 0.832 | 0.783 (linear kernel) | 0.041 ± 0.003 | 0.039 ± 0.004 |
| RAVLT | 371 | 172 | 199 | 0.884 | 0.019 ±0.001 | 0.839 (Polynomial kernel) | 0.028 ± 0.002 | 0.024 ± 0.003 | |
| TRAILS | 369 | 166 | 203 | 0.864 | 0.043 ±0.002 | 0.796 (Gausssian kernel) | 0.049 ± 0.003 | 0.046 ± 0.003 | |
Table 1 shows that our method performs clearly better than both logistic regression and SVM, which are consistent with our motivations in that our method classifies participants using the information from not only MRI measures but also the reinforcement by cognitive score regression. In addition, the cognitive score regression performances of our method measured by root mean squared error (RMSE) outperform both multivariate regression and ridge regression, supporting the usefulness of joint classification and regression from another perspective. Ridge regression achieves close but slightly worse regression performance. However, it lacks the ability to identify relevant imaging markers. All these observations demonstrate the effectiveness of the proposed method in improving the performances of both AD detection and cognitive score prediction.
Mild cognitive impairment (MCI) is thought to be the prodromal stage of AD. Including MCI in this type of analyses will be an interesting future direction to help biomarker discovery for early detection of AD. We performed an initial analyis on three-class classification for AD, MCI and HC: the accuracy of our method was 0.663 and the best of other tested methods was 0.615. Apparently this is a much harder task and warrants further thorough investigation.
4 Conclusions
We have proposed a new sparse model for joint classification and regression and applied it to the ADNI cohort for identifying AD-sensitive and cognition-relevant imaging biomarkers. Our methodological contributions are threefold: 1) proposing a new learning model, joint classification and regression learning, to identify disease-sensitive and task-relevant biomarkers for analyzing multimodal data; 2) employing structural sparsity regularization to integrate heterogenous and homogenous tasks in a unified multi-task learning framework; 3) deriving a new efficient optimization algorithm to solve our non-smooth objective function, and coupling this with rigorous theoretical analysis on global optimum convergency. Empirical comparison with the existing methods demonstrates that our method not only yields improved performance on predicting both cognitive scores and disease status using MRI data, but also discovers a small set of AD-sensitive and cognition-relevant imaging biomarkers in accordance with prior findings.
Contributor Information
Hua Wang, Email: huawangcs@gmail.com.
Feiping Nie, Email: feipingnie@gmail.com.
Heng Huang, Email: heng@uta.edu.
Shannon Risacher, Email: srisache@iupui.edu.
Andrew J Saykin, Email: asaykin@iupui.edu.
Li Shen, Email: shenli@iupui.edu.
References
- 1.Argyriou A, Evgeniou T, Pontil M. Multi-task feature learning. NIPS 2007. 2007:41–48. [Google Scholar]
- 2.Fan Y, Batmanghelich N, Clark CM, Davatzikos C. Spatial patterns of brain atrophy in MCI patients, identified via high-dimensional pattern classification, predict subsequent cognitive decline. Neuroimage. 2008;39(4):1731–43. doi: 10.1016/j.neuroimage.2007.10.031. [DOI] [PMC free article] [PubMed] [Google Scholar]
- 3.Hinrichs C, Singh V, Mukherjee L, Xu G, Chung M, Johnson S. Spatially augmented LPboosting for AD classification with evaluations on the ADNI dataset. Neuroimage. 2009;48(1):138–49. doi: 10.1016/j.neuroimage.2009.05.056. [DOI] [PMC free article] [PubMed] [Google Scholar]
- 4.Moscovitch M, Nadel L, Winocur G, Gilboa A, Rosenbaum R. The cognitive neuroscience of remote episodic, semantic and spatial memory. Curr Opin Neurobiol. 2006;16(2):179–190. doi: 10.1016/j.conb.2006.03.013. [DOI] [PubMed] [Google Scholar]
- 5.Nie F, Huang H, Cai X, Ding C. Efficient and robust feature selection via joint l2,1-norms minimization. NIPS 2010. 2010:1813–1821. [Google Scholar]
- 6.Scoville W, Milner B. Loss of recent memory after bilateral hippocampal lesions. Journal of Neurology, Neurosurgery & Psychiatry. 1957;20(1):11. doi: 10.1136/jnnp.20.1.11. [DOI] [PMC free article] [PubMed] [Google Scholar]
- 7.Shen L, Kim S, Risacher SL, Nho K, Swaminathan S, West JD, Foroud T, Pankratz N, Moore JH, Sloan CD, Huentelman MJ, Craig DW, Dechairo BM, Potkin SG, Jack CR, Weiner MW, Saykin AJ. ADNI: Whole genome association study of brain-wide imaging phenotypes for identifying quantitative trait loci in MCI and AD: A study of the ADNI cohort. Neuroimage. 2010;53(3):1051 –1063. doi: 10.1016/j.neuroimage.2010.01.042. [DOI] [PMC free article] [PubMed] [Google Scholar]
- 8.Stonnington CM, Chu C, Kloppel S, Jack CRJ, Ashburner J, Frackowiak RS. Predicting clinical scores from magnetic resonance scans in alzheimer’s disease. Neuroimage. 2010;51(4):1405–13. doi: 10.1016/j.neuroimage.2010.03.051. [DOI] [PMC free article] [PubMed] [Google Scholar]
- 9.Walhovd K, Fjell A, Dale A, McEvoy L, Brewer J, Karow D, Salmon D, Fennema-Notestine C. Multi-modal imaging predicts memory performance in normal aging and cognitive decline. Neurobiol Aging. 2010;31(7):1107–1121. doi: 10.1016/j.neurobiolaging.2008.08.013. [DOI] [PMC free article] [PubMed] [Google Scholar]