Abstract
Ruthenium(II) complexes having pterins of redox-active heteroaromatic coenzymes as ligands were demonstrated to perform multistep proton transfer (PT), electron transfer (ET), and proton-coupled electron transfer (PCET) processes. Thermodynamic parameters including pKa, bond dissociation energy (BDE) of multistep PCET processes in acetonitrile (MeCN) were determined for ruthenium-pterin complexes, [RuII(Hdmp)(TPA)](ClO4)2 (1), [RuII(Hdmdmp)(TPA)](ClO4)2 (2), [RuII(dmp−)(TPA)]ClO4 (3) and [RuII(dmdmp−)(TPA)]ClO4 (4) (Hdmp = 6,7-dimethylpterin, Hdmdmp = N,N-dimethyl-6,7-dimethylpterin, TPA = tris(2-pyridylmethyl)amine), all of which had been isolated and characterized before. The BDE difference between 1 and one-electron oxidized species, [RuIII(dmp−)(TPA)]2+, was determined to be 89 kcal mol−1, which was large enough to achieve hydrogen atom transfer (HAT) from phenol derivatives. In the HAT reactions from phenol derivatives to [RuIII(dmp−)(TPA)]2+, the second-order rate constants (k) were determined to exhibit a linear relationship with BDE values of phenol derivatives with a slope (−0.4), suggesting that this HAT is simultaneous proton and electron transfer. As for HAT reaction from 2,4,6-tri-tert-buthylphenol (TBP; BDE = 79.15 kcal mol−1) to [RuIII(dmp−)(TPA)]2+, the activation parameters were determined to be ΔH‡ = 1.6 ± 0.2 kcal mol−1 and ΔS‡ = −36 ± 2 cal K−1 mol−1. This small activation enthalpy suggests a hydrogen-bonded adduct formation prior to HAT. Actually, in the reaction of 4-nitrophenol with [RuIII(dmp−)(TPA)]2+, the second-order rate constants exhibited saturation behavior at higher concentrations of the substrate and low-temperature ESI-MS allowed us to detect the hydrogen-bonding adduct. This also lends credence to an associative mechanism of the HAT involving intermolecular hydrogen bonding between the deprotonated dmp ligand and the phenolic O-H to facilitate the reaction. In particular, a two-point hydrogen bonding between the complex and the substrate involving the 2-amino group of the deprotonated pterin ligand effectively facilitates the HAT reaction from the substrate to the Ru(III)-pterin complex.
Introduction
Proton-coupled electron transfer (PCET) is one of the most fundamental reactions and play important roles in energy conversion in biological system, including water oxidation at oxygen evolving center in photosynthesis1 and four-electron reduction of dioxygen by cytochrome c oxidase in respiration.2 In the course of PCET, the redox reaction occurs in a synchronized manner with protonation or deprotonation to regulate the redox potential of the redox-active entity for accepting and releasing electron(s). PCET reactions involve the transfer of one electron and one proton from the same chemical bond. With regard to PCET involving transition-metal complexes, a number of systems have been examined and the mechanistic details have been explored.3–6 In particular, metal-mediated hydrogen atom transfer (HAT) has attracted much attention due to the relevance to many chemical conversions of organic molecules in biological systems, including reactions catalyzed by soybean lipoxygenase.7 PCET reactions can proceed in four different patterns; 1) H• transfer, 2) proton transfer (PT) followed by electron transfer (ET), 3) ET followed by PT, 4) simultaneous ET and PT in a concerted manner. The reactions categorized in 1) and 4) could be categorized as HAT. For the PCET reactions, mechanistic insights can be provided through the thermodynamic approach using thermochemical cycle involving redox potentials and pKa values of a reagent8 and the kinetic study on the reaction. For example, rate constants of hydrogen atom abstraction reactions between FeII-tris(biimidazoline) complexes and substrates are well analyzed in light of the Marcus cross relation.9,10,11
PCET is the key step for functions of heteroaromatic coenzymes involved in a variety of biological redox processes, as represented by NADH (dihydronicotinamide adenine dinucleotide),2,12 flavins,13,14 and pterins.15,16 Those heteroaromatics including nitrogen atom(s) as proton-accepting site(s) undergo dearomatization in the course of reduction with protonation to recover their aromaticity during the oxidation with deprotonation. Among those, pterins can undergo multiple PCET from the fully oxidized biopterins to fully reduced tetrahydropterins by accepting and releasing up to four electrons and four protons.17
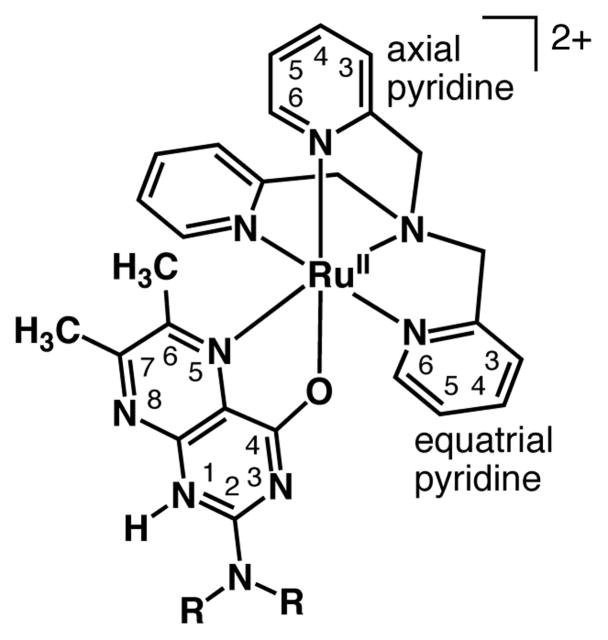
Pterins locate in the vicinity of metal ions to conduct many biologically important redox reactions including dioxygen activation in collaboration with metal ions by manipulating PCET.18 So far, metal complexes of pterins have gathered much attention as functional and structural models and also as complexes having redox-non-innocent ligands.17a, 19 Among those, ruthenium complexes of pterins have been reported to exhibit PCET with clear reversibility for both the metal center and the pterin ligands.20 We have reported on synthesis and characterization of the ruthenium-pterin complexes as shown in Chart 1, [RuII(Hdmp)(TPA)](ClO4)2 (1),21 [RuII(Hdmdmp)(TPA)](ClO4)2 (2),21 [RuII(dmp−)(TPA)]ClO4 (3),22 and [RuII(dmdmp−)(TPA)]ClO4 (4),22,23 in light of their structures and redox properties including PCET. No report has appeared, however, to demonstrate any reactivity of transition metal complexes of pterins toward external entities, including PCET reactions with substrates.
Chart 1.
Schematic Description of Structures of 1 (R = H) and 2 (R = CH3), and Atom Numbering Scheme. The pterin ligands in 3 (R = H) and 4 (R = CH3) are deprotonated from the N-1 position.
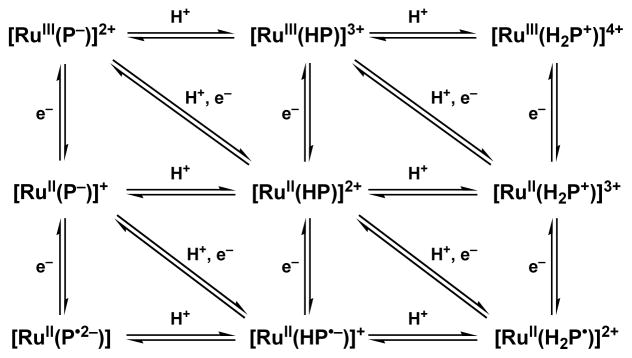
We report herein the thermochemical study of the PCET system of those Ru-pterin complexes, as presented in Scheme 1, on the basis of determination of pKa values and redox potentials in acetonitrile. We also report detailed kinetic analysis including the kinetic isotope effects on HAT reactions from phenol derivatives to Ru(III)-pterin complexes, which reveals formation of a hydrogen-bonded adduct prior to the HAT reactions. Thus, the present study provides valuable mechanistic insights into HAT reactions of transition metal complexes of pterins for the first time.
Scheme 1.
Multistep Proton-Coupled Electron Transfer Process of Ruthenium Complexes with Redox-Non-Innocent Pterin Ligand (HP = Pterin)
Experimental Section
General
All chemicals available were purchased from appropriate commercial sources. MeCN was purified by distillation over CaH2. For some of experiments, the MeCN used was Burdick and Jackson low water brand, which was stored in an argon-pressurized steel drum plumbed directly into a glovebox. Phenols were further purified by the standard methods.24 2,4,6-Tri-tert-buthylphenol-d,25 [Ru(Hdmp)(TPA)](ClO4)2 (1),21 [Ru(Hdmdmp)(TPA)](ClO4)2 (2),21 [Ru(dmp−)(TPA)]ClO4 (3),22 and [Ru(dmdmp−)(TPA)]ClO4 (4),22,23 were prepared according to literature methods. NMR measurements were performed on JEOL AL-300 and Bruker AV-300 spectrometers. UV-vis absorption spectra were recorded on Jasco V-570 and Hewlett-Packard HP8453 diode array spectrophotometers at room temperature unless otherwise noted. ESI-MS spectra were measured on a Perkin-Elmer API-150 spectrometer.
Safety Note
Perchlorate salts of metal complexes with organic ligands are potentially explosive. They should be handled with great care in small quantities.
Synthesis of 2,4,6-tri-tert-buthylphenol-d.25
Under N2, NaH (0.03 g) was added into 2,4,6-tri-tert-buthylphenol (0.39 g) in DMSO-d6 (9 ml), and the solution was stirred for overnight. D2O (15 ml) was added, then precipitate formed was collected by filtration. The white solid was washed with D2O.
Spectroscopic Titrations in MeCN
UV-vis titrations were performed by using 2,6-dichlorobenzoic acid (Hdcba; pKa = 17.6)26 for the first protonation step and HClO4 (pKa = 2.1)27 for the second protonation step as acids. Hdcba in MeCN was added to an MeCN solution (3.0 mL) of 1 (0.1 mM) in a quartz cuvette, and UV-vis spectra were taken after each addition. The obtained spectra were analyzed using the absorbance at 430 nm, yielding [1]/[3] = (A1 − A)/(A − A3), where A1 and A3 are the absorbance for 1 and 3 at 430 nm: [1] = [dcba−] = {[Ru]total (A1 − A)/(A − A3)}/{1 + ((A1 − A)/(A − A3)). A slope of the linear fit to a plot of [3][dcba−]/[1] vs [Hdcba] gave an acid-base equilibrium constant, Keq = 0.15. The pKa1 value of 1 was determined from pKa1(1) = pKa(Hdcba) + logKeq = 16.7 using the pKa value of 17.6 for Hdcba. The pKa2 value for 1 and also the pKa1 and pKa2 values for 2 were determined by the similar procedure.
Electrochemical Measurements
Cyclic voltammetry was performed in MeCN in the presence of 0.1 M [(n-butyl)4N]PF6 (TBAPF6) as an electrolyte under N2 at room temperature, with use of a glassy carbon electrode as a working electrode, Ag/AgNO3 as a reference electrode, and Pt wire as an auxiliary electrode. All potentials were calibrated with respect to the ferrocene/ferricenium redox couple as 0 V.
Controlled-potential electrolysis was carried out in a three-electrode cell by using a BAS CV-27 voltammetry controller, modified for ESR and electronic absorption measurements. The working electrode was a Pt net of 0.3 mmφ (1 × 1 cm2). The auxiliary and reference electrodes were the same as adopted in CV measurements. The reference electrode was separated from the solution by a salt bridge of a saturated TBAPF6 solution in MeCN. All potentials were measured relative to Ag/Ag+ and then corrected to be referenced to the ferrocene/ferricenium (Fc/Fc+) couple as 0 V as an internal standard.
Spectroelectrochemical Experiments
UV-vis spectroelectrochemical experiments were performed with a thin-layer spectroelectrochemical quartz cell (path-length of 0.5 mm) using a three-electrode arrangement: light transparent platinum gauze (100 mesh, 0.07 mm diameter) as a working electrode, a platinum wire counter electrode, and an Ag/AgNO3 (0.01 M) reference electrode. Potentials were applied with a HOKUTO DENKO HSV-100 electrochemical analyzer. The electrochemical reaction was monitored with a Shimadzu UV-3100 spectrophotometer at room temperature.
Kinetic Measurements
Kinetic measurements were performed by a UNISOKU RSP-601 stopped-flow spectrophotometer equipped with a MOS type highly sensitive photodiode array using a double-mixing mode except for the reaction with 4-nitrophenol. Ru(II)-pterin complexes (3 and 4; 2.5 × 10⁻⁵ M) was first mixed with [FeIII(bpy)3](PF6)3 (2.5 × 10⁻⁵ M) to generate Ru(III)-pterin complexes ([RuIII(dmp−)(TPA)]2+ and [RuIII(dmdmp−)(TPA)]2+). After an aging time of 1.0 s, the solution was further mixed with phenols (5.0 × 10⁻⁴ − 2.0 × 10⁻¹ M). The spectral changes were monitored by the rise in the absorption band at 500 nm due to formation of Ru(II)-Hpterin complexes (1 and 2) in MeCN. The kinetic measurements were carried out under pseudo-first-order conditions where the concentrations of phenols were maintained at more than 10-fold excess of concentrations of [RuIII(dmp−)(TPA)]2+ at 298 K. Pseudo-first-order rate constants were determined by least-squares curve fits. Reactions between Ru(III)-pterin complexes and 4-nitrophenol were performed by adding an MeCN solution (1.5 ml) of 4-nitrophenol (2.1 × 10⁻⁴ – 3.6 × 10⁻¹ M) into an MeCN solution (1.5 mL) of Ru(II)-pterin complexes (3 and 4; 5.0 × 10⁻⁵ M) and [FeIII(bpy)3](PF6)3 (5.0 × 10⁻⁵ M). The change in the absorption at 420 nm was measured with use of diode array spectrophotometers and analyzed by using biexponential curve fitting, because the decomposition of Ru(III)-pterin complexes (ca. 1.0 × 10⁻² s−1 for [RuIII(dmp−)(TPA)]2+ and ca. 1.0 × 10⁻³ s−1 for [RuIII(dmdmp−)(TPA)]2+) affect the rate constants of the HAT reactions in this time scale.
ESR Spectroscopy
ESR spectra in MeCN were recorded on a JEOL JEX-REIXE spectrometer at room temperature for radical species and g values were calibrated using an Mn2+ marker.
Results and Discussion
Spectroscopic Characterization of 1 and 2
The 1H NMR spectrum of 1 in CD3CN exhibited a σh-symmetric pattern for the TPA proton signals. Compared to that of 3, all the resonances showed downfield shifts (ca. +0.1 ppm) except that assigned to the H6 of the axial pyridine of the TPA ligand (−0.02 ppm). A broad singlet of the 2-amino N-H protons exhibited a large downfield shift from 5.10 ppm for 3 to 6.38 ppm for 1. This is indicative of the protonation at the N1 position, which is next to the C-2 position connected to the amino group (see Chart 1). The N-H proton at N1 was not observed at room temperature because of fast exchange with proton of water molecule in CD3CN. At 233 K, however, a broad signal assigned to the proton at N1 was observed at 10.7 ppm. In the 1H NMR spectrum of 2, similar downfield shifts were observed for all the signals except that assigned to the H6 of the axial pyridine of the TPA ligand (−0.03 ppm). The signal of N,N-dimethylamino group protons exhibited a upfield shift (−0.11 ppm) compared to that of 4. A broad signal assigned to the N-H proton at N1 was also observed at 10.0 ppm at 233 K for 2.
pKa Determination in MeCN
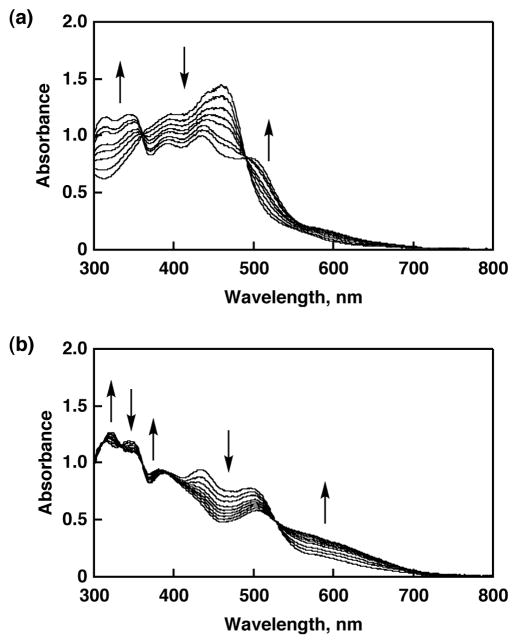
The reversible two-step protonation/deprotonation behavior was observed in absorption spectra of 3 and 4 in aqueous buffer solutions and in MeCN by adding HClO4 or base as reported previously.22,23 The spectroscopic titrations were carried out to determine pKa of 3 and 4 in MeCN by using Hdcba (pKa = 17.6) for the first protonation steps. The absorption spectrum of 3 changed into that of 1 by addition of excess amount of Hdcba as shown in Figure 1a. The first protonation led to the increase of absorbance at 311, 344, and 498 nm and the decrease of that at 383 and 461 nm with two isosbestic points at 368 and 486 nm. The pKa1 value of 3 was determined to be 16.7 by following absorption at 430 nm (see Supporting Information, Figure S1(a)). The spectroscopic titration for the second protonation steps was performed by adding HClO4 in MeCN at 25 °C. The protonation of 1 allowed us to observe another absorption spectral change showing an increase in absorbance at 319, 378, and 555 nm concomitant with its decrease at 344, 437, and 498 nm, keeping five isosbestic points at 310, 332, 360, 391, and 527 nm as depicted in Figure 1b. The pKa2 value was determined to be 1.8 by following the change in absorbance at 600 nm (see Supporting Information, Figure S1(b)). Ru-dmdmp complexes also exhibited the similar spectral change for the protonation and the pKa values are determined: pKa1 = 15.7 and pKa2 = 2.0 (see Figure S2). The pKa values determined in MeCN are much higher than those in an aqueous solution, however, the order of the pKa1 and pKa2 values in MeCN is consistent with those in an aqueous solution.
Figure 1.
Absorption spectral changes in the course of spectroscopic titration of 3 in MeCN at 298 K: (a) the first step with Hdbca; (b) the second step with HClO4.
Redox Potentials in MeCN
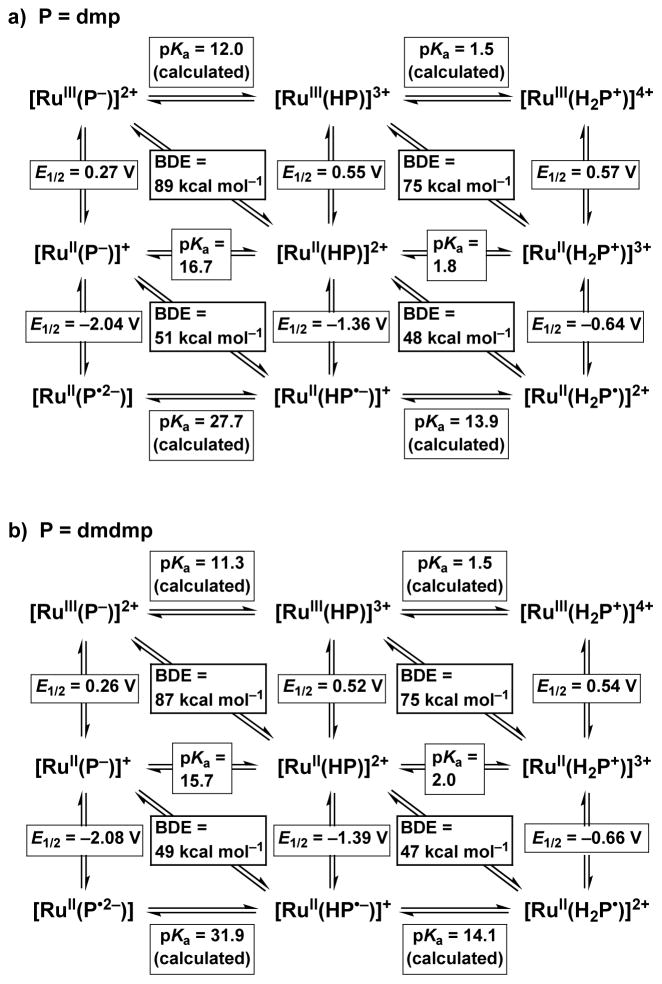
Redox potentials of 1, 2, 3, and 4 had been measured previously.21 –23 Reversible one-electron redox couples assigned to Ru(II)/Ru(III) were observed at 0.55 V (vs Fc/Fc+, ΔE = 60 mV) for 1 and 0.52 V (ΔE = 64 mV) for 2. Those values are 0.28 and 0.26 V higher than those observed for 3 (0.27 V) and 4 (0.26 V), respectively, however, only 0.2 V lower than those of corresponding doubly protonated species (see Scheme 2 below).22a In contrast to the reversible redox behavior of deprotonated and monoanionic pterin ligands in 3 and 4 and that of corresponding doubly protonated and monocationic species, monoprotonated and neutral pterin ligands in 1 and 2 exhibited irreversible redox behavior due to “proton shift” upon one-electron reduction.21 Thus, we applied DPV (differential pulse voltammetry) method under the same conditions to determine the one-electron reduction potentials for the neutral pterin ligands in 1 and 2: −1.36 for 1 and −1.39 V for 2. Those potentials are ca. 0.7 V higher than those of the dmp− and dmdmp− ligands in 3 and 4, respectively.
Scheme 2.
Thermochemical Parameters for Multi-Step Proton-Coupled Electron Transfer of (a) Dmp Complexes and (b) Dmdmp Complexes in MeCN, with E1/2 values referenced to Fc/Fc+
Thermochemical Square Schemes for 1 and 2
Based on the pKa values and the redox potentials (E1/2) of 1 and 2, bond dissociation enthalpies (BDEs) were calculated based on the following equation:28
| (1) |
where R is the gas constant, F is the Faraday constant, and C is a constant in a certain solvent. In the case of MeCN, the C value has been estimated to be 59.5 kcal mol−1.28a, 29 As for the Ru complexes, we adopted BDE rather than BDFE (bond dissociation free energy) because of small contribution of the entropy term.30 Thus, we considered the energetics of HAT reactions described in this paper in terms of BDE values of phenols. Four BDE values for the formal HAT reactions of the Ru-dmp complexes were calculated. The BDE for the reaction of 1 to [RuIII(dmp−)(TPA)]2+ was calculated to be 89 kcal mol−1, 51 kcal mol−1 for that of [RuII(Hdmp•−)(TPA)]2+ to 3, 75 kcal mol−1 for that of [RuII(H2dmp+)(TPA)]2+ to [RuIII(Hdmp+)(TPA)]3+, and 48 kcal mol−1 for that of [RuII(H2dmp+)(TPA)]2+ to 1 in MeCN at 298 K. Similarly, the BDE values for Ru-dmdmp complexes were calculated to be 87 kcal mol−1 for the formal HAT reaction of 3 to [RuIII(dmdmp−)(TPA)]2+, 49 kcal mol−1 for that of [RuII(Hdmdmp•−)(TPA)]2+ to 4, 75 kcal mol−1 for that of [RuII(H2dmdmp+)(TPA)]2+ to [RuIII(Hdmdmp+)(TPA)]3+, and 47 kcal mol−1 for that of [RuII(H2dmdmp+)(TPA)]2+ to 3 at 298 K.
The thermochemical cycle enables us to calculate the pKa values of the two-step protonation/deprotonation processes for Ru(III)-pterin complexes and Ru(II)-pterin radical complexes. All thermodynamic parameters for multiple PCET processes of Ru-pterin complexes are determined as shown in Scheme 2. The thermodynamic parameters of the two complexes differ only slightly. The importance of these thermochemical square schemes is that the introduction of a redox-active ligand with proton accepting site(s) to a redox-active metal complex allows us to achieve extended multistep PCET processes showing different BDEs.
On the basis of the thermochemical square schemes as described in Scheme 2, we can expect that [RuIII(pterin−)(TPA)]2+ (pterin− = dmp− and dmdmp−) can perform hydrogen atom transfer from substrates having a bond with a BDE lower than those to form 1 and 2, respectively.
Formation of [RuIII(dmp−)(TPA)]2+
As described in Scheme 2, among four steps of PCET processes of Ru-pterin complexes, the most reactive species toward HAT reactions should be [RuIII(dmp−)(TPA)]2+ having BDE = 89 kcal mol−1 and [RuIII(dmdmp−)(TPA)]2+ having BDE = 87 kcal mol−1. Thus, we examined HAT from phenol derivatives to [RuIII(dmp−)(TPA)]2+ and [RuIII(dmdmp−)(TPA)]2+ in MeCN to shed some lights on their reactivity and to gain mechanistic insights.
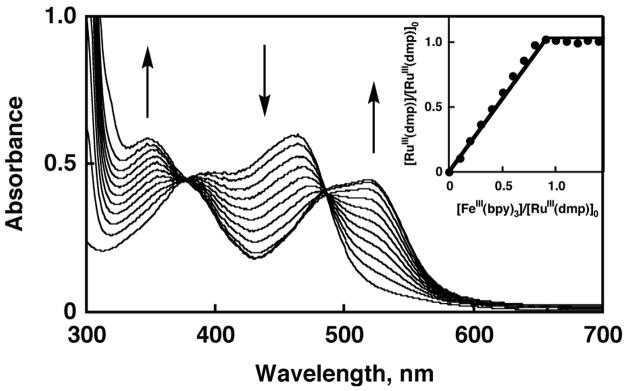
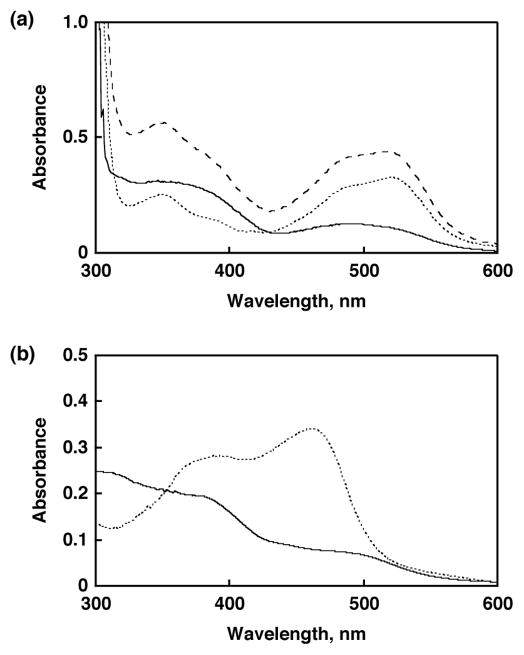
The formation of [RuIII(dmp−)(TPA)]2+ and [RuIII(dmdmp−)(TPA)]2+ was successfully achieved by one-electron oxidation of 3 and 4 with [FeIII(bpy3)](PF6)3 (E0red = 0.70 V vs Fc/Fc+ in MeCN).31,32 The absorption spectral change of 3 in the course of the one-electron oxidation is shown in Figure 2. The increase of absorbance at 520 nm is due to the formation of [FeII(bpy)3]2+. The formation of [RuIII(dmp−)(TPA)]2+ was confirmed by comparison of a difference spectrum obtained by subtracting the spectrum of [FeII(bpy)3]2+ from the spectrum shown in Figure 3a with its absorption spectrum observed in the bulk electrolysis of 3 in MeCN at 293 K with a controlled potential of 0.5 V as depicted in Figure 3(b). The solid lines both in Figure 3a and 3b are identical to exhibit absorption maxima at 385 and 497 nm, confirming that the chemical oxidation affords [RuIII(dmp−)(TPA)]2+. The titration curve based on the spectral change exhibited the linear saturation behavior at the addition of 1 eq of the oxidant as shown in the inset of Figure 2. In addition, those oxidized species were characterized by ESR spectroscopy as described previously.22a
Figure 2.
UV-Vis spectral change of 1 upon addition of [FeIII(bpy)3](PF6)3. Each spectrum was monitored upon adding 0.1 eq of the oxidant. Inset: Plot of the ratio of the [RuIII(dmp−)(TPA)]2+ concentration to the initial concentration of 3 ([3]0 = 2.6 × 10⁻⁵ M), [RuIII(dmp−)]/[3]0, relative to the ratio of the [FeIII(bpy)3](PF6)3 concentration to the initial concentration of 3, [FeIII(bpy)3]/[3]0.
Figure 3.
(a) Difference spectrum of [RuIII(dmp−)(TPA)]2+ (solid line) obtained by subtraction of the spectrum of [FeII(bpy)3]2+ (dotted line) from the final spectrum (dashed line) shown in Figure 2. (b) Absorption spectrum of [RuIII(dmp−)(TPA)]2+ generated by bulk electrolysis with a controlled potential of 0.5 V (solid line) and absorption spectrum of 3 (dotted line) in MeCN at 293 K.
Hydrogen Atom Transfer from Phenol Derivatives to [RuIII(dmp−)(TPA)]2+
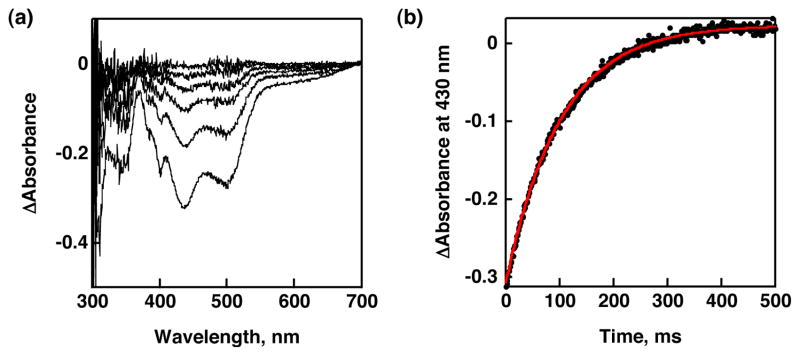
First, we used 2,4,6-tri-tert-butylphenol (TBP) having the bond dissociation enthalpy (BDE) of 79.15 kcal mol−1 for the O-H bond34 as a substrate. The HAT reaction from TBP to [RuIII(dmp−)(TPA)]2+ should be downhill by ca. 10 kcal mol−1. The reaction was revealed to give 1 and the corresponding phenoxyl radical (TBP•) as described in Scheme 3. Stopped-flow measurements for the reaction of [RuIII(dmp−)(TPA)]2+ with various concentrations of TBP in MeCN were performed to determine second-order rate constants (k). In the course of the reaction, the absorption derived from 1 increased (λmax = 436, 498 nm; Figure 4(a)). In addition, TBP• was detected in the ESR measurement under the same conditions as stopped-flow measurements (Figure S3) and the double integral of the ESR signal indicates that TBP was converted to TBP• quantitatively. The absorption spectral change obeyed pseudo-first-order kinetics in the presence of excess amount of substrate as shown in Figure 4(b). Plot of the pseudo-first-order rate constants (kobs) vs concentrations of TBP was linear and the k value at 293 K was determined to be (1.6 ± 0.2) × 104 M−1 s−1 from the slope of the linear correlation. In the same manner, we determined the second-order rate constants for reactions of [RuIII(dmp−)(TPA)]2+ with various phenol derivatives in MeCN at 293 K as listed in Table 1. All these phenols were reacted with [RuIII(dmp−)(TPA)]2+ and [RuIII(dmdmp−)(TPA)]2+ to give 1 and 2, respectively. The formation of 1 and 2 was quantitative, however, the oxidized products derived from phenols could not be identified by GC-MS and NMR analysis, except for TBP and 4-nitrophenol.35
Scheme 3.
Reaction of [RuIII(dmp−)(TPA)]2+ with Tri-t-butyl Phenol
Figure 4.
(a) Absorption spectral change in the course of the reaction of [RuIII(dmp−)(TPA)]2+ with TBP monitored by stopped-flow in MeCN at 293 K. [RuIII(dmp−)(TPA)]2+ = 2.5 × 10⁻⁵ M; [TBP] = 5.9 × 10⁻⁴ M (b) The change of absorbance at 430 nm (circle) and the pseudo-first-order fit (red line).
Table 1.
pKa, Oxidation potential, BDE Values of Phenols and Second-Order Rate Constants of Hydrogen Abstraction Reactions by [RuIII(dmp−)(TPA)]2+ in MeCN at 293 K
| Substrate | E0ox, Va (vs Fc/Fc+) | pKab | BDE, c kcal mol−1 |
k, M−1 s−1 |
|
|---|---|---|---|---|---|
| dmp | dmdmp | ||||
| 2,4,6-tri-tert-butylphenol | 1.02 | 27.3 | 79.15 | (1.6 ± 0.2) × 104 | (7.3 ± 0.2) × 102 |
| 4-phenylphenol | 1.14 | 26.6 | 80.52 | (8.4 ± 0.3) × 103 | (5.1 ± 0.2) × 102 |
| 4-tert-butylphenol | 1.28 | 27.5 | 84.55 | (1.9 ± 0.1) × 103 | (9.4 ± 0.2) × 10 |
| 4-chlorophenol | 1.32 | 22.8 | 85.65 | (3.7 ± 0.4) × 102 | (2.9 ±0 0.2) × 10 |
| 4-cyanophenol | 1.81 | 22.8 | 89.25 | (2.6 ± 0.2) × 10 | (9.9 ± 0.2) × 10−1 |
| 4-nitrophenol | 1.86 | 20.7 | 91.65 | 1.6 ± 0.2d | (2.7 ± 0.2) × 10−1 |
Determined by SHACV in MeCN.
Jover, J.; Bosque, R.; Sales, J. QSAR Comb. Sci. 2007, 26, 385–397.
Ref 32.
The second-order rate constant was determined in lower-concentration region.
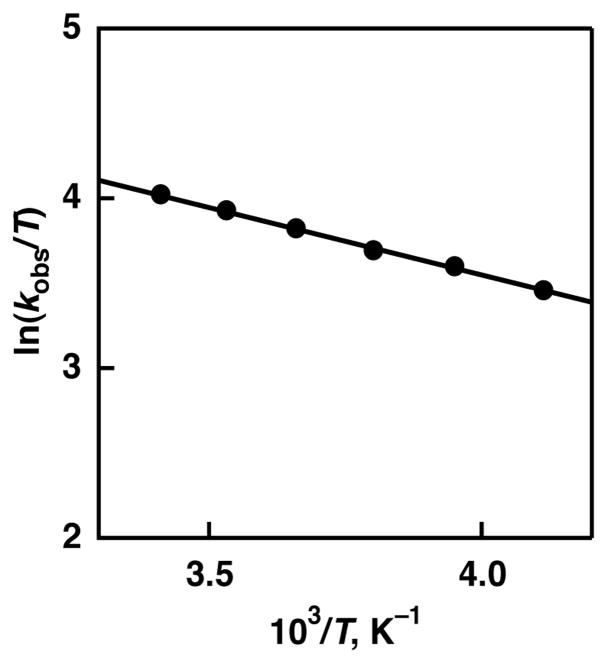
An Eyring plot was obtained from the temperature dependence of the second-order rate constants as shown in Figure 5. Based on the Eyring plot, the activation parameters were determined to be ΔH‡ = 1.6 ± 0.2 kcal mol−1 and ΔS‡ = −36 ± 2 cal K−1 mol−1. These activation parameters suggest that a fairly stabilized and organized transition state for the HAT reaction from TBP to [RuIII(dmp−)(TPA)]2+. Recently, a negative activation enthalpy of the hydrogen-abstraction reaction was reported in the reaction between [FeII(H2bip)3]2+ (H2bip = 2,2′-bi(tetrahydropyrimidine)) and large excess TEMPO, and formation of a hydrogen-bonded adduct was suggested as an intermediate in a pre-equilibrium step,36 as has been observed in organic HAT reactions.37 The relatively small ΔH‡ of the HAT reactioin36 from TBP to [RuIII(dmp−)(TPA)]2+ could be attributed to the offset with the activation enthalpy of the formation of hydrogen-bonded intermediate.
Figure 5.
Eyring plot for the HAT reaction from TBP to [RuIII(dmp−)(TPA)]2+ in MeCN.
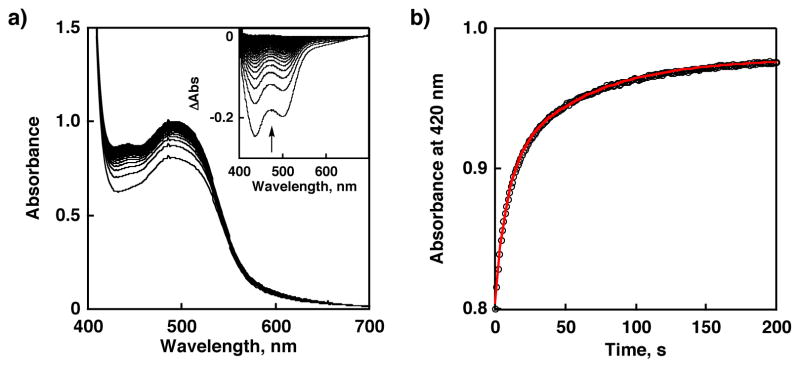
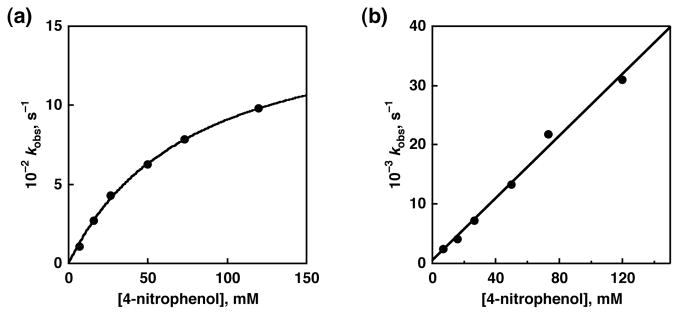
In order to gain more insight into the HAT mechanism, we gave scrutiny into the dependence of first-order rate constants on the concentration of phenolic substrates. Linear relationships between kobs and concentrations of substrates were observed in the HAT reactions of 4-phenylphenol, 4-tert-butylphenol, 4-chlorophenol, and 4-cyanophenol, except for the reaction of 4-nitrophenol. The reaction between [RuIII(dmp−)(TPA)]2+ and 4-nitrophenol was monitored by an increase in absorption at 440 and 500 nm derived from 1 (Figure 6). The pseudo-first-order rate constant exhibited a saturation behavior at higher potential of the substrate as can be seen in Figure 7a. This result clearly indicates the existence of a pre-equilibrium prior to the HAT reaction.36 In this case, kobs is given by following equation:
| (2) |
where K is the association constant. The data are fit well to this equation, giving value of k1 = 1.6 × 10⁻¹ s−1 and K = 13 M−1. This adduct formation is consistent with the negative activation entropy observed in the HAT reactions from TBP to [RuIII(dmp−)(TPA)]2+ as mentioned above. In sharp contrast to the case of [RuIII(dmp−)(TPA)]2+, concentration dependence of kobs for the reaction between [RuIII(dmdmp−)(TPA)]2+ and 4-nitrophenol showed a linear relationship as shown in Figure 7b. This is probably due to the fact that it is difficult for [RuIII(dmdmp−)(TPA)]2+ to form hydrogen bonding with phenols due to the steric hindrance of the dimethylamino group of the dmdmp− ligand. This difference indicates the importance of the 2-amino group of the pterin ligand as a substrate-trapping site by forming the hydrogen bond with the phenols in the HAT reactions.
Figure 6.
(a) Absorption spectral change in the course of the reaction of [RuIII(dmp−)(TPA)]2+ with 4-nitrophenol monitored by UV-vis spectrometer in MeCN at 293 K. Inset: difference spectra for the last spectrum. [RuIII(dmp−)(TPA)]2+ = 2.5 × 10⁻⁵ M; [4-nitrophenol] = 1.2 × 10⁻¹ M (b) The change of absorbance at 430 nm (circle) and the biexponential fit (red line).
Figure 7.
Concentration dependence of kobs for the reaction (a) between [RuIII(dmp−)(TPA)]2+ and 4-nitrophenol (circle) and curve fitting (solid line) based on eq 2. (b) Concentration dependence of kobs for the reaction [RuIII(dmdmp−)(TPA)]2+ and (circle) and curve fitting (solid line).
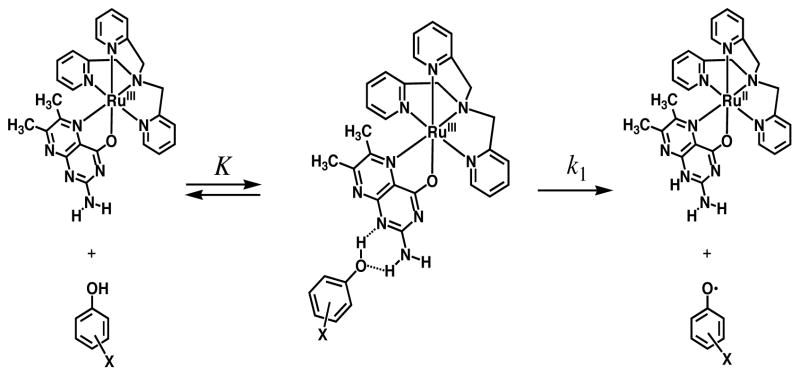
Taken together with the arguments described above, we propose that intermolecular hydrogen bonding to form an adduct occurs prior to HAT as shown in Scheme 4. The adduct structure is related to the crystal structures of 1 and 2 that forms hydrogen bonds with perchlorate of counter anion.21 The hydrogen bonding can be formed between the phenolic O-H group and the N-1 of the dmp− ligand in [RuIII(dmp−)(TPA)]2+, which are the most acidic and the most basic site in each entity.
Scheme 4.
Hydrogen Atom Abstraction from Phenols to [RuIII(dmp−)(TPA)]2+ through Hydrogen-Bonded Adduct
The 2-amino group can additionally form a hydrogen bond with the phenolic oxygen trapped in the vicinity. This two-point interaction may polarize the O-H bond and stabilize the transition state to facilitate the HAT reaction via an associative mechanism exhibiting the negative activation entropy.
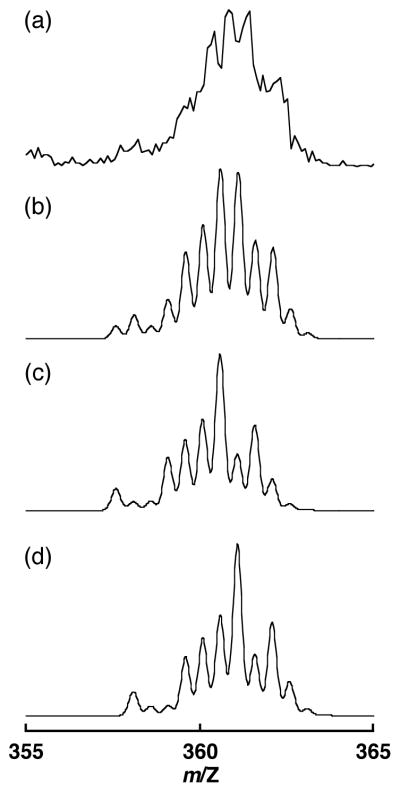
The hydrogen-bonded adduct between [RuIII(dmp−)(TPA)]2+ and 4-nitrophenol was detected by ESI-MS measurement in MeCN at 233K. The ESI-MS spectrum of the mixture of 3 (2.5 × 10⁻⁵ M), [FeIII(bpy)3](PF6)3 (2.5 × 10⁻⁵ M), and 4-nitrophenol (1.2 × 10⁻² M) in MeCN exhibited overlapped peaks derived from two dicationic species around m/Z = 361 at 233K (Figure 8(a)). The ion peaks are in good agreement with the superposition of simulated spectra of [RuIII(dmp−)(TPA)]2+–4-nitrophenol adduct and 1–4-nitrophenol adduct (Figure 8(b)–(d)). This result provides clear evidence for the adduct formation between 1 and 4-nitropenol even in the low concentration of the reactants, however, the adducts of the other substrates with [RuIII(dmp−)(TPA)]2+ could not be observed.
Figure 8.
(a) ESI-MS spectrum of [RuIII(dmp−)(TPA)]2+ and 4-nitrophenol in MeCN at 233 K. (b) Superposition of simulated spectrum of the adduct of [RuIII(dmp−)(TPA)]2+ with 4-nitrophenol (c) and that of the adduct of 1 and 4-nitrophenol (d).
The HAT reactions from deuteriated TBP to [RuIII(dmp−)(TPA)]2+ were performed in MeCN at 243–293 K to determine the kinetic isotope effects. Temperature dependence of the second-order rate constants was observed and the kinetic isotope effects (kH/kD) were determined to be 2.2 at 293 K and 4.3 at 243 K as listed in Table 2. The values are not so large, unlike the reactions exhibiting larger KIE values, such as that for lipoxygenases.18a The values fall in the range of “linear H-transfer unsymmetrical” (KIE =2~5) or “non-linear H-transfer bent” (KIE > 21/2) as a transition state.38 Based on the argument described above, the HAT reactions described here would experience a “non-linear H-transfer bent” transition state and it is consistent with the proposed intermediate in an associative mechanism with intermolecular hydrogen bonds as shown in Scheme 4. The kinetic isotope effects of the reaction of the Ru(III)-pterin complexes exhibits relatively large temperature dependence compared to C-H abstraction reactions with use of Cu(II)-phenoxyl radical complexes reported by Stack and coworkers.39
Table 2.
Kinetic Isotope Effects of the HAT Reactions from TBP to [RuIII(dmp−)(TPA)]2+ in MeCN
| kH, M−1 s−1 | kD, M−1 s−1 | kH/kD | |
|---|---|---|---|
| 293 K | (1.6 ± 0.1) × 104 | (7.5 ± 0.6) × 103 | 2.2 |
| 243 K | (7.3 ± 0.4) × 103 | (1.7 ± 0.1) × 103 | 4.3 |
Mechanistic Insights into HAT
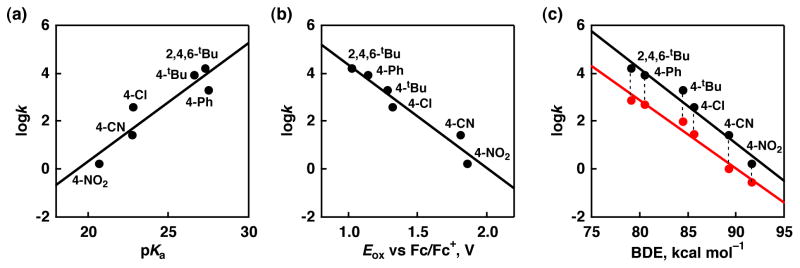
First, we considered relationships among thermodynamic parameters to gain mechanistic insights into the HAT reactions from the phenols to the Ru(IIII)-pterin complexes. If the rate-limiting step of the HAT reactions is proton transfer, an α value of Polanyi equation obtained from the plot of logk relative to pKa is expected to be −0.5.40 However, the plot of logk relative to pKa values of the phenols exhibits a linear relationship with a positive slope (α = 0.48) as depicted in Figure 9(a). The more acidic phenols afford slower rates, suggesting proton transfer (PT) from the substrates to [RuIII(dmp−)(TPA)]2+ is not rate-limiting. It has been reported that the pKa values and the oxidation potentials of phenol derivatives exhibit a linear relationship:41 The more acidic (lower pKa), the less easily oxidized (higher oxidation potentials). In the case of the plot of logk relative to oxidation potentials of the phenols, it shows a linear relationship with a negative slope as shown in Figure 9(b). The α value for the plot is −0.25, which is smaller than the ideal α value for a pure electron transfer process, −0.5.42 This result indicates that the ET from the substrates to the Ru(III) complex should be involved in the rate-determining step of the HAT, however the energy barrier of ET is thermodynamically up-hill more than 0.47 eV. Thus, the ET needs to be aided by PT as PCET. In addition, the relationship between the rate constants and BDE’s of the O-H bonds in the phenol derivatives also exhibits a linear relationship as can be seen in Figure 9(c): The stronger O-H bonds, the harder to be transferred. It is surprising that the O-H bond in 4-nitrophenol having 92 kcal mol−1 can be broken in this process, since hydrogen abstraction from a C-H bond with such large bond energy cannot easily occur even by metal-oxo species.43 The Ru(III)-pterin complexes have N–H BDE values of only 89 kcal mol−1 for 1 and 87 kcal mol−1 for 2 (as described in Scheme 2), both of which are slightly lower than the value of the BDE of the O-H bond in 4-nitrophenol. The uphill reactions may be followed by faster subsequent reactions to form stable coupling products.44 Actually, we could observe the formation of a dimeric product that should be derived from radical coupling reaction of two molecules of 4-nitrophenol as represented by the peak cluster at m/Z = 310 (C12H10N2O8+) in GC-MS analysis of the products (see Supporting Information, Figure S4).45 The α value of the rate constants to the BDEs of the phenolic O-H bonds shows a best correlation among the these three plots (−0.42). This result suggests that the HAT reaction between [RuIII(dmp−)(TPA)]2+ and phenols proceeds via concerted proton and electron transfer, i.e., PCET.
Figure 9.
Correlations of second-order rate constants for HAT reactions with thermodynamic parameters. (a) logk vs. pKa, (b) logk vs. oxidation potentials of phenols, and (c) logk vs. bond dissociation energy (BDE) of the O-H bond in a phenol derivative for [RuIII(dmp)(TPA)]2+ (black) and [RuIII(dmdmp)(TPA)]2+ (red).
A BDEs vs. logk plot for the reactions of [RuIII(dmdmp−)(TPA)]2+ shows a nearly identical slope (α = −0.38), as depicted in Figure 9c, where the k values of the HAT reaction between [RuIII(dmdmp−)(TPA)]2+ and phenols are 6–22 times smaller than those of the reactions using [RuIII(dmp−)(TPA)]2+. The smaller rate constants are likely due to the 2 kcal mol−1 lower BDE of [RuIII(dmdmp−)(TPA)]2+ (Scheme 2) and to the dimethylamino group of the dmdmp ligand inhibiting the formation of two-point hydrogen bonds with phenols (Scheme 4).
The rate constants for phenol oxidation are similar to those observed in other systems with similar driving force. Such comparisons are complicated for phenols because there are often significant solvent effects, steric effects, and effects of hydrogen bonded precursor adducts (as in Scheme 4 above).46,47 Still, Lau et al. have shown that rate constants of hydrogen atom abstraction from phenol correlate well with the oxidant BDE of oxyl radicals and a ruthenium(VI) dioxo complex (Figure 7 of reference47a). This correlation also seems to hold for abstraction by the nitrogen-centered 2,2-diphenyl-1-picrylhydrazyl radical (dpph•).48 The rate constants found in this study for 4-tert-butylphenol (a close model for phenol) appear to fall very close to Lau’s correlation line: k = (1.9 ± 0.1) × 103 M−1 s−1 at BDE = 89 kcal mol−1 for [RuIII(dmp−)(TPA)]2+, and k = 94 ± 2 M−1 s−1 at BDE = 87 kcal mol−1 for [RuIII(dmdmp−)(TPA)]2+.
Summary
The redox-active ruthenium complexes bearing pterins that are related to redox-non-innocent heteroaromatic coenzymes allowed us to demonstrate multistep PT, ET, and PCET processes. Their thermochemical square schemes have been established, as described in Scheme 2, by determining pKa values and redox potentials to estimate the BDE values.
Based on the BDE values, we examined HAT reactions from phenol derivatives to [RuIII(dmp−)(TPA)]2+ as a hydrogen atom acceptor to afford [RuII(Hdmp)(TPA)]2+ and the corresponding phenoxyl radicals that decomposed rapidly or gave a dimer as a radical coupling product, except TBP• that could be observed by ESR spectroscopy in quantitative yield. The linear relationships of log k values with the pKa, oxidation potentials, and BDEs of the O-H bonds in the phenols allowed us to conclude that the HAT reactions from the substrates to the Ru(III)-pterin complexes are PCET dominantly governed by the BDEs of the substrates. The saturation behavior of the pseudo-first-order rate constants with concentration of nitrophenol and the negative activation entropy indicate that the reaction proceeds via an associative mechanism involving intermolecular hydrogen bonding between the Ru(III)-pterin complex and the phenolic substrates prior to HAT. The HAT reactions of [RuIII(dmp−)(TPA)]2+ were accelerated compared to that of [RuIII(dmdmp−)(TPA)]2+ due to more stable hydrogen-bond formation in the pre-equilibrium step to trap the substrates and also in stabilization of the transition state. The observations described herein will provide valuable insight into new development of transition metal complexes having heteroaromatic coenzymes as ligands to exhibit multistep PCET.
Supplementary Material
Acknowledgments
This work was supported by Grants-in-Aid (Nos. 19205019 and 20108010), a Global COE program, “the Global Education and Research Center for Bio-Environmental Chemistry” from the Japan Society of Promotion of Science (JSPS) and The Ministry of Education, Science, Technology of Japan, by KOSEF/MEST through WCU project (R31-2008-000-10010-0), and by the U.S. National Institutes of Health (GM50422). S. M. appreciates a support from a JSPS postdoctoral fellowship (No. 10727).
Footnotes
Supporting Information Available: UV-vis spectra in the spectroscopic titrations to determine the pKa values, the ESR spectrum of 2,4,6-tri-tert-butyl phenoxyl radical obtained by the hydrogen atom transfer reaction from 2,4,6-tri-tert-butyl phenol to [RuIII(dmp−)(TPA)]2+, the mass spectrum of the reaction product of 4-nitrophenol with [RuIII(dmp−)(TPA)]2+. This material is available free of charge via the Internet at http://pubs.acs.org.
References
- 1.Paddock ML, Feher G, Okamura MY. Proc Natl Acad Sci USA. 2000;97:1548–1553. doi: 10.1073/pnas.97.4.1548. [DOI] [PMC free article] [PubMed] [Google Scholar]; (b) Feher G. Photosynth Res. 1998;55:3–40. [Google Scholar]
- 2.Alberts B, Bray D, Lewis J, Raff M, Roberts K, Watson JD. Molecular Biology of the Cell. 3. Garland Publishing; New York, USA: pp. 71–72.pp. 663–665. [Google Scholar]
- 3.(a) Huynh MHV, Meyer TJ. Chem Rev. 2007;107:5004–5064. doi: 10.1021/cr0500030. [DOI] [PMC free article] [PubMed] [Google Scholar]; (b) Stubbe J, van der Donk WA. Chem Rev. 1998;98:705–762. doi: 10.1021/cr9400875. [DOI] [PubMed] [Google Scholar]
- 4.(a) Cukier RI, Nocera DG. Annu Rev Phys Chem. 1998;49:337–369. doi: 10.1146/annurev.physchem.49.1.337. [DOI] [PubMed] [Google Scholar]; (b) Stubbe J, Nocera DG, Yee CS, Chang MCY. Chem Rev. 2003;103:2167–2201. doi: 10.1021/cr020421u. [DOI] [PubMed] [Google Scholar]; (c) Chang CJ, Chang MCY, Damrauer NH, Nocera DG. Biochim Biophys Acta. 2004;1655:13–28. doi: 10.1016/j.bbabio.2003.08.010. [DOI] [PubMed] [Google Scholar]
- 5.(a) Mayer JM. Ann Rev Phys Chem. 2004;55:363–390. doi: 10.1146/annurev.physchem.55.091602.094446. [DOI] [PubMed] [Google Scholar]; (b) Mayer JM, Rhile IJ. Biochim Biophys Acta. 2004;1655:51–58. doi: 10.1016/j.bbabio.2003.07.002. [DOI] [PubMed] [Google Scholar]
- 6.(a) Fukuzumi S. Prog Inorg Chem. 2009;56:49–153. [Google Scholar]; (b) Fukuzumi S. Bull Chem Soc Jpn. 1997;70:1–28. [Google Scholar]; (c) Fukuzumi S, Ishikawa K, Hironaka K, Tanaka T. J Chem Soc, Perkin Trans. 1987;2:751–760. [Google Scholar]
- 7.(a) Hatcher E, Soudackov AV, Hammes-Schiffer S. J Am Chem Soc. 2004;126:5763–5775. doi: 10.1021/ja039606o. [DOI] [PubMed] [Google Scholar]; (b) Lehnert N, Solomon EI. J Biol Inorg Chem. 2003;8:294–305. doi: 10.1007/s00775-002-0415-6. [DOI] [PubMed] [Google Scholar]; (c) Goldsmith CR, Stack TDP. Inorg Chem. 2006;45:6048–6055. doi: 10.1021/ic060621e. [DOI] [PubMed] [Google Scholar]; (d) Fukuzumi S. Helv Chim Acta. 2006;89:2425–2439. [Google Scholar]
- 8.Bordwell FG, Cheng JP, Ji GZ, Satish AV, Zhang X. J Am Chem Soc. 1991;113:9790–9795. [Google Scholar]
- 9.Mader EA, Larsen AS, Mayer JM. J Am Chem Soc. 2004;126:8066–8067. doi: 10.1021/ja049246k. [DOI] [PubMed] [Google Scholar]
- 10.Roth JP, Yoder JC, Won TJ, Mayer JM. Science. 2001;294:2524–2526. doi: 10.1126/science.1066130. [DOI] [PubMed] [Google Scholar]
- 11.(a) Waidmann CR, Zhou X, Tsai EA, Kaminsky W, Hrovat DA, Borden WT, Mayer JM. J Am Chem Soc. 2009;131:4729–4743. doi: 10.1021/ja808698x. [DOI] [PMC free article] [PubMed] [Google Scholar]; (b) Wu A, Mayer JM. J Am Chem Soc. 2008;130:14745–14754. doi: 10.1021/ja805067h. [DOI] [PMC free article] [PubMed] [Google Scholar]
- 12.(a) Fukuzumi S. In: Advances in Electron Transfer Chemistry. Mariano PS, editor. JAI press; Greenwich, CT: 1992. pp. 67–175. [Google Scholar]; (b) Fukuzumi S, Tanaka T. In: Photoinduced Electron Transfer. Fox MA, Chanon M, editors. Elsevier; Amsterdam: 1988. pp. 578–635. Part C; Chap. 10. [Google Scholar]; (c) Fukuzumi S, Koumitsu S, Hironaka K, Tanaka T. J Am Chem Soc. 1987;109:305–316. [Google Scholar]
- 13.De Colibus L, Mattevi A. Curr Opin Struct Biol. 2006;16:722–728. doi: 10.1016/j.sbi.2006.10.003. [DOI] [PubMed] [Google Scholar]; (b) Alberts B, Bray D, Lewis J, Raff M, Roberts K, Watson JD. Molecular Biology of the Cell. 3. Garland Publishing; New York, USA: pp. 659–662. [Google Scholar]
- 14.(a) Tollin G. In: Electron Transfer in Chemistry. Balzani V, editor. Vol. 5. Wiley-VCH; Weinheim: 2001. pp. 202–231. [Google Scholar]; (b) Fukuzumi S, Tanaka T. In: Photoinduced Electron Transfer. Fox MA, Chanon M, editors. Part C. Elsevier; Amsterdam: 1988. pp. 636–687. [Google Scholar]
- 15.(a) Bobst AM. Nature. 1968;220:164–165. doi: 10.1038/220164a0. [DOI] [PubMed] [Google Scholar]; (b) Mastropaolo D, Camerman A, Camerman N. Science. 1980;210:334–336. doi: 10.1126/science.7423195. [DOI] [PubMed] [Google Scholar]
- 16.(a) Fukuzumi S, Tanii K, Tanaka T. J Chem Soc, Chem Commun. 1989:816–818. [Google Scholar]; (b) Fukuzumi S, Tanii K, Tanaka T. Chem Lett. 1989:35–38. [Google Scholar]
- 17.(a) Burgmayer SJN. Struct Bond. 1998;92:67–119. [Google Scholar]; (b) Benkovic SJ, Sammons D, Armarego WLF, Waring P, Inners R. J Am Chem Soc. 1985;107:3706–3712. [Google Scholar]; (c) Raghavan R, Dryhurst G. J Electroanal Chem. 1981;129:189–212. [Google Scholar]; (d) Bobst A. Helv Chim Acta. 1967;50:2222–2225. [Google Scholar]
- 18.(a) Hille R. Chem Rev. 1996;96:2757–2816. doi: 10.1021/cr950061t. [DOI] [PubMed] [Google Scholar]; (b) Anderson OA, Flatmark T, Hough E. J Mol Biol. 2002;320:1095–1108. doi: 10.1016/s0022-2836(02)00560-0. [DOI] [PubMed] [Google Scholar]; (c) Anderson OA, Flatmark T, Hough E. J Mol Biol. 2001;314:279–291. doi: 10.1006/jmbi.2001.5061. [DOI] [PubMed] [Google Scholar]; (d) Erlandsen H, Bjørgo E, Flatmark T, Stevens RC. Biochemistry. 2000;39:2208–2217. doi: 10.1021/bi992531+. [DOI] [PubMed] [Google Scholar]; (e) Kappock TJ, Caradonna JP. Chem Rev. 1996;96:2659–2756. doi: 10.1021/cr9402034. [DOI] [PubMed] [Google Scholar]; (f) Raman CS, Li H, Martásek P, Král V, Masters BSS, Poulos TL. Cell. 1998;95:939–950. doi: 10.1016/s0092-8674(00)81718-3. [DOI] [PubMed] [Google Scholar]; (g) Crane BR, Arval AS, Ghosh DK, Wu C, Getzoff ED, Stuehr DJ, Tainer JA. Science. 1998;279:2121–2126. doi: 10.1126/science.279.5359.2121. [DOI] [PubMed] [Google Scholar]; (h) Aoyagi M, Arval AS, Ghosh DK, Stuehr DJ, Tainer JA, Getzoff ED. Biochemistry. 2001;40:12826–12832. doi: 10.1021/bi011183k. [DOI] [PubMed] [Google Scholar]
- 19.Kaim W, Schwederski B, Heilmann O, Hornung FM. Coord Chem Rev. 1999;182:323–342. [Google Scholar]
- 20.Abelleira A, Galang RD, Clarke MJ. Inorg Chem. 1990;29:633–639. [Google Scholar]
- 21.Miyazaki S, Ohkubo K, Kojima T, Fukuzumi S. Angew Chem, Int Ed. 2008;47:9669–9672. doi: 10.1002/anie.200802835. [DOI] [PubMed] [Google Scholar]
- 22.(a) Miyazaki S, Kojima T, Sakamoto T, Matsumoto T, Ohkubo K, Fukuzumi S. Inorg Chem. 2008;47:333–343. doi: 10.1021/ic701759c. [DOI] [PubMed] [Google Scholar]; (b) Fukuzumi S, Kojima T. J Biol Inorg Chem. 2008;13:321–333. doi: 10.1007/s00775-008-0343-1. [DOI] [PubMed] [Google Scholar]
- 23.Kojima T, Sakamoto T, Matsuda Y, Ohkubo K, Fukuzumi S. Angew Chem, Int Ed. 2003;42:4951–4954. doi: 10.1002/anie.200352111. [DOI] [PubMed] [Google Scholar]
- 24.Armarego WLF, Chai CLL. Purification of Laboratory Chemicals. 5. Butterworth-Heinemann; Oxford, UK: 2003. [Google Scholar]
- 25.Goldsmith CR, Jonas RT, Stack TDP. J Am Chem Soc. 2002;235:83–96. doi: 10.1021/ja016451g. [DOI] [PubMed] [Google Scholar]
- 26.(a) Izutsu K. Acid-Base Dissociation Constants in Dipolar Aprotic Solvents. Blackwell Scientific; Boston: 1990. [Google Scholar]; (b) Coetzee JF, Padmanabhan GR. J Phys Chem. 1965;69:3193–3196. [Google Scholar]
- 27.Felton GAN, Glass RS, Lichtenberger DL, Evans DH. Inorg Chem. 2006;45:9181–9184. doi: 10.1021/ic060984e. [DOI] [PubMed] [Google Scholar]
- 28.(a) Parker VD, Handoo KL, Roness F, Tilset M. J Am Chem Soc. 1991;113:7493–7498. [Google Scholar]; (b) Wayner DDM, Parker VD. Acc Chem Res. 1993;26:287–294. [Google Scholar]; (c) Skagestad V, Tilset M. J Am Chem Soc. 1993;115:5077–5083. [Google Scholar]; (d) Tilset M, Parker VD. J Am Chem Soc. 1989;111:6711–6717. [Google Scholar]
- 29.Tilset M. In: Electron Transfer in Chemistry. Balzani V, editor. Vol. 2. Wiley-VCH; Weinheim, Germany: 2001. pp. 677–713. [Google Scholar]
- 30.(a) Wu A, Mayer JM. J Am Chem Soc. 2008;130:14745–14754. doi: 10.1021/ja805067h. [DOI] [PMC free article] [PubMed] [Google Scholar]; (b) Mader EA, Manner VW, Markle TF, Wu A, Franz JA, Mayer JM. J Am Chem Soc. 2009;131:4335–4345. doi: 10.1021/ja8081846. [DOI] [PMC free article] [PubMed] [Google Scholar]
- 31.Rhile IJ, Markle TF, Nagao H, DiPasquale AG, Lam OP, Lockwood MA, Rotter K, Mayer JM. J Am Chem Soc. 2006;128:6075–6088. doi: 10.1021/ja054167+. [DOI] [PMC free article] [PubMed] [Google Scholar]
- 32.Fukuzumi S, Wong CL, Kochi JK. J Am Chem Soc. 1980;102:2928–2939. [Google Scholar]
- 33.[RuIII(dmp−)(TPA)]3+: λmax [nm] (ε (M−1 cm−1)): 380 (6.0 × 10³), 500 (2.1 × 10³).
- 34.Wright JS, Johnson ER, DiLabio GA. J Am Chem Soc. 2001;123:1173–1183. doi: 10.1021/ja002455u. [DOI] [PubMed] [Google Scholar]
- 35.The lack of ESR signals in the reaction mixtures including other phenols suggests the formation of diamagnetic coupling products.
- 36.Mader EA, Davidson ER, Mayer JM. J Am Chem Soc. 2007;129:5153–5166. doi: 10.1021/ja0686918. [DOI] [PMC free article] [PubMed] [Google Scholar]
- 37.Foti MC, Daquino C, Mackie ID, DiLabio GA, Ingold KU. J Org Chem. 2008;73:9270–9282. doi: 10.1021/jo8016555. [DOI] [PubMed] [Google Scholar]
- 38.Kwart H. Acc Chem Res. 1982;15:401–408. [Google Scholar]
- 39.Pratt RP, Stack TDP. Inorg Chem. 2005;44:2367–2375. doi: 10.1021/ic048695i. [DOI] [PubMed] [Google Scholar]
- 40.Fecenko CJ, Thorp HH, Meyer TJ. J Am Chem Soc. 2007;129:15098–15099. doi: 10.1021/ja072558d. [DOI] [PubMed] [Google Scholar]
- 41.Bordwell FG, Cheng JP. J Am Chem Soc. 1991;113:1736–1743. [Google Scholar]
- 42.Marcus RA, Sutin N. Biochim Biophys Acta. 1985;811:265–322. [Google Scholar]
- 43.For Ru=O: Che CM, Tang WT, Wong KW, Li CK. J Chem Soc, Dalton Trans. 1991:3277–3280.Seok WK, Meyer TJ. J Am Chem Soc. 1988;110:7358–7367.For Fe=O: Kaizer J, Klinker EJ, Oh NY, Rohde JU, Song WJ, Stubna A, Kim J, Münck E, Nam W, Que L., Jr J Am Chem Soc. 2004;126:472–473. doi: 10.1021/ja037288n.
- 44.Yiu DTY, Lee MFW, Lam WWY, Lau TC. Inorg Chem. 2003;42:1225–1232. doi: 10.1021/ic026184v. [DOI] [PubMed] [Google Scholar]
- 45.Napolitano A, Palumbo A, d’Ischia M. Tetrahedron. 2000;56:5941–5945. [Google Scholar]
- 46.See, for instance: Valgimigli L, Banks JT, Ingold KU, Lusztyk J. J Am Chem Soc. 1995;117:9966–71.Snelgrove DW, Lusztyk J, Banks JT, Mulder P, Ingold KU. J Am Chem Soc. 2001;123:469–477.
- 47.(a) Yiu DTY, Lee MFW, Lam WWY, Lau TC. Inorg Chem. 2003;42:1225–1232. doi: 10.1021/ic026184v. [DOI] [PubMed] [Google Scholar]; (b) Lam WWY, Man WL, Lau TC. Coord Chem Rev. 2007;251:2238–2252. [Google Scholar]
- 48.For HAT from phenol to dpph•, k = 0.1 M−1 s−1 at BDE = 79 kcal mol−1.37
Associated Data
This section collects any data citations, data availability statements, or supplementary materials included in this article.


