

ABSTRACT
Kaposi’s sarcoma (KS) is caused by Kaposi’s sarcoma-associated herpesvirus (KSHV; human herpesvirus 8). KS is an AIDS-defining cancer, and it is changing in the post-antiretroviral therapy (post-ART) era. In countries with ready access to ART, approximately one-third of KS cases present in patients with undetectable HIV loads and CD4 counts of ≥200 cells/µl. This is in contrast to pre-ART era KS, which was associated with systemic HIV replication and CD4 counts of ≤200 cells/µl. Using primary patient biopsy specimens, we identified a novel molecular signature that characterizes AIDS KS lesions that develop in HIV-suppressed patients on ART: KSHV transcription is limited in HIV-suppressed patients. With one exception, only the canonical viral latency mRNAs were detectable. In contrast, early AIDS KS lesions expressed many more viral mRNAs, including, for instance, the viral G protein-coupled receptor (vGPCR).
IMPORTANCE
This is the first genomewide study of Kaposi’s sarcoma-associated herpesvirus (KSHV) transcription in KS lesions in the post-antiretroviral (post-ART) era. It shows that the gene expression of KSHV is altered in patients on ART, and it provides clinical evidence for active AIDS (as characterized by high HIV load and low CD4 counts) being a potential modulator of KSHV transcription. This implies a novel mode of pathogenesis (tightly latent KS), which may inform KS cancer treatment options in the post-ART era.
Observation
Kaposi’s sarcoma (KS) is an acquired immune deficiency syndrome (AIDS)-defining condition. Even after the introduction of antiretroviral therapy (ART), KS has continued to cause morbidity and mortality in human immunodeficiency virus (HIV)-infected individuals (1). KS requires infection with the Kaposi’s sarcoma-associated herpesvirus (KSHV) (2, 3). The risk of KS among individuals infected with KSHV is increased by poorly controlled HIV infection or immune suppression, as measured by low CD4+ T-lymphocyte counts (4, 5).
However, we and others have observed that KS can persist or develop de novo in patients on long-term ART, despite high CD4 counts and despite undetectable HIV in plasma (6, 7). This is not entirely unexpected since the classic (HIV-negative) form of KS is not associated with significant immunosuppression (8). Histologically, KS lesions can be classified into patch, plaque, and nodal stages, but molecular markers of KS subclasses are missing. We observed previously that AIDS KS lesions varied in their pattern of KSHV mRNA levels. Some exhibited high-level KSHV lytic gene transcription, whereas others expressed only the limited set of viral latent genes (9, 10). Here, we set out to molecularly classify AIDS KS that developed in the presence of successful ART (i.e., in the absence of ongoing HIV replication).
Deidentified skin KS biopsy specimens were collected from male individuals on highly active ART (HAART) after 2004 with a mean age of 40 years, undetectable HIV viral load (limit of detection, 50 copies/ml), and CD4 counts of ≥200 cells/µl. The mRNA was isolated, and KSHV gene expression was determined by real-time quantitative PCR (qPCR) as described previously (10).
Evidence of KSHV lytic mRNAs was found in only 1 out of 8 (13%) KS biopsy specimens from HIV-suppressed patients collected after 2004 (Fig. 1). In comparison, 7 out of 11 (63%) KS biopsy specimens from patients with fulminant AIDS and CD4 counts below 200 cells/µl (median CD4 count, 33 cells/µl, with standard error of the mean [SEM] of 23 cells), which were collected between 1996 and 1998, showed evidence of lytic mRNAs (P ≤ 0.005 by Fisher’s exact test). Biopsy specimens with a “lytic” KSHV profile had (i) many more detectable lytic mRNA transcripts, as well as (ii) higher levels of lytic mRNAs on an individual gene basis. KSHV latency-associated nuclear antigen (LANA) mRNA is not depicted in Fig. 1, since it was used for normalization. Note that the primer 73 5′ untranscribed region (5′UTR) (noted by * in Fig. 1), which measures the spliced form of the 5′UTR of the major KSHV latency transcript, was present in all samples.
FIG 1 .
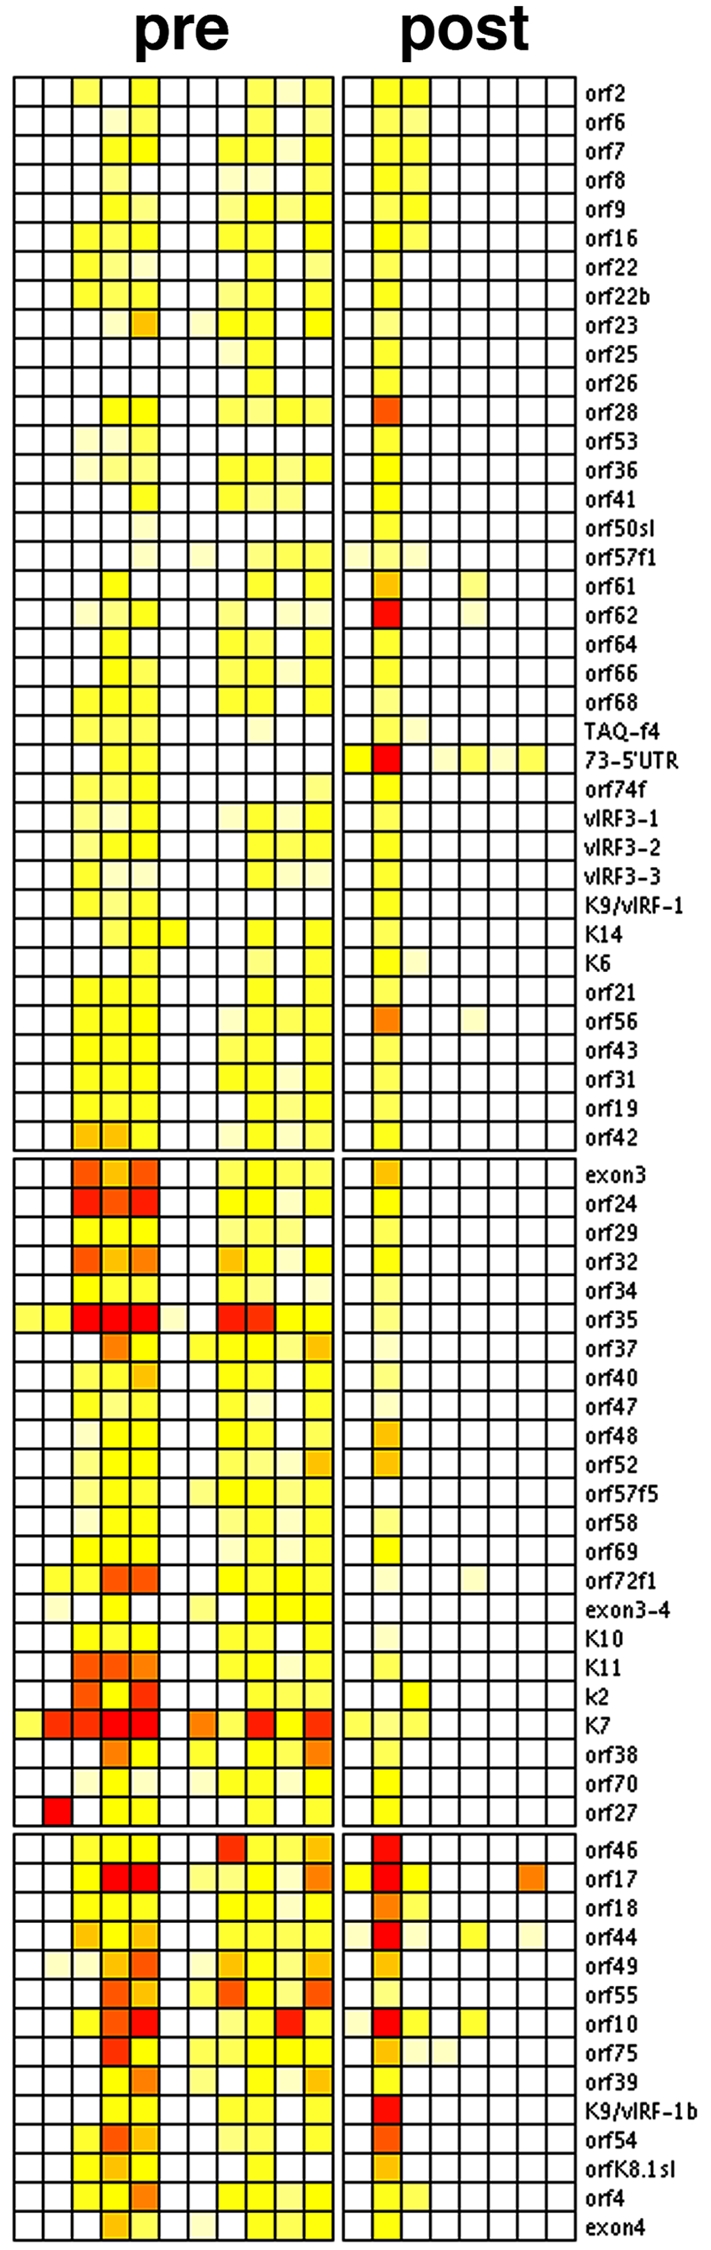
Unsupervised cluster analysis of KSHV transcription in KS (heat map representation). Shown are relative levels of KSHV mRNAs in KS biopsy specimens obtained from patients with low CD4 counts and detectable HIV viral loads (pre) or with CD4 ≥200 and no detectable HIV (post). Red indicates maximal, yellow intermediate, and white low levels of individual mRNAs. With the exception of a single case (arrow at bottom), none of the post-HAART KS biopsy specimens show evidence of KSHV lytic mRNAs. In contrast, in >50% of lesions from pre-HAART KS, the full complement of lytic mRNAs was detectable.
Two types of normalization were possible in order to compare mRNA levels across multiple samples. Either all mRNA levels in a sample could be normalized to a cellular standard, one (or more [11]) so-called “housekeeping gene,” or all mRNAs could be normalized to a viral standard mRNA.
The β-actin mRNA level for HIV-suppressed patients had a mean cycle threshold (CT) of 26.69, with a 95% confidence interval (CI) of 24.69 to 28.68. The β-actin mRNA level for a group of AIDS KS samples had a mean CT of 29.31 with a 95% CI of 26.52 to 32.10. There was no statistical difference in the β-actin levels based on the Welch two-sample t test. If anything, we had slightly more mRNA from the post-HAART biopsy specimens, and thus a higher sensitivity of detecting lytic KSHV mRNAs if there were any. This suggests that the lack of lytic mRNA detection in the HIV-suppressed KS lesions was not due to lesser sensitivity or systematic technical differences among both groups, but reflects the biology of the virus.
Based on our recent experience in analyzing KS mRNA levels in clinical trials (12, 13), we choose to normalize to a common stable mRNA that encodes latency-associated nuclear antigen (LANA), vCycl, and vFLIP (9). This mRNA as well as the LANA protein is expressed in every KSHV-infected KS tumor cell, latent and lytic, based on in situ studies (9, 14). The level of this “tricistronic” mRNA does not change dramatically upon reactivation in primary effusion lymphoma (PEL) (15, 16) and is also present upon replication in endothelial cells (17). We therefore normalized all mRNA signals to LANA gene expression. Normalizing to LANA mRNA thus normalized to the number of KS tumor cells within a biopsy specimen rather than nonneoplastic tumor infiltrating and/or stromal cells. Figure 2C demonstrates the heterogeneity of KS lesions with regard to LANA-expressing cells. This uses a larger data set of KS lesions in HIV-suppressed patients than that in reference 13. The mRNA levels of two different so-called housekeeping genes, coding for actin and hypoxanthine phosphoribosyltransferase (HPRT), correlated well (Pearson correlation, r = 0.85) (Fig. 2C). The mRNA levels of two different latent genes, coding for vCyc and LANA, correlated well (Pearson correlation, r = 0.96). However, the correlation between either viral mRNA and either host mRNA was substantially lower, with a mean of 0.54 and a range of 0.45 to 0.64. This attests to the fact that different KS lesions contain different numbers of KSHV-infected cells. The possibility to thus factor out non-tumor cells represents one of the major advantage of using viral mRNA levels as biomarkers as opposed to cellular mRNAs, for which it is often not possible to discern between tumor cell inherent changes and changes due to differences in tumor content within a biopsy specimen.
FIG 2 .

(A) Three-point moving averages of mean KSHV mRNA levels in KS biopsy specimens from the patients with low CD4 counts (solid line) and patients with undetectable HIV load and CD4 counts of ≥200 (open circles). Since real-time qPCR is quantitative within an extended linear range, we calculated the relative abundance of each viral mRNA compared to LANA mRNA as 1.8−ΔCT(LANA) and expressed it as percentage of LANA mRNA on a logarithmic scale (vertical axis). (B) Pairwise comparisons of individual KSHV mRNAs. Shown are box plots for the levels of two KSHV lytic mRNAs (v-cyclin [cyc], vGPCR) relative to a KSHV latent mRNA (LANA). The vertical axis is on a log10 scale. The horizontal labels signify patients with AIDS or nondetectable HIV KS. The bold horizontal line indicates the median, box ends the lower and upper quartiles, and dotted lines the range of the data. Outliers are indicated by dots. (C) Pairwise correlations of log2 mRNA levels (CT) for the two cellular genes coding for actin (hu. actin) and hypoxanthine-guanine phosphoribosyltransferase (HPRT) and two latent viral genes coding for the viral cyclin (orf72f1) and LANA (lat273F), which originate from the same constitutive promoter. Note that higher mRNA levels correspond to lower CT numbers. Shown are scatter plots and a linear regression fit line below the diagonal, distribution of CTs for the individual genes across all samples on the diagonal, and pairwise Pearson correlation coefficients above the diagonal of this panel matrix.
Median mRNA levels for each gene were computed (Fig. 2B). Every KSHV lytic mRNA was present at higher levels in KS biopsy specimens from the early ART, high-HIV, low-CD4 patients compared to post-ART KS samples from patients with undetectable HIV loads. The average difference was 3.77-fold with 95% CI of 2.97- to 4.56-fold and P ≤ 0.005 by paired Wilcoxon’s rank sum test of medians for each mRNA. The two exceptions (indicated by * in Fig. 2A) were orf26 and orf61.
Within-group variation in mRNA levels was higher for KS biopsy specimens from patients in the pre-HAART era compared to biopsy specimens from HIV-suppressed KS patients, with a mean difference of standard deviations (SDs) between groups of a 2.32 CT (95% CI, 1.95 to 2.68; P ≤ 0.005 by paired Wilcoxon’s rank sum test). As expected, latent viral mRNAs were most abundant and varied the least. Analysis of residuals identified the following genes that did not differ between groups: the KSHV latent genes coding for vCYC and LANA, but also orf10, orf17, orf44, orf46, and orf75 and the K7 and kBZIP genes.
Representative examples of individual mRNAs are shown in Fig. 2B. As expected, the levels of a latent mRNA, vCYC, did not differ significantly between groups. In contrast, levels of the viral GPCR homolog (an early lytic mRNA) were lower in lesions from HIV-suppressed patients.
Next, we compared the pattern of lytic mRNA levels in KS biopsy specimens to the pattern of lytic mRNAs in PEL. We saw no significant correlation between lytic mRNAs in KS and those in PEL after viral reactivation (data not shown): i.e., those that are part of the canonical cascade of gene expression leading to successful viral replication, viral egress, and consequent host cell death (18). This suggests that within a KS lesion, KSHV expression is dysregulated. It does not seem to follow the highly ordered cascade of gene expression needed for viral replication, and many KSHV proteins that were classified as lytic, based on early studies in PEL, seem to serve a function in tumorigenesis as well as for virus production. The precedent here is the K1 protein, which we found in a subset of KS lesions (19), even though the gene coding for it had been classified as a “lytic” gene. Another one is K2/vIL6, which responds directly to interferon (IFN) signaling in the absence of productive replication and to the viral transactivator RTA (replication and transcription activator) in the context of viral reactivation and replication (20). Culture-based studies also lend credence to the involvement of many more than the canonical latent genes in KS pathogenesis. Grundhoff and Ganem postulated a role for intermittent lytic reactivation for KSHV persistence (21), and Chandriani and Ganem recently found evidence for variable, but significant expression of vIL6 and K1 in PEL cell lines (22). This is the first report of this phenomenon in clinical KS biopsy specimens.
Implications for clinical studies.
AIDS KS takes a more aggressive clinical course than transplant-associated or classic KS (reviewed in reference 23). Classic KS in particular is associated with minuscule amounts of systemically circulating virus (24). Our study provides new evidence for a postulated role of HIV in AIDS KS, perhaps through HIV-tat (25) or perhaps through cellular cytokines that reactivate KSHV in the setting of low CD4 T cells. There exists another explanation with potentially great clinical relevance. Particular drugs within the ART regimen could stymie KSHV reactivation and replication. One such candidate drug, nelfinavir, has recently emerged (26). Finally, to borrow from detailed insights into HSV-1 reactivation (27), it may be that in patients with high CD4 counts there exists a sufficient number of KSHV cognate CD8 cells, which even though they cannot prevent lesion occurrence per se, may limit viral reactivation and rapidly eliminate cells that express lytic KSHV proteins. There are limitations to this interpretation, which need further studies. We could not separate the effect of HIV levels from CD4 depletion, as these were coupled AIDS KS. We also cannot discern the impact of different ART regimens with regard to KSHV transcription. It is quite possible that particular drug regimens influence KS and KSHV differentially (28).
By profiling KSHV mRNAs genomewide, we find evidence for two molecular classes of KS: those with a “lytic” viral mRNA profile, as defined by detectable mRNA levels for ≥50% of viral genes, and those with tightly latent KSHV. This was not a consequence of copy number or fraction of infected cells, as in our comparisons, the signals were normalized to the constitutive viral LANA mRNA. This is the first study of KS lesions from HIV-suppressed KS patients in the post-HAART era. It establishes a novel biomarker for the stratification of KS.
We speculate that KS lesions that express viral lytic proteins, such as the viral thymidine kinase or the viral phosphorylase, may be susceptible to treatment with antiviral drugs, but that the majority of lesions in HIV-suppressed individuals are not.
Viral RNA profiling.
RNA was isolated and analyzed by real-time qPCR for all KSHV mRNAs as previously described (18). All primers have a predicted melting temperature (Tm) of 60 ± 1°C. Real-time qPCR was conducted under universal cycling conditions (40 cycles) with SYBR green dye as the method of detection. The final primer concentration was 250 nM in a total 20.0-µl reaction. Total RNA was isolated using triazole (Sigma, Inc.) and subjected to DNase I treatment (Zymed, Inc.). RNA was reverse transcribed using a cDNA archive kit (Applied Biosystems, Inc.). RNA integrity was evaluated using an Agilent 2100 bioanalyzer series C and software (Agilent, Inc.) and qPCR conducted on an Opticon-2 MJR instrument (Bio-Rad Inc.). The instrument error was ≤6%. Control reactions (reverse transcriptase [RT] negative) were uniformly negative. All measurements were conducted in triplicate.
The mean cycle threshold (CT) values, representing relative mRNA abundance on a log2 scale, were first normalized to KSHV latency-associated nuclear antigen (LANA) mRNA and then standardized (Z-transformation [29]) to the median of each biopsy specimen. We did not find a correlation between variability of gene expression as measured by SD and overall expression levels (data not shown). This demonstrates that the data were not biased.
Unsupervised clustering was conducted using Arrayminer (Optimaldesign, Inc.). Additional calculations were performed in R, version 2.5.0. The linear trend was computed using robust regression (30).
ACKNOWLEDGMENTS
We thank first and foremost the patients for contributing biopsy specimens, Susan Krown for advice and invaluable insights, B. Damania, and A. O’Hara for critical reading and C. Hilscher for expert technical help. Additional deidentified KS biopsy specimens were obtained from the AIDS and cancer specimen resource (ACSR).
This work was supported by the AIDS malignancy consortium and Public Health Service grants CA109232, DE018304, and CA019014 to D.P.D.
Footnotes
Citation Dittmer DP. 2011. Restricted Kaposi’s sarcoma (KS) herpesvirus transcription in KS lesions from patients on successful antiretroviral therapy. mBio 2(6):e00138-11. doi:10.1128/mBio.00138-11.
REFERENCES
- 1. Engels EA, et al. 2006. Trends in cancer risk among people with AIDS in the United States 1980–2002. AIDS 20:1645–1654 [DOI] [PubMed] [Google Scholar]
- 2. Chang Y, et al. 1994. Identification of herpesvirus-like DNA sequences in AIDS-associated Kaposi’s sarcoma. Science 266:1865–1869 [DOI] [PubMed] [Google Scholar]
- 3. Moore PS, Chang Y. 1995. Detection of herpesvirus-like DNA sequences in Kaposi’s sarcoma in patients with and without HIV infection. N. Engl. J. Med. 332:1181–1185 [DOI] [PubMed] [Google Scholar]
- 4. Lebbé C, et al. 1998. Clinical and biological impact of antiretroviral therapy with protease inhibitors on HIV-related Kaposi’s sarcoma. AIDS 12:F45–F49 [DOI] [PubMed] [Google Scholar]
- 5. Martin JN, et al. 1998. Sexual transmission and the natural history of human herpesvirus 8 infection. N. Engl. J. Med. 338:948–954 [DOI] [PubMed] [Google Scholar]
- 6. Krown SE, Lee JY, Dittmer DP. 2008. More on HIV-associated Kaposi’s sarcoma. N. Engl. J. Med. 358:535–536 [DOI] [PMC free article] [PubMed] [Google Scholar]
- 7. Maurer T, Ponte M, Leslie K. 2007. HIV-associated Kaposi’s sarcoma with a high CD4 count and a low viral load. N. Engl. J. Med. 357:1352–1353 [DOI] [PubMed] [Google Scholar]
- 8. Kaposi M. 1872. Idiopathisches multiples Pigmentsarkom der Haut. Arch. Dermatol. Syph. 4:265–273 [Google Scholar]
- 9. Dittmer D, et al. 1998. A cluster of latently expressed genes in Kaposi’s sarcoma-associated herpesvirus. J. Virol. 72:8309–8315 [DOI] [PMC free article] [PubMed] [Google Scholar]
- 10. Dittmer DP. 2003. Transcription profile of Kaposi’s sarcoma-associated herpesvirus in primary Kaposi’s sarcoma lesions as determined by real-time PCR arrays. Cancer Res. 63:2010–2015 [PubMed] [Google Scholar]
- 11. Vandesompele J, et al. 2002. Accurate normalization of real-time quantitative RT-PCR data by geometric averaging of multiple internal control genes. Genome Biol. 3:RESEARCH0034. [DOI] [PMC free article] [PubMed] [Google Scholar]
- 12. Krown SE, Dittmer DP, Cesarman E. 2011. Pilot study of oral valganciclovir therapy in patients with classic Kaposi sarcoma. J. Infect. Dis. 203:1082–1086 [DOI] [PMC free article] [PubMed] [Google Scholar]
- 13. Lechowicz M, et al. 2009. Molecular and clinical assessment in the treatment of AIDS Kaposi sarcoma with valproic acid. Clin. Infect. Dis. 49:1946–1949 [DOI] [PMC free article] [PubMed] [Google Scholar]
- 14. Dupin N, et al. 1999. Distribution of human herpesvirus-8 latently infected cells in Kaposi’s sarcoma, multicentric Castleman’s disease, and primary effusion lymphoma. Proc. Natl. Acad. Sci. U. S. A. 96:4546–4551 [DOI] [PMC free article] [PubMed] [Google Scholar]
- 15. Jeong J, Papin J, Dittmer D. 2001. Differential regulation of the overlapping Kaposi’s sarcoma-associated herpesvirus vGCR (orf74) and LANA (orf73) promoters. J. Virol. 75:1798–1807 [DOI] [PMC free article] [PubMed] [Google Scholar]
- 16. Staudt MR, Dittmer DP. 2006. Promoter switching allows simultaneous transcription of LANA and K14/vGPCR of Kaposi’s sarcoma-associated herpesvirus. Virology 350:192–205 [DOI] [PubMed] [Google Scholar]
- 17. Krishnan HH, et al. 2004. Concurrent expression of latent and a limited number of lytic genes with immune modulation and antiapoptotic function by Kaposi’s sarcoma-associated herpesvirus early during infection of primary endothelial and fibroblast cells and subsequent decline of lytic gene expression. J. Virol. 78:3601–3620 [DOI] [PMC free article] [PubMed] [Google Scholar]
- 18. Fakhari FD, Dittmer DP. 2002. Charting latency transcripts in Kaposi’s sarcoma-associated herpesvirus by whole-genome real-time quantitative PCR. J. Virol. 76:6213–6223 [DOI] [PMC free article] [PubMed] [Google Scholar]
- 19. Wang L, Dittmer DP, Tomlinson CC, Fakhari FD, Damania B. 2006. Immortalization of primary endothelial cells by the K1 protein of Kaposi’s sarcoma-associated herpesvirus. Cancer Res. 66:3658–3666 [DOI] [PubMed] [Google Scholar]
- 20. Chatterjee M, Osborne J, Bestetti G, Chang Y, Moore PS. 2002. Viral IL-6-induced cell proliferation and immune evasion of interferon activity. Science 298:1432–1435 [DOI] [PubMed] [Google Scholar]
- 21. Grundhoff A, Ganem D. 2004. Inefficient establishment of KSHV latency suggests an additional role for continued lytic replication in Kaposi sarcoma pathogenesis. J. Clin. Invest. 113:124–136 [DOI] [PMC free article] [PubMed] [Google Scholar]
- 22. Chandriani S, Ganem D. 2010. Array-based transcript profiling and limiting-dilution reverse transcription-PCR analysis identify additional latent genes in Kaposi’s sarcoma-associated herpesvirus. J. Virol. 84:5565–5573 [DOI] [PMC free article] [PubMed] [Google Scholar]
- 23. Levy JA. 1999. HIV and the pathogenesis of AIDS. ASM Press, Washington, DC [Google Scholar]
- 24. Guttman-Yassky E, et al. 2007. Relationship between human herpesvirus 8 loads and disease stage in classic Kaposi sarcoma patients. Diagn. Microbiol. Infect. Dis. 57:387–392 [DOI] [PubMed] [Google Scholar]
- 25. Ensoli B, Barillari G, Salahuddin SZ, Gallo RC, Wong-Staal F. 1990. Tat protein of HIV-1 stimulates growth of cells derived from Kaposi’s sarcoma lesions of AIDS patients. Nature 345:84–86 [DOI] [PubMed] [Google Scholar]
- 26. Gantt S, et al. 2011. The HIV protease inhibitor nelfinavir inhibits Kaposi’s sarcoma-associated herpesvirus replication in vitro. Antimicrob. Agents Chemother. 55:2696–2703 [DOI] [PMC free article] [PubMed] [Google Scholar]
- 27. Schiffer JT, et al. 2010. Mucosal host immune response predicts the severity and duration of herpes simplex virus-2 genital tract shedding episodes. Proc. Natl. Acad. Sci. U. S. A. 107:18973–18978 [DOI] [PMC free article] [PubMed] [Google Scholar]
- 28. Sgadari C, et al. 2002. HIV protease inhibitors are potent anti-angiogenic molecules and promote regression of Kaposi sarcoma. Nat. Med. 8:225–232 [DOI] [PubMed] [Google Scholar]
- 29. Troyanskaya OG, Garber ME, Brown PO, Botstein D, Altman RB. 2002. Nonparametric methods for identifying differentially expressed genes in microarray data. Bioinformatics 18:1454–1461 [DOI] [PubMed] [Google Scholar]
- 30. Rousseeuw P, Lerou A. 2003. Robust regression and outlier detection. Wiley and Sons, Hoboken, NJ [Google Scholar]