

Abstract
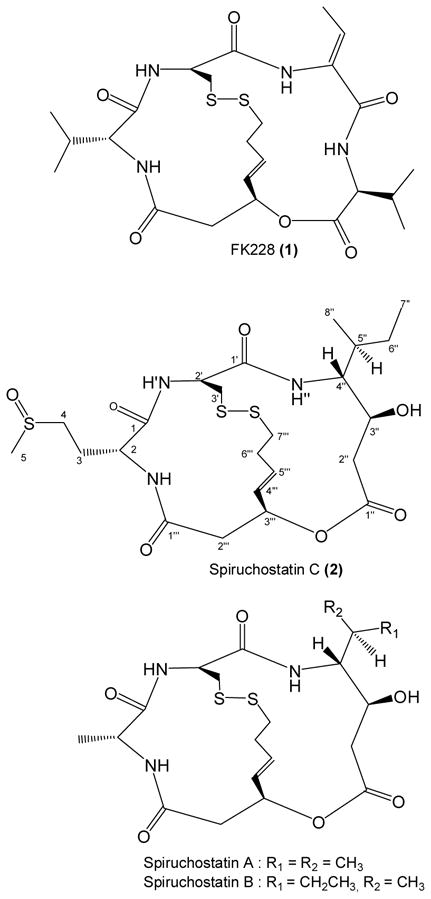
Bioactivity guided fractionation of an extract of Burkholderia thailandensis led to the isolation and identification of a new cytotoxic depsipeptide and its dimer. Both compounds potently inhibited the function of histone deacetylases 1 and 4. The monomer, spiruchostatin C (2), was tested side-by-side with the clinical depsipeptide FK228 (1, Istodax®, romidepsin) in a murine hollow fiber assay consisting of 12 implanted tumor cell lines. Spiruchostatin C (2) showed good activity towards LOX IMVI melanoma cells and NCI-H522 non small cell lung cancer cells. Overall, however, FK228 (1) showed a superior in vivo antitumor profile compared to the new compound.
Histone deacetylases (HDACs) are enzymes involved in the regulation of eukaryotic and prokaryotic RNA synthesis through the removal of acetyl groups from ε-N-acetyl lysine on a histone, thereby restricting DNA transcription. As of 2008, four classes of HDACs consisting of 18 isoforms have been identified,1 and attempts are being made to characterize the role of individual isoforms. Natural product inhibitors of histone deacetylases (HDACi) are now finding applications as anticancer agents,2–4 with the recent FDA approval of the class I HDAC inhibitor FK228 (1) (Istodax®, Celgene Corporation) for the treatment of human cutaneous T-cell lymphoma. Continuing research is in this area is aimed at finding compounds that specifically inhibit individual HDAC isoforms that have not previously been targeted, and that may be used to treat other types of cancer or as experimental tools in assigning functions to individual HDAC isoforms.3 In a recent publication,5 the biological activity and structure elucidation of the bicyclic depsipeptides thailandepsins A and B from the gram-negative bacteria Burkholderia thailandensis were described. In this work, solvent extraction of the total fermentation broth of B. thailandensis followed by activity guided fractionation of the organic solvent soluble material has led to the isolation of a new antineoplastic compound having potent HDAC inhibitory activity, spiruchostatin C (2).
Results and Discussion
The ethyl acetate (EtOAc) extract of B. thailandensis was subjected to semi-preparative scale HPLC dereplication, a technique developed in our laboratory for identifying bioactive compounds in molecular-targeted screens.6, 7 2.5% of each of the 84 × 8 mL fractions was submitted for testing at a single dose in the NCI 60 primary anticancer screen.8, 9 Cytotoxic activity was found in multiple zones of the chromatogram, (see supporting information) including two well resolved components tentatively identified by UV and MS data as the known compounds PC-310 and YM-30059.11 An early eluting fraction also had cytotoxic activity, which upon LC/MS analysis, was shown to consist of a major component having MW 563. Careful analysis of the isotopic pattern of the MS spectrum suggested that the structure contained three sulfur atoms. High resolution mass spectrometry of 2 led to the molecular formula C23H37N3O3S3. The UV absorbance spectrum of 2 displayed a weakly discernible maximum at 270 nm, suggesting the absence of a conjugated π electron system. To obtain sufficient material for structure elucidation and for biological screening, a 20 L culture of B. thailandensis was undertaken, which yielded 12.4 mg of 2, a 0.12% yield from the EtOAc extract (10.29 g) or 0.62 mg/L from the bacterial broth.
The 1H NMR spectrum of 2 revealed a mixture of two compounds, occurring in a 55:45 ratio, that were inseparable on C18, silica, cyano, phenyl, and chiral HPLC columns. Raising the temperature of the NMR cryoprobe did not cause the two sets of peaks to merge, and so the data were interpreted and assigned for one component of the mixture. The 1H NMR spectrum of 2 showed 3 doublets for exchangeable protons (δH 8.88, 7.53, and 6.92 ppm, J = 2.0 Hz, 7.0 Hz, and 8.5 Hz, respectively) (Table 1). However, four ester/amide carbonyls were deduced by analysis of the HMBC (δC 172.1, 171.7, 170.9, 169.3 ppm). From these data, a sulfur-containing peptide containing three amino acid residues and an ester-linked fragment were considered the motif upon which the active structure was based.
Table 1.
NMR Spectroscopic Data (CDCl3 + d4-MeOH (9:1)) for Spiruchostatin C (2)
| position | δC,a type | δH (J in Hz) | HMBCb | |
|---|---|---|---|---|
| Met-sul.c | 1 | 170.9, C=O | 2, 3, NH, NH′ | |
| 2 | 55.8, CH | 4.15, m | 4 | |
| 3 | 24.5, CH2 | 2.33, m | 2, 4 | |
| 2.51, m | ||||
| 4 | 50.4, CH2 | 2.87, m | 2, 3, 5 | |
| 5 | 38.4, CH3 | 2.70, s | 4 | |
| NH | 8.88, br d | |||
| Cys | 1′ | 169.3, C=O | 2′, 3′, 4″, NH″ | |
| 2′ | 55.5, CH | 4.84, m | 3″ | |
| 3′ | 39.6, CH2 | 3.10, m | ||
| 3.28, m | ||||
| NH′ | 6.92, d (8.5) | |||
| Ahhpd | 1″ | 171.7, C=O | 2″, 3″ | |
| 2″ | 40.0, CH2 | 2.62, m | 3″, 4″ | |
| 2.70, m | ||||
| 3″ | 67.9, CH | 4.63, dt (9.4, 3.7) | 2″, 4″ | |
| 4″ | 61.6, CH | 3.00, ddd (9.4, 7.3, 5.5) | 3″, 5″, 6″, 8″ | |
| 5″ | 36.4, CH | 2.09, m | 3″, 4″, 6″, 7″ | |
| 6″ | 27.3, CH2 | 1.24, m | 4″, 5″, 7″, 8″ | |
| 1.56, m | ||||
| 7″ | 11.6, CH3 | 0.92, t (7.5) | 5″, 6″, 8″ | |
| 8″ | 15.4, CH3 | 0.93, d (7.0) | 4″, 5″, 6″ | |
| NH″ | 7.53, d (7.0) | |||
| OH″ | ||||
| Acyl | 1‴ | 172.1, C=O | 2, 2‴, NH | |
| 2‴ | 40.6, CH2 | 2.67, m | 4‴ | |
| 3.21, dd (12.5, 7.0) | ||||
| 3‴ | 71.2, CH | 5.52, br s | 2‴, 4‴ | |
| 4‴ | 130.5, CH | 5.89, d (15.0) | 2‴ | |
| 5‴ | 132.1, CH | 6.10, m | 2‴ | |
| 6‴ | 32.0, CH2 | 2.44, m | 4‴ | |
| 2.65, m | ||||
| 7‴ | 41.8, CH2 | 2.71, m | ||
| 3.39, m |
δC determined by 2D experiments
HMBC correlations, optimized for 8 Hz, are from proton(s) stated to the indicated carbon
Methionine sulfoxide
AHHP: 4-amino-3-hydroxy-5-methylheptanoic acid
The partial amino acid composition of 2 was deciphered by acid hydrolysis followed by HILIC HPLC of the hydrolysate. When compared to the retention times of twenty one of the most commonly found L amino acids, methionine was indicated, yet the NMR spectrum lacked the characteristic singlet at ~ δH 2.1 of the methionine methyl group. Rather, an HSQC correlation between δC 38.4 ppm and δH 2.70 (3H, s) suggested a methyl arising from a vicinal sulfoxide group. Under anoxic conditions, acid hydrolysis of peptides that contain methionine sulfoxide results in the release of methionine.12 The presence of methionine sulfoxide in 2 was later confirmed by HILIC chromatography of a standard, and its configuration assigned as D by FDAA derivatization followed by chromatographic retention time matching of the FDAA-derivatized D- and L-methionine standards. Sulfoxide functionalities have stable chiral centers that form enantiomeric pairs, which may explain the complexity of the NMR spectra of 2.
Since no other amino acids were readily identified in the hydrolysis mixture by HPLC analysis, and due to the complexity of the NMR data, other techniques were applied in the elucidation of 2. The possibility that 2 possessed structural homology with FK22813 (1) suggested that the unassigned sulfur atoms might originate from cysteine that had condensed to form a disulfide bridge. Addition of Ellman’s reagent to 2 did not produce a color change, indicating an absence of sulfhydryl groups. However, 2 tested positive for sulfhydryl when first treated with zinc catalyst, followed by addition of Ellman’s reagent. Cysteine is not detected by acid hydrolysis/FDAA derivatization unless the compound is first treated with performic acid to break the –S-S- linkage, resulting in the disulfhydryl form of the molecule. Acid hydrolysis then liberates cysteine as cysteic acid, which is then derivatized with the advanced Marfey’s reagent FDVA prior to HPLC determination.14 Using this indirect method, D-cysteine was detected in the hydrolysate. The sulfur bound β methylene carbon of cysteine (δC 39.6, δH 3.10, 3.28) was detected by a COSY correlation to H-2′, supporting the findings of the advanced Marfey’s analysis.
Substructures of 2 that were not decipherable by Marfey’s analysis were elucidated through the 1- and 2-D NMR data. The TOCSY spectrum showed two additional spin systems, one system including two sets of methylene protons δH 1.24/1.56 and δH 2.62/2.70, a methine bearing a carbinolic proton, δH 4.63, a methine proton δH 3.00, two methyl groups (δH 0.92 and 0.93), and one of the amide protons δH 7.53. COSY correlations revealed the sequence of this group of aliphatic hydrogens, and HMBC correlations from H-2″ and H-3″ to the C-1″ carbonyl established the structure of the fragment as 4-amino-3-hydroxy-5-methylheptanoic acid (AHHP). The second spin system consisted of three sets of methylene protons (δH 2.44/2.65, δH 2.67/3.21, and δH 2.71/3.39), a methine bound to a heteroatom (δH 5.52), and a disubstituted alkene (δH 5.89, 6.10). COSY correlations allowed for the assignment of the C-2‴ through C-6‴ fragment, while the C-7‴ sulfur-bound methylene group was oriented based on TOCSY correlations, also to C-2‴ through C-6‴. An HMBC correlation linked the H-2‴ methylene protons to the C-1‴ carbonyl, while the C-3‴ HSQC correlation to δH 5.52 suggested linkage to an oxygen or nitrogen heteroatom. Molecular weight considerations and the absence of a COSY signal between an amide proton and δH 5.52 confirmed the presence of the ester. The data indicated the structure of this acyl fragment as 3-hydroxy-7-thio-hept-4,5(E)-enoic acid (HTH).
The linkage of the four subunits of 2 was determined by analysis of HMBC (JC-H 8Hz) data (Figure 1). Each of the three amide protons had HMBC correlations to the carbonyl groups of adjacent fragments, thereby establishing the linkage of methionine sulfoxide to both cysteine and to the HTH fragment. Unfortunately, HMBC correlations were not seen between the C-3′ group of the cysteinyl across the disulfide bridge to the C-7‴ group of the HTH fragment or from the C-3‴ methylene protons of the HTH fragment to the C-1″ carbonyl of the AHHP subunit. However, the proton and carbon chemical shifts for the 3′, 3‴, and 7‴ positions are in agreement with those published for both natural15 and synthetic16 spiruchostatins A and B. FK228 (1) isolated from Chromobacterium violaceum, spiruchostatins isolated from a Pseudomonas sp., and this new compound are all bicyclic depsipeptides, with the name spiruchostatin C (2) chosen for the new compound because of its close structural similarity to spiruchostatin A.
Figure 1.

Key HMBC correlations for 2 optimized for 8 Hz.
In the isolation of 2, a minor peak was noted arising from a compound having a monoisotopic mass of 1126 amu, or twice the molecular weight of 2. This compound was isolated and subjected to acid hydrolysis followed by amino acid analysis. The ESI-MS chromatogram of the hydrolysate of the MW 1126 substance was essentially identical (Supporting Information) to the hydrolysate of 2, which suggested the formation of the larger species from two subunits of 2. Several experiments were tried to determine if the dimer had resulted from complexation with a metal ion. The LC/MS spectrum for this compound showed no other signals beyond the commonly occurring H+, NH4+, Na+, and K+ molecular ion adducts. Treatment of the substance with 3.4 mM EDTA failed to transform the sample, suggesting that a metal ion is not a component of the dimer. Interestingly, the circular dichroism spectra of 2 and the dimer are significantly different (Supporting Information), and the compounds might therefore be expected to possess different biological activity profiles, which proved not to be the case in the HDACi screen. It is likely that both 2 and its dimer undergo reductive transformation to the disulfhydryl monomer when inside the cell, similar to the behavior reported for FK228 prodrug.17
An advantage of the NCI 60 human tumor cell line screen8, 9 lies in its ability to identify selective toxicity towards different tumor cell types. Both 1 and 2 exert differential cytotoxicity both within and among cell panels. In the testing of 2, 44 of 57 (Supporting Information), dose response curves level off at the higher concentrations before the LC50 value is reached. The means of the total growth inhibition (TGI) and LC50 values across all 60 cell lines were 0.33 μM and 3.5 μM for 1 and 0.83 μM and 7.7 μM for 2, indicating greater overall cytotoxic activity of 1. However, when the TGI values for each cell line are examined individually, 2 shows at least two fold greater relative potency over 1 towards 13 cell lines (Table 2). The lower LC50 values towards COLO 205 (0.015 μM), U251 (0.037 μM), and A498 (0.055 μM) indicate these cell lines are highly susceptible to 2, and should be targeted for further development of the compound.
Table 2.
Comparative Analysis of the NCI 60 Data for Compounds 1 and 2.
| Cell Panel | Cell Line | TGI (μM) | LC50 (μM) | ||||
|---|---|---|---|---|---|---|---|
| FK228 (1) | Spir. C (2) | TGI ratioa | FK228 (1) | Spir. C (2) | LC50 ratiob | ||
| Renal | UO-31 | 1.55 | 0.32 | 4.9 | |||
| Renal | ACHN | 0.73 | 0.18 | 4.0 | 5.37 | ||
| Breast | MDA-MB-468 | 0.090 | 0.023 | 3.9 | 4.14 | ||
| Renal | RXF 393 | 0.062 | 0.016 | 3.8 | 0.30 | 0.17 | 1.8 |
| Colon | COLO 205 | 0.031 | 0.008 | 3.8 | 0.092 | 0.015 | 6.0 |
| Melanoma | UACC-257 | 0.095 | 0.033 | 2.9 | 5.46 | ||
| CNS | U251 | 0.031 | 0.012 | 2.7 | 0.13 | 0.037 | 3.6 |
| Breast | MDA-MB-231/ATCC | 0.35 | 0.15 | 2.4 | 4.08 | ||
| Renal | A498 | 0.028 | 0.012 | 2.4 | 0.20 | 0.055 | 3.6 |
| CNS | SF-295 | 0.25 | 0.11 | 2.3 | 10.2 | ||
| Non-Small Cell Lung | NCI-H322M | 0.23 | 0.10 | 2.3 | 9.02 | ||
| Renal | CAKI-1 | 1.89 | 0.88 | 2.1 | 20.9 | ||
| Renal | SN12C | 0.34 | 0.16 | 2.1 | 1.50 | ||
TGI ratio = TGI(1)/TGI(2)
LC50 ratio = LC50(1)/LC50(2)
Structural homology among FK228 (1) and the B. thailandensis isolates prompted further biological testing in an HDAC inhibitory screen. Against class I HDACs, both compound 2 and its dimer showed greater inhibition towards both HDAC1 and HDAC8, as compared to 1 (Figure 2). When tested against the class II type HDAC4, 2 and its dimer exhibited greater inhibition than 1. Down-regulation of HDAC4 expression in HCT116 cells has been linked to reduced cell growth and increased apoptosis in vitro, and to a reduction in growth of xenograft tissue.18 Both 1 and 2 showed equal activity towards HCT116 cells in the NCI 60, so a direct correlation between the HDACi results and the NCI 60 screening results cannot be made from the existing data. Overall, the data indicates lesser selectivity of 2 towards class I and II HDACs yet greater potency of 2 over the FDA approved compound 1.
Figure 2.

HDAC Inhibition Assay Results
Spiruchostatin C was assayed side-by-side with FK228 in an in vivo murine hollow fiber assay. Neither compound produced T/C values of less than 50% when tumors were implanted subcutaneously (Supporting Information), yet when implantation was intraperitoneal, FK228 showed superior antitumor activity overall, with lower T/C values in 23 of the 24 cell lines that were tested. No further in vivo assays were conducted on 2 as the results suggested that the new compound would likely provide no therapeutic advantage over the currently used clinical compound.
Experimental Section
General Experimental Procedures
Optical rotation was determined with a Perkin Elmer 241 polarimeter. UV spectra were acquired on a Waters 2996 photodiodearray detector (Perkin Elmer). CD spectra were acquired with a Jasco CD-1595 circular dichroism chiral detector. NMR spectra were recorded with a Varian 500 MHz INOVA spectrometer in CDCl3/CD3OD with TMS as internal standard. High resolution mass spectra were obtained with a Waters LCT Premier TOF mass spectrometer. HPLC-MS equipment consisted of a Waters 600 pump, a Waters ZQ electrospray mass spectrometer, a Waters 2996 photodiodearray spectrometer and a Sedex 75 evaporative laser light scattering detector. C18 HPLC was used to fractionate crude organic extracts in the initial dereplication experiment. Scale-up purification was accomplished on Sephadex LH-20 (Pharmacia) and Microsorb C18 bonded-phase HPLC columns (Varian). Analytical HPLC was performed using an Xterra C18 HPLC column (Waters).
Organism
Burkholderia thailandensis, strain E264, was purchased from the American Type Culture Collection (ATCC), number 700388, and maintained on nutrient agar at room temperature.
Fermentation
A seed culture medium consisting of glucose, 10 g/L and meat extract, 20 g/L was sterilized in 500 ml Erlenmeyer flasks at 120 °C for 15 min. Nutrient agar plugs were inoculated into each flask. The flasks were incubated for 24 h at 26.5 °C on a rotary shaker (200 rpm). The resultant seed culture was used to inoculate the production medium consisting of glucose, 10 g/L; meat extract (BD Difco, #212610), 15 g/L; monopotassium phosphate, 11 g/L; disodium phosphate, 7.2 g/L; ammonium sulfate, 1 g/L; magnesium sulfate, 0.06 g/L; and DL phenylalanine; 0.5 g/L in 1 L Erlenmeyer flasks sterilized at 120 °C for 15 min. Fermentation was carried out for 6 days at 26.5 °C, with an initial pH of 6.0. Upon harvest, the pH had increased to 7.0, and the broth appeared brown with moderate foam.
Extraction
The total fermentation broth was homogenized with an Omni Macro Homogenizer, and then partitioned against an equal volume of EtOAc. Centrifugation at 5000 RPM facilitated the separation of the aqueous and organic layers. The EtOAc was removed by rotary evaporation and dried, resulting in 0.91 g of crude extract.
HPLC Dereplication
The EtOAc extract was subjected to dereplication analysis by the preparative C18 LC/MS method described in previous publications,6, 7 with 84 HPLC fractions tested in the NCI 60. Multiple zones of toxicity were identified within the chromatographic space.
Isolation of the Bioactive Compounds
The EtOAc extract was partitioned between 1 L hexane and 1 L MeOH-H2O (9:1). After removal of the hexane soluble material (89 mg), H2O was added to the methanolic layer, bringing the amount of H2O to 66%. This solution was then partitioned against MeTertButylEther (MeOtBE), yielding 300 mg of MeOH (aq) solubles and 452 mg of MeOtBE solubles. The methanolic soluble material was loaded onto a 100 cm × 2.5 cm bed of Sephadex LH-20 and eluted over 13 h with 1.5 mL/min MeOH. The fraction enriched in 2 was then purified on a C8 semi-preparative HPLC column eluted with a MeCN-H2O gradient; 0–5 min = (3:7), 45–60 min = (1:1), flow rate = 10 mL/min.
Sulfhydryl Detection with Ellman’s Reagent
A 4 mg/mL stock solution of Ellman’s Reagent (Pierce) was made in a reaction buffer containing 0.1 M Na3PO4 (aq) pH 8 and 1 mM EDTA. A positive control solution containing 0.1 mM DL cysteine turned bright yellow upon addition of the Ellman’s stock solution. Compound 2 was assayed both prior to and after reduction with zinc dust.19 To reduce the disulfide bridge, 10μg of 2 was dissolved in 0.2 mL MeCN-H2O (1:1) containing 1% trifluoroacetic acid. To this solution, 60 mg of zinc dust was added and the mixture incubated at room temperature for 10 min, after which the supernatant liquid was added to the Ellman’s Reagent.
Oxidation, Hydrolysis, and Amino Acid Analysis
Oxidation of samples was required prior to acid hydrolysis in order to cleave the disulfide bridge of 2. A 0.2 mg portion of each sample was treated with formic acid/H2O2 mixture. A 0.1 mg aliquot of each oxidized compound was transferred in MeOH to a hydrolysis tube, with removal of the solvent under a stream of nitrogen gas. Each sample was dissolved in 0.5 mL 6N HCl (aq), degassed and sealed under vacuum. The samples were then incubated at 110 °C in an oil bath for 18 h, after which time solvent was blown off under a stream of nitrogen gas. The samples were redissolved in MeOH, transferred from the hydrolysis tube to a tared 8 mL vial, and dried again under nitrogen to aid in the evaporation of residual HCl. Each hydrolysate was dissolved in MeOH @ 0.5 mg/mL and analyzed by HILIC HPLC with a MeCN-H2O-0.1% GAA mobile phase gradient, 0–5 min = (4:1), 30 min = (1:1), 0.7 mL/min. Identification of amino acids in the hydrolysates was determined by comparison of retention time and mass spectra to that of a standard amino acid mixture (Sigma #9416).
Determination of Configuration by Marfey’s Analysis
The hydrolysate of 2 and the amino acid standards L-Met, D/L-Met, L-Met sulfoxide, D/L-Met sulfoxide, L-Cys, D/L-Cys, L-Cysteic acid, D/L-Cysteic acid were dissolved in MeOH/H2O (4:1, @ 1 mg/mL) and transferred (25 μL) into separate HPLC autosampler vials. All traces of solvent were removed under vacuum. To each sample was added 15 μL of 6% TEA and 7.5 of μL FDAA (Marfey’s Reagent, Pierce). The samples were heated at 40 °C for 1 h and then diluted 10 fold with MeCN-H2O (1:1) prior to C18 HPLC analysis with CH3CN/5% aq HOAc (1:9 to 1:1). During acid hydrolysis cysteine is converted to cysteic acid, whose FDAA derivative is poorly retained during C18 analysis. When FDVA (Advanced Marfeys Reagent, Pierce) was used to derivatize the hydrolysis mixture and amino acid standards, retention and identification became possible. Experimental conditions and solvents were identical to those used in the FDAA procedure.
Spiruchostatin C (NSC 754830) (2)
white powder; UV (MeOH) end absorbance; CD (MeOH) λmax (Δε) 203 (−86), 211 (−73), 241 (+11) nm; 1H and 13C NMR data, see Table 1; HRESIMS m/z 564.1875 [M + H]+ (calcd for C23H38N3O7S3, 564.1872).
NCI 60 Human Tumor Cell Line Screen
HDAC Inhibition Screen
Cell-free human histone deacetylase inhibition assays were performed by Reaction Biology, Inc. http://www.reactionbiology.com/. Human HDAC1 (GenBank Accession No. NM_004964), Human HDAC4 (GenBank Accession No. NM_006037), and Human HDAC8 (GenBank Accession No. NM018486) were employed in these assays. Fluorogenic peptides derived from p53 residues 379–382 were used as substrates for assaying HDAC inhibition. Specifically, RHKKAc was used for assaying HDAC1 and 8 inhibition, and RHKAcKAc for HDAC4. Compounds 1 and 2 were tested at 10 doses in duplicate with 3-fold serial dilution starting at 20 μM. The assay was conducted in two steps. First, the fluorogenic substrate with acetylated lysine side chain was incubated with compound 1 or 2 to produce deacetylated substrate. The reaction mixture was then digested by a proprietary developing mixture to produce the fluorescent signal measured at 360 nm excitation and 460 emission wavelengths, which is proportional to the amount of deacetylated substrate.
Murine Hollow Fiber Assays
The in vivo cultivation of tumor cells in hollow fibers has previously been described.20, 21 In brief, a standard panel of 12 human tumor cell lines is encapsulated within polyvinylidene fluoride hollow fibers having a molecular weight exclusion of 500,000 Da. A total of 3 different tumor lines are prepared for each experiment so that each mouse receives 3 intraperitoneal implants (1 of each tumor line) and 3 subcutaneous implants (1 of each tumor line). On the day of implantation, samples of each tumor cell line preparation are quantitated for viable cell number by a stable endpoint MTT assay so that the time zero cell mass is known. Drugs were administered IP at both 2.4 mg/kg/dose and at 1.6 mg/kg/dose on days 1–4. These doses were selected based on previous studies with FK228, which exhibited antitumor activity at these doses. The fibers were retrieved and viable cell mass determined on day 5. T/C values were calculated against control animals that received injections of vehicle only.
Supplementary Material
Acknowledgments
This project has been funded in whole or in part with federal funds from the National Cancer Institute, National Institutes of Health, under contract HHSN261200800001E. The content of this publication does not necessarily reflect the views or policies of the Department of Health and Human Services, nor does mention of trade names, commercial products, or organizations imply endorsement by the U.S. government. This research was supported [in part] by the Developmental Therapeutics Program in the Division of Cancer Treatment and Diagnosis of the National Cancer Institute. We gratefully acknowledge Q. Van for NMR experiments, the NCI 60 team for in vitro biological assay results, M. Hollingshead, M. Ahalt-Gottholm, and V. Brinsfield for the murine hollow fiber assay results, and J. Britt for robotics and computer support.
Footnotes
Supporting Information Available: A fractionation tree diagram, 1- and 2-D NMR spectra of 2, and in vitro and in vivo test results for 2, are available free of charge at http://
References and Notes
- 1.Bieliauskas AV, Pflum MKH. Chem Soc Rev. 2008;37:1402–1413. doi: 10.1039/b703830p. [DOI] [PMC free article] [PubMed] [Google Scholar]
- 2.Yoshida M, Furumai R, Nshiyama M, Komatsu Y, Nishino N, Horinouchi S. Cancer Chemother Pharmacol. 2001;48:S20–S26. doi: 10.1007/s002800100300. [DOI] [PubMed] [Google Scholar]
- 3.Minucci S, Pelicci PG. Nat Rev Cancer. 2006;6:38–51. doi: 10.1038/nrc1779. [DOI] [PubMed] [Google Scholar]
- 4.VanderMolen KM, McCulloch W, Pearce CJ, Oberlies NH. J Antibiot. 2011;64:525–531. doi: 10.1038/ja.2011.35. [DOI] [PMC free article] [PubMed] [Google Scholar]
- 5.Wang C, Henkes LM, Doughty LB, He M, Wang D, Meyer-Almes F-J, Cheng Y-Q. J Nat Prod. 2011 doi: 10.1021/np200324x. Articles ASAP. [DOI] [PMC free article] [PubMed] [Google Scholar]
- 6.Klausmeyer P, McCloud TG, Scudiero DA, Melillo G, Cardellina JH, II, Shoemaker RH. Planta Med. 2007;73:49–52. doi: 10.1055/s-2006-951767. [DOI] [PubMed] [Google Scholar]
- 7.Klausmeyer P, McCloud TG, Uranchimeg B, Melillo G, Scudiero DA, Cardellina JH, II, Shoemaker RH. Planta Med. 2008;74:258–263. doi: 10.1055/s-2008-1034315. [DOI] [PubMed] [Google Scholar]
- 8.Scudiero DA, Shoemaker RH, Paul KD, Monks A, Tierney S, Nofziger TH, Currens MJ, Seniff D, Boyd MR. Cancer Res. 1988;48:4827–4833. [PubMed] [Google Scholar]
- 9.Shoemaker RH. Nat Rev Cancer. 2006;6:813–823. doi: 10.1038/nrc1951. [DOI] [PubMed] [Google Scholar]
- 10.Moon SS, Kang PM, Park KS, Kim CH. Phytochemistry. 1996;42:365–368. [Google Scholar]
- 11.Kamigiri K, Tokunaga T, Shibazaki M, Setiawan B, Rantiatmodjo RM, Morioka M, Suzuki K. J Antibiot. 1996;49:823–825. doi: 10.7164/antibiotics.49.823. [DOI] [PubMed] [Google Scholar]
- 12.Takahashi K. J Biochem. 1973;74:1083–1089. doi: 10.1093/oxfordjournals.jbchem.a130335. [DOI] [PubMed] [Google Scholar]
- 13.Shigematsu N, Ueda H, Takase S, Tanaka H. J Antibiotics. 1994;47:311–314. doi: 10.7164/antibiotics.47.311. [DOI] [PubMed] [Google Scholar]
- 14.Szabó S, Szókán G, Khlafulla AM, Almás M, Kiss C, Rill A, Schön I. J Pept Sci. 2001;7:316–322. doi: 10.1002/psc.325. [DOI] [PubMed] [Google Scholar]
- 15.Masuokaa Y, Nagaia A, Shin-yaa K, Furihatab K, Nagaic K, Suzukic K, Hayakawaa Y, Seto H. Tetrahedron Lett. 2001;42:41–44. [Google Scholar]
- 16.Narita K, Kikuchi T, Watanabe K, Takizawa T, Oguchi T, Kudo K, Matsuhara K, Abe H, Yamori T, Yoshida M, Katoh T. Chem Eur J. 2009;15:11174–11186. doi: 10.1002/chem.200901552. [DOI] [PubMed] [Google Scholar]
- 17.Furumai R, Matsuyama A, Kobashi N, Lee K-H, Nishiyama M, Nakajima H, Tanaka A, Komatsu Y, Nishino N, Yoshida M, Horinouchi S. Cancer Res. 2002;62:4916–4921. [PubMed] [Google Scholar]
- 18.Wilson AJ, Byun D-S, Nasser S, Murray LB, Ayyanar K, Arango D, Figueroa M, Melnick A, Kao GD, Augenlicht LH, Mariadason JM. MBoC. 2008;19:4062–4075. doi: 10.1091/mbc.E08-02-0139. [DOI] [PMC free article] [PubMed] [Google Scholar]
- 19.Erlandsson M, Hallbrink M. Int J Pept Res Ther. 2005;11:261–265. [Google Scholar]
- 20.Hollingshead MG, Alley MC, Camalier RF, Abbott BJ, Mayo JG, Malspeis L, Grever MR. Life Sci. 1995;57:131–141. doi: 10.1016/0024-3205(95)00254-4. [DOI] [PubMed] [Google Scholar]
- 21.http://dtp.nci.nih.gov/branches/btb/hfa.html
Associated Data
This section collects any data citations, data availability statements, or supplementary materials included in this article.