Abstract
The main water-soluble carbohydrates in temperate forage grasses are polymeric fructans. Fructans consist of fructose chains of various chain lengths attached to sucrose as a core molecule. In grasses, fructans are a complex mixture of a large number of isomeric oligomers with a degree of polymerisation ranging from 3 to >100. Accurate monitoring and unambiguous peak identification requires chromatographic separation coupled to mass spectrometry. The mass range of ion trap mass spectrometers is limited, and we show here how monitoring selected multiply charged ions can be used for the detection and quantification of individual isomers and oligomers of high mass, particularly those of high degree of polymerization (DP > 20) in complex plant extracts. Previously reported methods using linear ion traps with low mass resolution have been shown to be useful for the detection of fructans with a DP up to 49. Here, we report a method using high-resolution mass spectrometry (MS) using an Exactive Orbitrap MS which greatly improves the signal-to-noise ratio and allows the detection of fructans up to DP = 100. High-sugar (HS) Lolium perenne cultivars with high concentrations of these fructans have been shown to be of benefit to the pastoral agricultural industry because they improve rumen nitrogen use efficiency and reduce nitrous oxide emissions from pastures. We demonstrate with our method that these HS grasses not only contain increased amounts of fructans in leaf blades but also accumulate fructans with much higher DP compared to cultivars with normal sugar levels.
Electronic supplementary material
The online version of this article (doi:10.1007/s00216-011-5374-8) contains supplementary material, which is available to authorized users.
Keywords: Fructan, Porous graphitic carbon, High resolution, Degree of polymerization, High-sugar grasses
Introduction
Fructans are polymers of fructose attached to a sucrose core [1]; unlike starches, they are water-soluble, are a readily mobilised energy source for plants and are thought to act as the primary energy reserve [2]. Fructans have been reported in a wide range of plant species, including dicotyledons such as Helianthus tuberosus (Jerusalem artichoke) and Cichorium intybus (chicory), and monocotyledons such as Allium cepa (onion) and Lolium perenne (ryegrass) [3].
Chicory, in common with most other dicotyledons, produces fructans that belong to the inulin series comprising linear β2-1 chains of fructose with a terminal glucose. The commonly accepted biosynthetic pathway for these fructans proposes two enzymes: a sucrose, sucrose fructosyltransferase for the biosynthesis of 1-kestose from sucrose, and a fructan, fructose fructosyltransferase for chain elongation [4]. However, in monocots, fructans are more complex and are based on multiple isomers (basic trimers: 1-kestose, 6-kestose, 6G-kestose) with β2-1, β2-6 and mixed linkages. Several additional fructosyltransferases producing these isomers have been characterised from monocots [5] including wheat, barley and ryegrass.
Recently, forage ryegrass cultivars with high levels of fructans in leaf blades, the plant part harvested by grazing ruminants, have been introduced into pastures. It has been shown that the high carbohydrate content in the grazed diet results in an improved nitrogen use efficiency of ruminants, which can result in improved milk and meat production and reduced nitrous oxide emissions from urine patches in pastures [6, 7]. Major breeding efforts are underway to develop ryegrass cultivars for use as forage with even higher fructan contents, but the rapid and accurate monitoring of fructan profiles is currently hampered by the lack of suitable analytical techniques.
A range of methods using chromatographic separation have been developed in the past [8–11], but usually, these methods require long run times (>50 min) and are not suitable for high-throughput screening and analysis of a large number of plant samples. Currently, the most common separation technique used for the analysis of fructans is high-performance anion exchange chromatography (HPAEC), which has become the accepted standard technique for the separation of oligosaccharides, including fructans. Usually, the detection method of choice when analysing fructans by HPAEC is pulsed amperometric detection [9]. However, unambiguous peak identification can be difficult if it is based on the retention time only. Coupling HPAEC with mass spectrometry (MS) is problematic as the high concentrations of inorganic bases in the mobile phase can cause blocking of the MS source capillary. A way around this is electrochemical desalting [10, 11] similar to that used in ion chromatography. However, the added complexity and the expense of these systems reduce their applicability. An alternative approach has been developed by Antonio et al. and Robinson et al. [8, 12] who used porous graphitic carbon HPLC coupled with negative ion electrospray ionisation mass spectrometry for the analysis of water-soluble carbohydrates from Lupinus albus and Triticum aestivum. These authors reported the analysis of fructans up to degree of polymerization (DP) = 20, and we have previously reported the extension of this method for the analysis of fructans in crude ryegrass extracts of up to DP = 49 with run times <20 min per sample [13]. However, these previous methods used linear ion traps, which have a limited mass range and low resolution and so are not suitable for the monitoring of larger fructans with DP > 50. Here, we report the application of a high-resolution mass spectrometry using an Exactive Orbitrap to distinguish and monitor multiply charged ions, which greatly improves our ability to monitor fructans up to DP = 100.
Materials and method
Plant material and sample preparation
Method development was performed with perennial ryegrass (L. perenne L. var. Extreme) plants grown outdoors at AgResearch Grasslands (Palmerston North, NZ) during the 2009 season; total tillers were harvested, flash-frozen in liquid nitrogen, freeze-dried and ground. Plant material (50 g) was placed in a 250-ml round bottom flask with 100 ml of MilliQ® water and boiled under reflux for 45 min. After cooling, extracts were filtered through sinter glass funnels covered with deactivated glass wool to prevent clogging, using reduced pressure. Filtrates were transferred into glass vials and analysed without further manipulation.
To analyse fructan size distribution in the L. perenne high-sugar cultivar Expo and the normal sugar cultivar Fennema, plants (ten genotypes each) were grown in controlled environment chambers to induce high levels of fructans in blades as described [14].
HPLC conditions
Filtrates (5 μl) were injected using a HTS PAL autosampler with a 25-μl syringe and a 15,000-psi injection valve (CTC Analytics AG., Zwingen, Switzerland). An Accela quaternary UHPLC pump (Thermo Fisher Scientific, Waltham, MA, USA) was used, pumping MilliQ® water (solvent A) and LiChroSolv (HPLC) grade acetonitrile (Merck, Palmerston North, New Zealand) (solvent B). Oligosaccharides were separated on a Thermo Hypercarb column (100 × 2.1 mm, 5-μm particle size; Thermo Fisher Scientific), running the following programme at a flow rate of 0.4 ml/min: initial 1% B hold for 0.5 min, to 10% B after 1 min, to 16% B at 6 min, to 20% B at 12 min, to 30% B at 16 min, to 90% B at 18 min, hold to 20 min, and return to initial conditions for 5-min equilibration.
MS analysis
Mass spectrometric analysis was performed using an Exactive Orbitrap mass spectrometer (Thermo Fisher Scientific) with electrospray ionisation in negative mode. Data were collected in profile data acquisition mode over the mass range 300–4,000 and at 10,000, 25,000, 50,000 and 100,000 resolution settings. The data were processed using the Xcalibur software package provided by the manufacturer. Monoistopic masses for DP = 1–165 at charge states from −1 to −6 have been calculated and are shown in Electronic supplementary material (ESM) Table S1. Isotopic distributions for DP = 1, 10, 20, 30, 40, 50, 60, 70, 80 and 90 were calculated using IDCalc [15] and are presented in ESM Table S2.
Results and discussion
Monitoring of multiply charged ions
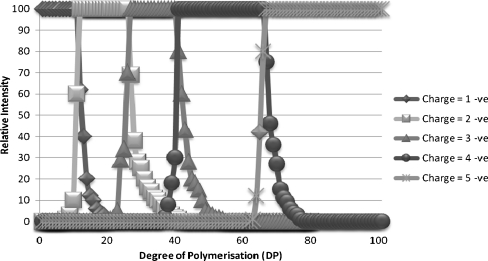
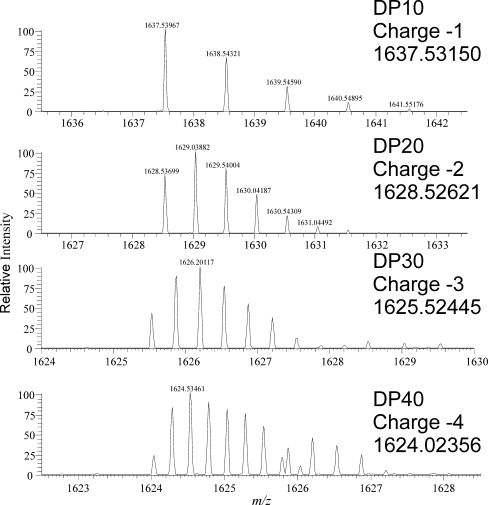
In the majority of reports in the literature, the positive ion mode is used for the analysis of oligosaccharides by MS as the sensitivity of positive ionisation was found to be greater when analysing authentic standards. However, we have found when analysing crude extracts that the selectivity of the negative ion mode gave a far better sensitivity and therefore lower detection limits. As the masses of the fructans DP > 24 (monoisotopic mass of 3,906.27) are outside of the ion mass range of the mass spectrometer, an increase of its effective mass range is required to monitor larger fructans. This can be achieved by analysing multiply charged ions. Each high DP oligomer can theoretically give rise to multiple charge states, which would make the quantification of individual oligomers difficult. We therefore examined the distribution of charge states for oligomers ranging in DP from 2 to 100 (Fig. 1). For the majority of the oligomers examined, each oligomer had a predominant m/z (mass-to-charge) ion, oligomers of DP = 3–10 were singly charged, DP = 11–24 doubly charged, DP = 24–40 triply charged whilst DP = 80–100 were quadruply charged. We propose therefore that with the choice of an appropriate single mass-to-charge ratio within each DP range, it is possible to monitor for a wide range of fructan oligomers. The monoisotopic m/z value for a fructan with a given degree of polymerisation can be calculated (ESM Table S1), and an extracted ion chromatogram can then be generated with a mass window of ±0.5 Da. The isotopic distribution of the ions can be calculated (ESM Table S2) and the predominant ion for a high-DP fructan need not be the monoisotopic ion. Peaks in the extracted ion chromatogram can be characterised by examining the mass spectrum at the peak retention time to determine the spacing of isotope peaks. With ions carrying more than a single charge, the spacing of the isotope peaks is reduced by a factor of 1/(charge state) compared with that for the singly charged ion (Fig. 2). Thus, providing the resolution is sufficient to resolve the isotope peaks, the charge state of the detected ion, and hence the mass of the ion detected, can be determined from the measured m/z for the predominant ion in the peak and the ∆m/z difference between the isotope peaks (charge state = 1.003/∆m/z; ion mass = m/z × charge state). The presence of ions of the next or preceding oligomer can also help confirm the assignment of the charge state. For two sequential oligomers of the same charge state differing by ∆m/z, the charge state is approximately equal to 162/∆m/z. This technique is less reliable than using the ∆m/z of the isotope peaks, but can potentially be applied at high charge states where the isotope peaks are poorly resolved.
Fig. 1.
Charge state distribution vs. degree of polymerisation of fructans in ryegrass extracts analysed by electrospray ionisation in negative mode in an Orbitrap MS: singly charged (dark diamonds), doubly charged (light squares), triply charged (mid-grey triangles), quadruply charged (dark circles), five charges (light stars)
Fig. 2.
Profile spectra for ions of fructan oligomers with m/z of approximately 1,630. Each trace is labelled with the degree of polymerisation (DP), the charge state and the monoisotopic mass. As the charge state increases, the spacing of the isotope peaks decreases
Effect of resolution and mass accuracy
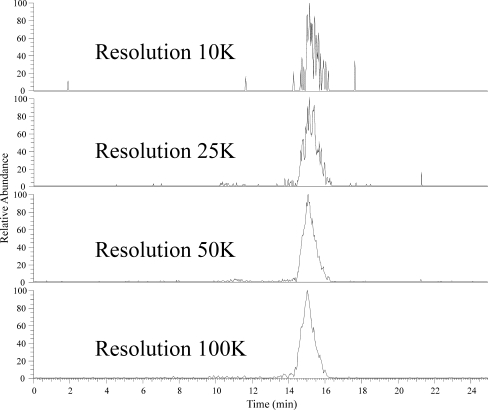
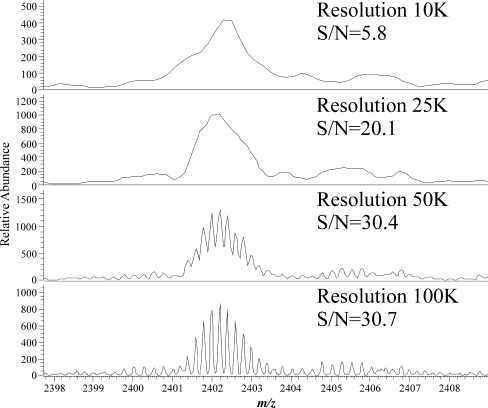
Multiple injections of the same sample were carried out at the four possible resolution settings of the Exactive Orbitrap used in this study. An extracted ion trace for a fructan oligomer with a charge state of −5 and a molecular weight in excess of 12,000 Da (DP = 74) at the different resolution settings (Fig. 3) shows that increasing the resolution improves the peak quality. The signal-to-noise ratios for the oligomer with DP = 74 shows a significant improvement as the resolution is increased to 50,000, with little further improvement with increasing the resolution to 100,000. Mass accuracy, when coupled with high resolution, allows the precise measurement of the isotope peaks. The observed improvement in the chromatographic peak shape results from a reduction in the noise level on the chromatographic peak as well as an increase in the definition of the isotopologue mass peaks within the mass spectrum (Fig. 4). The mass spectra for this oligomer at the various resolutions show the expected increase in mass peak definition, resulting in an improved mass accuracy and, hence, an increase in the signal-to-noise ratio. Thus, with higher resolution, larger oligomers can be detected from the background noise. Resolution by definition is the measured m/z divided by the measured m/z difference; thus, for high-DP fructans detected in higher charge states, the resolution needed increases as the m/z differences between isotopologue peaks decrease (above and ESM Table S2). The calculated minimum resolution required to separate isotope peaks for singly charged DP = 10 is 1,638, doubly charged DP = 20 is 3,257, triply charged DP = 30 is 4,879 and quadruply charged DP = 40 is 6,496 (Fig. 2); for DP = 74 (Fig. 4), a resolution of 100 K is required. High resolution coupled with mass accuracy, as provided by the Exactive Orbitrap MS used in this study, enables ions produced by the ionisation of fructan polymers to be separated from signals from other components in the extract as well as from background noise.
Fig. 3.
Extracted ion chromatograms showing peak qualities for a multiply charged fructan ion of DP = 74 with m/z 2,402.24 ± 0.024 (10 ppm) at resolutions of 10,000, 25,000, 50,000 and 100,000. The definition of the chromatographic peak improves greatly as the resolution increases
Fig. 4.
Profile spectra of DP = 74 at resolutions of 10,000, 25,000, 50,000 and 100,000 with the measured signal-to-noise value. The definition of the isotope peaks improves as the resolution increases
Detection range and accuracy
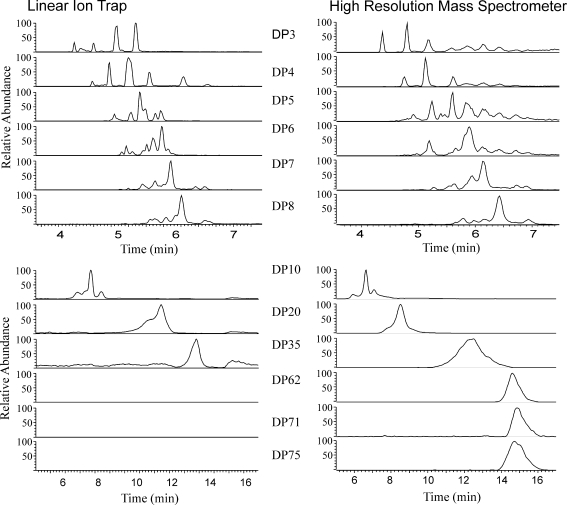
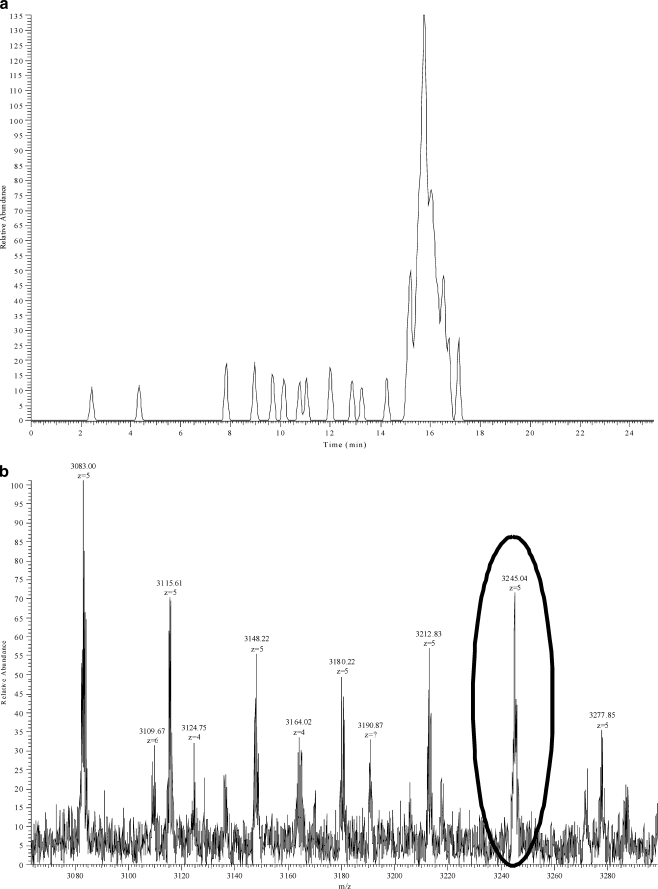
Polymerisation of sugars to form molecules such as fructans has been suggested as one mechanism for osmoregulation [16], as well as having a significant effect on the nutritional value of forage grasses [17]; thus, as complete a knowledge of the fructan profile as possible is highly desirable for investigations of these areas. Comparison of extracts of the same samples analysed by this technique and the ion trap-based technique [13] shows the results to be comparable at low DPs, but at high DPs, the technique described here can detect fructans that cannot be seen using a linear ion trap MS. Thus, whilst discrete chromatographic peaks can be resolved with a low-resolution linear ion trap MS up to a modest DP = 49 [13], a high-resolution Orbitrap MS allows the resolution of much higher DP fructans (Fig. 5), extending up to DP = 100 (detected at a charge state of −5; Fig. 6). The signal-to-noise ratio in the trace for DP = 100 (Fig. 6, upper panel) is approximately 7:1, which makes it suitable for quantification. The mass profile at the retention time for this peak (Fig. 6, lower panel) demonstrates that there are larger fructan species present. However, for DP = 115 detected at a charge state of −6 in crude ryegrass extracts (m/z 3,109.67 in Fig. 6), the signal-to-noise ratio was 3, which is too low for quantification. In the absence of authentic standards of individual high-DP fructan oligomers, direct measurements of accuracy have not been possible. However, the precision of the method appears adequate as examination of the five replicate sequential injections showed the method to have a coefficient of variance below 5%; the linearity also appears satisfactory as serial dilutions of a crude ryegrass extract showed no evidence of ion suppression occurring.
Fig. 5.
Extracted ion chromatograms for DP = 3, 4, 5, 6, 7, 8, 10, 20, 35, 62,71 and 75 showing the peaks obtained by the analysis of extracts of the same sample using either an ion trap (left) at unit resolution or the Exactive Orbitrap (right) at 100 K resolution. The traces are similar in the lower DP fructans, as would be expected. However, the larger DP fructans were not detectable using the ion trap
Fig. 6.
a Extracted ion chromatogram of a high-sugar grass ryegrass extract for a multiply charged ion from fructan of DP = 100, with a m/z 3,245.05 ± 0.032 (10 ppm) at 100 K resolution. The signal-to-noise ratio is approximately 7:1. b Mass profile at the retention time of 16 min with the ion from DP = 100 highlighted within the oval. The presence of larger fructans can be seen at a higher mass-to-charge ratio
Analysis of different ryegrass cultivars for high-DP oligomers
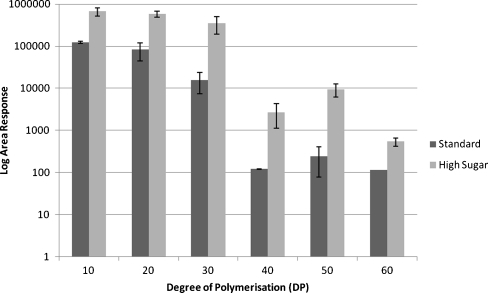
Extracts of blades from a HS cultivar (Expo) were shown previously to contain approximately twice as much total fructans compared with a standard cultivar (Fennema) grown and harvested under the same conditions [14]. Using the Orbitrap MS method developed here, we have demonstrated that the HS grass has significantly higher levels of large fructans compared with the standard cultivar (Fig. 7). In Fennema samples, fructan polymers with a DP > 30 were almost undetectable, whilst the high-sugar grass variety accumulated fructan polymers of up to DP = 60. Thus, the HS cultivar accumulated more than seven times the level of DP = 40 than the standard line. These results show that high-sugar grasses differ not only in their total amounts of fructans in blades but also in their size distribution compared with standard cultivars. A recent study identified a fructosyltransferase from Phleum pratense (timothy grass) which was shown to catalyse the synthesis of highly polymerised fructans [18]. It would be interesting to see if a comparable enzyme is present in L. perenne and differentially expressed in HS grass blades, leading to the accumulation of high levels of high-DP fructans in these cultivars.
Fig. 7.
Distribution of high-DP fructans in blade extracts from L. perenne cultivars with contrasting total sugar content, with measured areas displayed on a log10 scale. Extracts were chromatographically separated and analysed by electrospray ionisation in negative mode with an Orbitrap MS. Dark grey bars depict a standard (Fennema) and light grey bars a high-sugar cultivar (Expo). Significantly higher levels of high-DP fructans are present in Expo than in Fennema
Conclusion
The development of a method using the high-resolution and mass accuracy features of an Exactive Orbitrap MS enabling the monitoring of multiply charged ions extends the range of fructan oligomers that can be routinely analysed up to DP = 100, which is well beyond the fructan DP range commonly reported in studies using either HPAEC or ion trap MS-based methodology. Two additional major advantages of the MS method described in this study compared with the commonly used techniques for fructan analysis are the much shorter run times and the ability to determine the m/z ratio and the charge state of the ions, which improves oligomer identification significantly. Our finding that HS cultivars of the forage grass L. perenne accumulate particularly very high-DP fructans when compared with standard cultivars indicates that selection and breeding of lines with even higher sugar levels than found in current HS cultivars might be accelerated using this high-throughput method for the screening of a large number of genotypes.
Electronic supplementary material
Below is the link to the electronic supplementary material.
Acknowledgements
This work was partially funded by the Foundation for Research, Science and Technology NZ (FRST NZ) grant C10X0815.
Open Access
This article is distributed under the terms of the Creative Commons Attribution Noncommercial License which permits any noncommercial use, distribution, and reproduction in any medium, provided the original author(s) and source are credited.
References
- 1.Lewis DH. Nomenclature and diagrammatic representation of oligomeric fructans—a paper for discussion. New Phytol. 1993;124:583–594. doi: 10.1111/j.1469-8137.1993.tb03848.x. [DOI] [PubMed] [Google Scholar]
- 2.Chalmers J, Lidgett A, Cummings N, Cao Y, Forster J, Spangenberg G. Molecular genetics of fructan metabolism in perennial ryegrass. Plant Biotechnol J. 2005;3(5):459–474. doi: 10.1111/j.1467-7652.2005.00148.x. [DOI] [PubMed] [Google Scholar]
- 3.Banguela A, Hernández L. Fructans, from natural sources to transgenic plants. Biotecnol Appl. 2006;23:202–210. [Google Scholar]
- 4.Edelman J, Jefford TG. The mechanisim of fructosan metabolism in higher plants as exemplified in Helianthus tuberosus. New Phytol. 1968;67:517–531. doi: 10.1111/j.1469-8137.1968.tb05480.x. [DOI] [Google Scholar]
- 5.Bacon JSD. The trisaccharide fraction of some monocotyledons. Biochem J. 1959;73(3):507–514. doi: 10.1042/bj0730507. [DOI] [PMC free article] [PubMed] [Google Scholar]
- 6.Ellis JLDJ, Bannink A, Parsons AJ, Rasmussen S, Edwards GR, Kebreab E. The effect of high-sugar grass on predicted nitrogen excretion and milk yield simulated using a dunamic model. J Dairy Sci. 2011;94:3105–3118. doi: 10.3168/jds.2010-4059. [DOI] [PubMed] [Google Scholar]
- 7.Edwards GR, Parsons AJ, Rasmussen S (2007) High sugar ryegrasses for dairy systems. In: DF Chapman, DA Clark, KL MacMillan, Nation D (eds) Proceedings of the 3rd Dairy Science Symposium, Meeting the Challenges for Pasture-based Dairying’, National Dairy Alliance. Melbourne, Australia, pp 307–334
- 8.Antonio C, Pinheiro C, Chaves MM, Ricardo CP, Ortuño MF, Thomas-Oates J. Analysis of carbohydrates in Lupinus albus stems on imposition of water deficit, using porous graphitic carbon liquid chromatography–electrospray ionization mass spectrometry. J Chromatogr A. 2008;1187(1–2):111–118. doi: 10.1016/j.chroma.2008.02.010. [DOI] [PubMed] [Google Scholar]
- 9.Timmermans JW, Van Leeuwen MB, Tournois H, De Wit D, Vliegenthart JFG. Quantitative analysis of the molecular weight distribution of inulin by means of anion exchange HPLC with pulsed amperometric detection. J Carbohydr Chem. 1994;13(6):881–888. doi: 10.1080/07328309408011688. [DOI] [Google Scholar]
- 10.Guignard C, Jouve L, Bogéat-Triboulot MB, Dreyer E, Hausman JF, Hoffmann L. Analysis of carbohydrates in plants by high-performance anion-exchange chromatography coupled with electrospray mass spectrometry. J Chromatogr A. 2005;1085(1):137–142. doi: 10.1016/j.chroma.2005.05.068. [DOI] [PubMed] [Google Scholar]
- 11.Van der Hoeven RAM, Hofte AJP, Tjaden UR, Van Der Greef J, Torto N, Gorton L, Marko-Varga G, Bruggink C. Sensitivity improvement in the analysis of oligosaccharides by on-line high-performance anion-exchange chromatography/ion spray mass spectrometry. Rapid Commun Mass Spectrom. 1998;12(2):69–74. doi: 10.1002/(SICI)1097-0231(19980131)12:2<69::AID-RCM118>3.0.CO;2-K. [DOI] [Google Scholar]
- 12.Robinson S, Bergstrom E, Seymour M, Thomas-Oates J. Screening of underivatized oligosaccharides extracted from the stems of Triticum aestivum using porous graphitized carbon liquid chromatography & mass spectrometry. Anal Chem. 2007;79(6):2437–2445. doi: 10.1021/ac0616714. [DOI] [PubMed] [Google Scholar]
- 13.Harrison SJ, Fraser K, Lane GA, Villas-Boas S, Rasmussen S. A reverse-phase liquid chromatography/mass spectrometry method for the analysis of high-molecular-weight fructooligosaccharides. Anal Biochem. 2009;395(1):113–115. doi: 10.1016/j.ab.2009.08.010. [DOI] [PubMed] [Google Scholar]
- 14.Rasmussen SPA, Xue H, Newman JA. High sugar grasses—harnessing the benefits of new cultivars through growth management. Proc NZ Grassland Assoc. 2009;71:167–175. [Google Scholar]
- 15.McIlwain S, Page D, Huttlin EL, Sussman MR. Using dynamic programming to create isotopic distribution maps from mass spectra. Bioinformatics. 2007;23(13):i328. doi: 10.1093/bioinformatics/btm198. [DOI] [PubMed] [Google Scholar]
- 16.Tomos AD, Leigh RA. The pressure probe: a versatile tool in plant cell physiology. Annu Rev Plant Biol. 1999;50(1):447–472. doi: 10.1146/annurev.arplant.50.1.447. [DOI] [PubMed] [Google Scholar]
- 17.Turner LB, Cairns AJ, Armstead IP, Ashton J, Skot K, Whittaker D, Humphreys MO. Dissecting the regulation of fructan metabolism in perennial ryegrass (Lolium perenne) with quantitative trait locus mapping. New Phytol. 2006;169(1):45–58. doi: 10.1111/j.1469-8137.2005.01575.x. [DOI] [PubMed] [Google Scholar]
- 18.Tamura KKA, Sanada Y, Tase K, Komatsu T, Yoshida M. Cloning and functional analysis of a fructosyltransferase cDNA of highly polymerized levans in timothy (Phleum pratense L.) J Exp Bot. 2009;60:893–905. doi: 10.1093/jxb/ern337. [DOI] [PMC free article] [PubMed] [Google Scholar]
Associated Data
This section collects any data citations, data availability statements, or supplementary materials included in this article.


