Abstract
Biliary atresia (BA) is a destructive cholangiopathy of childhood in which Th1 immunity has been mechanistically linked to the bile duct inflammation and obstruction that culminate in liver injury. Based on reports of decreased Th1 cytokines in some patients and the development of BA in mice lacking CD4+ T cells, we hypothesized that Th1-independent mechanisms can also activate effector cells and induce BA. Here, we tested this hypothesis using Stat1–/– mice, which lack the ability to mount Th1 immune responses. Infection of Stat1–/– mice with rhesus rotavirus type A (RRV) on postnatal day 1 induced a prominent Th2 response, duct epithelial injury and obstruction within 7 days, and atresia shortly thereafter. A high degree of phosphorylation of the Th2 transcription factor Stat6 was observed; however, concurrent inactivation of Stat1 and Stat6 in mice did not prevent BA after RRV infection. In contrast, depletion of macrophages or combined loss of Il13 and Stat1 reduced tissue infiltration by lymphocytes and myeloid cells, maintained epithelial integrity, and prevented duct obstruction. In concordance with our mouse model, humans at the time of BA diagnosis exhibited differential hepatic expression of Th2 genes and serum Th2 cytokines. These findings demonstrate compatibility between Th2 commitment and the pathogenesis of BA, and suggest that patient subgrouping in future clinical trials should account for differences in Th2 status.
Introduction
Biliary atresia (BA) is a severe disease of early childhood with relative uniformity in clinical presentation, but heterogeneous liver pathology at diagnosis. For example, comprehensive histological and liver gene expression studies identify groups of infants with either inflammation or prominent fibrosis despite similarities in ages and degree of cholestasis (1–6). Although not yet studied formally, this heterogeneity may account, at least in part, for the lack of response in clinical trials that assign all patients to the same treatment protocols (7). Therefore, there is an urgent need to identify novel mechanisms underlying different stages of disease.
Among the diverse components of the molecular response in diseased livers of patients with BA, only Th1 signals have been linked to mechanisms of pathogenesis of hepatobiliary injury consistently. Livers are populated by CD4+, CD8+, and NK lymphocytes at diagnosis and overexpress proinflammatory cytokines (8–15). Support for their roles in pathogenesis of disease comes from mechanistic studies in a rotavirus-induced animal model of the disease. In this model, the administration of rhesus rotavirus type A (RRV) in the immediate postnatal period results in epithelial injury and obstruction of extrahepatic bile ducts within a week, producing a biliary phenotype akin to the disease in humans (16, 17). In this model, the expression of IFN-γ and the natural killer group 2d receptor (Nkg2d) and the presence of NK and CD8+ cells are required for biliary injury, with substantial improvement in the experimental phenotype induced by their loss or blockade (15, 18, 19). Altogether, the studies clearly point to a critical role for the Th1 response in pathogenesis of the bile duct injury and obstruction. However, how the Th1 response regulates the progression of disease and the interplay between the different cell types is largely unknown.
Mechanistic studies in the mouse model also suggest that there is redundancy in the Th1 response, with the potential for alternative circuits to produce tissue pathology. For example, newborn mice develop BA after RRV infection despite the loss of IL-12 or CD4+ cells (19, 20). These results raise the possibility that other circuits may activate accessory pathways and produce duct injury, perhaps even in the absence of a Th1 response. Here, we directly address this possibility using the murine model and complementary assays in human tissues. For the studies, we hypothesized that Th1-independent mechanisms activate effector cells and induce BA. Loss of Th1 response was obtained by using mice carrying an inactivation of the gene encoding the signal transducer and activation of transcription-1 (Stat1–/– mice), which plays a critical role in IFN-γ signaling (21). We found that in response to RRV infection, neonatal Stat1–/– mice efficiently mounted a prominent IL-4– and IL-13–rich T lymphocyte (Th2) and myeloid cell response with M2 signature, with bile duct injury, obstruction, and formation of dilatation or cyst distally. The relevance of this Th2/M2 response became obvious when the depletion of macrophages or the superimposed inactivation of Il13 in Stat1–/– mice largely blocked epithelial injury and prevented the BA phenotype. Analyses of these signals in livers and sera from infants at the time of diagnosis identified subgroups of patients with high or low expression of Th2 genes and of circulating levels of IL-4, IL-13, and other Th2 cytokines.
Results
Increased liver expression of Stat1 after RRV infection.
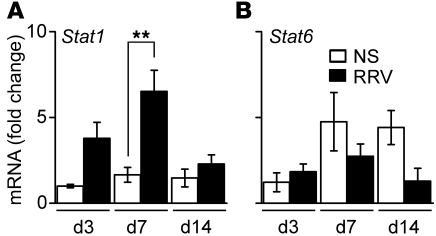
Based on the regulatory role of Stat1 in mediating the cellular response of IFN-γ and Th1 differentiation (21), we first quantified the mRNA expression for the Stat1 gene in extrahepatic bile ducts of WT BALB/c neonatal mice at 3, 7, and 14 days after administration of RRV (1.5 × 10⁶ fluorescence-forming units [ffu]) or saline intraperitoneally in the first 24 hours of birth. The administration of RRV resulted in the development of acholic stools by 7 days, poor growth and mortality in more than 90% of mice by 14 days of age; obstruction of extrahepatic bile ducts was demonstrated by direct examination of sections of ducts embedded in paraffin and stained with H&E, as described previously (22, 23). Stat1 mRNA expression in bile ducts increased after RRV when compared with that in saline controls, with a peak at the time of duct obstruction (7 days; Figure 1A). In contrast, the mRNA expression for the Th2-related transcription factor Stat6 did not change after RRV (Figure 1B). These results suggested a potential role of Stat1 in the Th1 response to RRV in neonatal mice.
Figure 1. Stat1 is induced in liver after RRV challenge.
Hepatic Stat1 (A) and Stat6 (B) mRNA expression in BALB/c mice at 3, 7, and 14 days after saline (NS) or RRV challenge shows that Stat1 begins to increase at 3 days and reaches a significant peak at 7 days. Data represent 3 replicates and are normalized to internal Hprt control and then to the value from NS-treated mice at day 3; n = 3–4 livers per group and time point. **P < 0.01. Values are expressed as mean ± SEM.
Th2 commitment in Stat1–/– livers after RRV challenge.
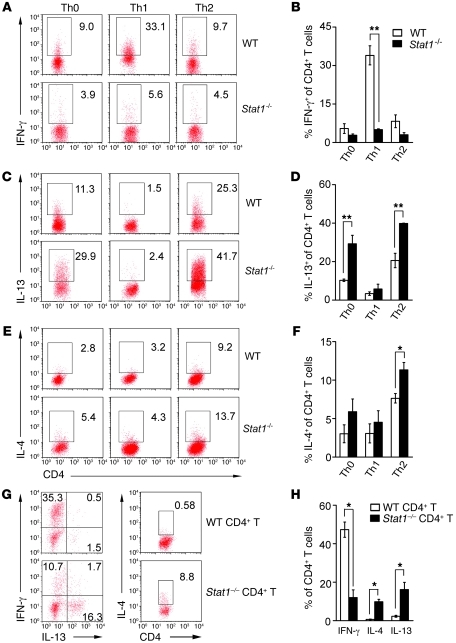
To directly examine the role of Stat1 in the control of the neonatal Th1 response, first we isolated CD4+CD25– lymphocytes from spleens of naive WT and Stat1–/– adult mice and subjected them to polarization experiments by incubation with anti-CD3 and anti-CD28 antibodies with or without Th1- or Th2-polarizing cytokines and antibodies for 3 days. The expression of IFN-γ was lower in Stat1–/– CD4+ T cells than in WT cells upon Th1 stimulation (Figure 2, A and B). In contrast, Stat1–/– CD4+ T cells had higher baseline expression of IL-13 (Figure 2, C and D) and of both IL-13 and IL-4 above the levels in WT CD4+ T cells when cultured with Th2 inducers (Figure 2, C–F).
Figure 2. Naive CD4+ T cells deficient in Stat1 differentiate into Th2 cells.
Flow cytometry of naive CD4+CD25– T cells cultured with anti-CD3/CD28 antibodies with or without different combinations of cytokines and antibodies for 3 days (A–F). Stat1–/– CD4+ T cells lack IFN-γ production under Th1-polarized conditions (A and B) and generate more IL-13 in Th0 and Th2 (C and D) and IL-4 under Th2 (E and F) conditions. Numbers in plots indicate percentage of CD4+ T cells that are also positive for IFN-γ, IL-13, or IL-4; data in B, D, and F are from 3 experiments. In G and H, the adoptive transfer of CD4+ T cells to Rag2–/– recipients soon after birth was followed by RRV injection 12 hours later. Hepatic mononuclear cells were analyzed by flow cytometry for percentage of IFN-γ, IL-13, and IL-4 gated on CD4+ T cells at 10 days after RRV challenge. Data are shown as representative dot plots (G) and average of 3 experiments (H). *P < 0.05; **P < 0.01. Values are expressed as mean ± SEM.
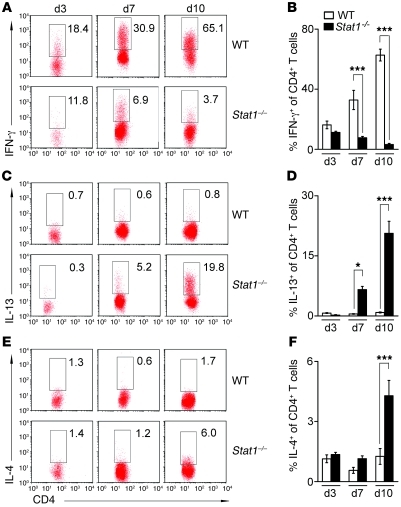
To determine whether CD4+ T cells undergo differentiation into Th1 or Th2 cells in vivo independently of Stat1, we transferred 0.5–1 × 10⁷ splenic CD4+ T cells from naive WT and Stat1–/– mice intraperitoneally into Rag2–/– BALB/c mice (which lack T and B cells) within 24 hours of birth, followed by RRV challenge 12 hours later. Flow cytometric analysis of hepatic T cells 10 days after RRV showed a suppression of IFN-γ production and an increase in IL-4 and IL-13 by transplanted Stat1–/– CD4+ T cells when compared with transplanted WT cells (Figure 2, G and H). Consistent with this Th2 response, flow cytometric analyses following RRV challenge to WT and Stat1–/– mice showed lower expression of IFN-γ by hepatic CD4+ T cells and higher expression of IL-13 at 7–10 days (the time of bile duct obstruction) and IL-4 at 10 days in Stat1–/– livers (Figure 3, A–F). The expression of IFN-γ by other hepatic mononuclear cells was also downregulated in Stat1–/– livers when compared with WT mice after RRV challenge (Supplemental Figure 1; supplemental material available online with this article; doi: 10.1172/JCI57728DS1). As additional evidence of decreased IFN-γ signaling, the mRNA expression for IFN-γ and the IFN-γ target genes Cxcl9, Cxcl10, Irf1, Ifnb, Socs1, Rantes, Fasl, Ccl3, and Ccl4 was suppressed in livers after RRV challenge (Supplemental Figure 2, A and B). These complementary data demonstrate that Stat1–/– CD4+ T lymphocytes have limited Th1 response in vitro and in vivo and undergo a prominent Th2 polarization in response to RRV.
Figure 3. RRV induces Th2 response in Stat1–/– neonatal mice.
Flow cytometry analysis of IFN-γ, IL-13, and IL-4 expression by hepatic CD4+ T cells on days 3, 7, and 10 after RRV challenge (A–F). Stat1–/– CD4+ T cells failed to express IFN-γ (A and B), while they produced more IL-13 (C and D) and IL-4 (E and F) than WT CD4+ T cells. Numbers in dot plots indicate percentage of CD4+ cells that also express IFN-γ, IL-13, or IL-4. Data are shown as representative dot plots (A, C, and E) and average of 3 experiments (B, D, and F). *P < 0.05; ***P < 0.001. Values are expressed as mean ± SEM.
Obstruction and cyst formation in Stat1–/– bile ducts after RRV challenge.
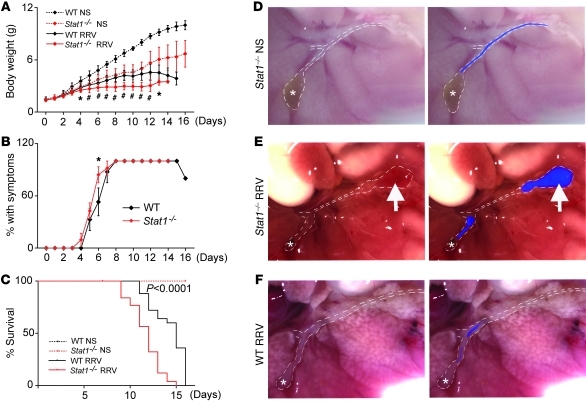
Having demonstrated that Stat1–/– mice are unable to mount an effective Th1 response, we examined the development of biliary injury and obstruction after RRV challenge within 24 hours of birth. In saline-injected control mice, daily measurements of body weight showed that Stat1–/– mice were generally smaller than WT mice (Figure 4A), but appeared healthy and grew well into adulthood (data not shown). Upon RRV infection, Stat1–/– mice had poor growth (Figure 4A), developed jaundice and acholic stools between 4 and 7 days similarly to WT mice (Figure 4B), and died at a greater rate within 15 days (P < 0.001; Figure 4C).
Figure 4. Severity of disease in Stat1–/– mice after RRV challenge.
The symptoms and weights were monitored for 16 days after RRV or normal saline challenge (NS). (A) RRV challenge led to poorer growth in Stat1–/– (n = 32) than WT mice (n = 25); NS-treated Stat1–/– (n = 27) and WT mice (n = 9) served as controls. (B) Both Stat1–/– and WT mice developed acholic stools. (C) Stat1–/– mice died earlier than WT mice after RRV challenge. (D–F) Macroscopic appearance of the hepatic hilum: (A) normal in saline-injected Stat1–/– mice at day 14 (D), (B) obstruction and cystic dilatation in Stat1–/– mice 7 days after RRV infection (E), and (C) diffuse obstruction in WT mice, also 7 days after RRV infection (F). *P < 0.05; #P < 0.001. White dotted lines outline the gallbladder (*) and extrahepatic bile ducts; the blue color fills the segments of bile ducts that are patent; arrows point to cystic dilatation. Original magnification, ×70. Values are expressed as mean ± SEM.
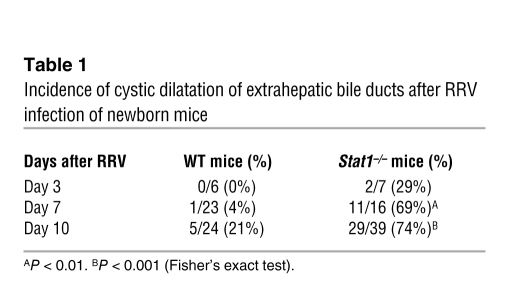
To investigate the anatomic basis of cholestasis, we examined the general appearance of extrahepatic bile ducts of Stat1–/– mice 7–14 days after saline or RRV injection. The gallbladder and extrahepatic bile ducts of saline-injected Stat1–/– mice had normal appearance (Figure 4D). In contrast, RRV infection resulted in the formation of segments of extrahepatic bile ducts that had variable lengths of lumen obstruction in all mice, with the majority also displaying dilatation distal to the site of obstruction and extending to the site of insertion into the duodenal loop (Figure 4E). While the duct obstruction was similar to the findings typically seen in RRV-infected WT mice (Figure 4F), the development of dilatation or cysts was substantially greater in Stat1–/– mice (Table 1). These data suggested that the development of bile duct obstruction after RRV was not prevented by the loss of Stat1 and raised the possibility that the type of inflammatory response may be responsible for the formation of cysts in bile ducts of Stat1–/– mice.
Table 1 .
Incidence of cystic dilatation of extrahepatic bile ducts after RRV infection of newborn mice
Hepatic and biliary infiltration by myeloid cells in Stat1–/– mice.
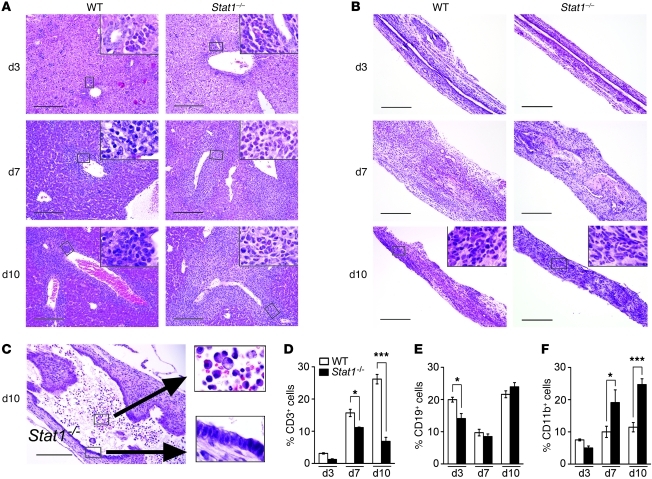
Histological surveys of liver sections 3 days after RRV showed a mild infiltration of portal tracts with neutrophils in both Stat1–/– and WT mice (Figure 5A). The infiltration switched primarily to lymphocytes by 7 and 10 days in WT livers; however, while the pattern of infiltration was similar between WT and Stat1–/– livers, the cellular content in Stat1–/– livers continued to consist primarily of neutrophils at these time points (Figure 5A). In extrahepatic bile ducts, there was minimal submucosal inflammation by neutrophils and lymphocytes 3 days after RRV in both mouse lines, with the formation of inflammatory plugs at 7 days (Figure 5B). At 10 days after RRV, obstructed segments of bile ducts showed residual inflammation by lymphocytes in WT mice and neutrophils and macrophages in Stat1–/– mice (Figure 5B). A similar infiltration by these myeloid cells was also present in the submucosal compartments of the cystic formations of bile ducts, despite the presence of an intact epithelial surface (Figure 5C). To more precisely quantify the population of inflammatory cells in response to RRV, we determined the percentage of CD3+ (for T lymphocytes), CD19+ (for B lymphocytes), and CD11b+ (for myeloid cells: neutrophils and macrophages) cells in hepatic mononuclear cells 3, 7, and 10 days after viral challenge. We found that Stat1 deficiency resulted in suppression of T lymphocytes at 7 and 10 days (Figure 5D) and of B lymphocytes at 3 days (Figure 5E), with a significant increase in myeloid cells at 7 and 10 days (Figure 5F). These data suggested that a suppressed Th1 response did not prevent the obstruction phenotype and that myeloid cells may undergo activation and serve as an alternative source of inflammatory signals for duct injury, obstruction, and cyst formation.
Figure 5. Myeloid cells infiltrate livers and bile ducts of Stat1–/– mice after RRV challenge.
H&E staining of liver sections shows mild infiltration of portal tracts by neutrophils 3 days after RRV in WT and Stat1–/– mice (A). The degree of infiltration increases in both mouse lines at 7 and 10 days, primarily with lymphocytes in WT mice and persistent neutrophilic infiltration in Stat1–/– mice. (B) Similar staining of longitudinal sections of extrahepatic bile ducts shows mild submucosal inflammation at day 3, formation of an inflammatory plug obstructing the lumen at day 7, and the ongoing obstruction at day 10. Notably, inflammatory cells in WT bile ducts are predominantly lymphocytes at day 10, while they are primarily neutrophils in Stat1–/– ducts. (C) Section in the distal end of a Stat1–/– duct shows a cystic dilatation, which is lined by largely intact epithelium but also displays neutrophils and macrophages in the lumen and within the wall. Scale bars: 200 μm; original magnification, ×1000 (insets). (D–F) Mean ± SEM percentage of hepatic mononuclear cells that are stained for CD3, CD19, and CD11b by flow cytometry at days 3, 7, 10 after RRV challenge. *P < 0.05; ***P < 0.001. n = 4–10 mice in each group.
Suppression of Th1 and impaired viral clearance in Stat1–/– mice.
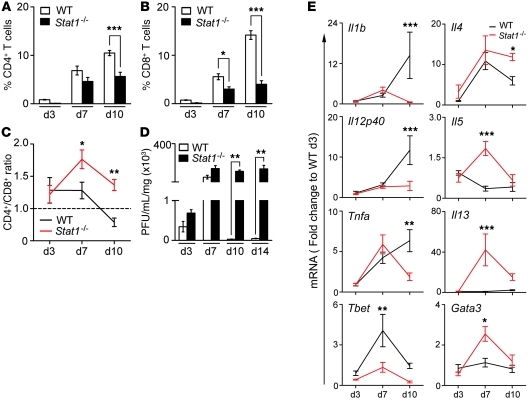
To investigate the consequences of Stat1 deficiency on T cell response and viral clearance, we quantified CD3+ subsets and found decreases in both hepatic CD4+ and CD8+ T cells, with a higher CD4+/CD8+ ratio (Figure 6, A–C). Consistent with a substantial decrease in CD8+ cells, Stat1–/– mice were unable to clear RRV from the liver, and RRV titers remained high until the time of death 10–14 days after viral inoculation (Figure 6D). This was associated with mRNA expression for the Th1-related genes Il1b, Il12p40, Tnfa, and Tbet 10 days after RRV that was similar to or lower than that in WT mice and higher expression for the Th2-related genes Il4, Il5, Il13, and Gata3 (Figure 6E and Supplemental Table 1). We also found no evidence of substantial activation of Th17 at the time of epithelial injury or onset of duct obstruction, as demonstrated by 3% or fewer of hepatic CD4+ cells staining with IL-17 and with 5%–15% of Treg cells populating WT and Stat1–/– livers (both reaching a significant rise in Stat1–/– mice only at 10 days), but a Th17/Treg cell ratio of less than 1 at all time points. Further, there was no difference in the hepatic Il17a mRNA expression between WT and Stat1–/– mice at 3–10 days after RRV (Supplemental Figure 3). Thus, the predominant expression of Th2-related genes in the presence of a lower number of CD4+ lymphocytes raised the possibility that other cell types may also undergo Th2 commitment, especially in view of the infiltration of the hepatobiliary system by myeloid cells.
Figure 6. Stat1–/– mice have low CD8+ cells and high Th2 markers after RRV challenge.
Flow cytometric analyses showing the percentage of hepatic CD4+ and CD8+ T cells and CD4/CD8 ratios in WT and Stat1–/– mice after RRV (A–C). (D) RRV titer shows clearance of RRV by WT mice and persistently high titers in Stat1–/– mice. (E) Graphs display hepatic mRNA expression for Th1 and Th2 genes in WT and Stat1–/– mice after RRV challenge. mRNA expression was first normalized to internal Hprt control and then normalized to the value from WT mice at day 3; n = 3–4 livers per group and time point. *P < 0.05; **P < 0.01; ***P < 0.001. Values are expressed as mean ± SEM.
M2 activation of myeloid cells after RRV in Stat1–/– mice.
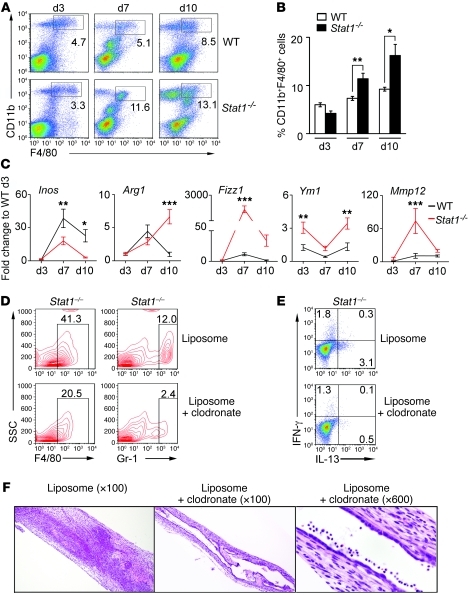
Based on the infiltration of the liver and bile ducts by myeloid cells and on the ability of Th1- or Th2-primed CD4+ T lymphocytes to stimulate a related phenotype in macrophages (24–26), we quantified the infiltration of macrophages in the liver and the expression of genes related to M1 or M2 commitment after viral challenge. The number of CD11b+F4/80+ macrophages increased in livers of Stat1–/– mice at 7 and 10 days after RRV when compared with those in WT mice (Figure 7, A and B). To ascertain whether macrophages in Stat1–/– mice have markers of myeloid-derived suppressor cells (MDSCs), we determined expression of IL-4Rα (CD124) and F4/80 in CD11b+Gr-1hi hepatic mononuclear cells (27–29). We found an increased population in the liver of CD11b+/Gr-1hi cells expressing CD124 in Stat1–/– mice 10 days after RRV (Supplemental Figure 4A), but only a small portion of these cells expressed F4/80 in Stat1–/– livers (Supplemental Figure 4B). These results suggest that macrophages in Stat1–/– mice don’t have an MDSC phenotype.
Figure 7. RRV induces M2 activation in Stat1–/– mice.
Flow cytometry analysis show that CD11b+F4/80+ macrophages increase in Stat1–/– livers 7 and 10 days after RRV challenge (A and B); the percentage of hepatic mononuclear cells are from 3 different experiments. (C) Graphs display the hepatic mRNA expression for M1 and M2 genes in WT and Stat1–/– mice after RRV challenge. mRNA expression was first normalized to internal Hprt control and then normalized to the value from WT mice at day 3; n = 3–4 livers per group and time point. (D) Representative contour plots show a decrease in the percentage of F4/80+ and Gr-1+ cells in livers induced by daily administration of clodronate-loaded liposomes in Stat1–/– mice 7 days after RRV challenge (when compared with control PBS-loaded liposomes), which was associated with a decrease in the percentage of CD4+ T cells expressing IL-13 (E; n = 3–4 per group, reproduced in 2 different experiments). (F) Photomicrographs of H&E-stained longitudinal sections of extrahepatic bile ducts with inflammatory epithelial injury and luminal obstruction in Stat1–/– mice receiving PBS-loaded liposomes (left photograph) and patent lumen with intact epithelium in mice receiving clodronate-loaded liposomes (middle and right photographs). *P < 0.05; **P < 0.01; ***P < 0.001. Values are expressed as mean ± SEM.
To explore whether the increased population of hepatic macrophages had evidence of alternative (M2) activation, we quantified the hepatic expression of selected genes and found lower mRNA expression for Inos (M1 gene) in Stat1–/– mice, while mRNA for Arg1, Fizz1, Ym1, and Mmp12 (M2 genes) increased several fold above that in WT mice 3–10 days after RRV (Figure 7C). To determine the contribution of alternatively activated macrophages to the biliary injury phenotype, we used clodronate-loaded liposomes to decrease the population of hepatic macrophages in Stat1–/– mice (30, 31). The administration of clodronate-loaded liposomes shortly after birth and then daily after administration of RRV depleted 50% of F4/80+ and 75% of Gr-1hi liver cells (Figure 7D) and suppressed the production of IL-13 by CD4+ cells (Figure 7E) in Stat1–/– mice 7 days after RRV challenge. The morphological analysis of extrahepatic bile ducts at this time point showed that Stat1–/– mice receiving clodronate-loaded liposomes had improved phenotype, with 50% of the mice showing patent bile ducts, mild cholangitis, and intact epithelium (Figure 7F). In contrast, patent ducts were present in only 14% of Stat1–/– mice receiving saline-loaded liposomes as controls. Together, the decreased obstruction of bile ducts and the predominant Th2-M2 profile at the time of bile duct obstruction formed the basis for a hypothesis that molecular components of the Th2 response directly regulate bile duct injury and obstruction in Stat1–/– mice.
Prevention of duct obstruction in Stat1–/– mice by the loss of IL-13.
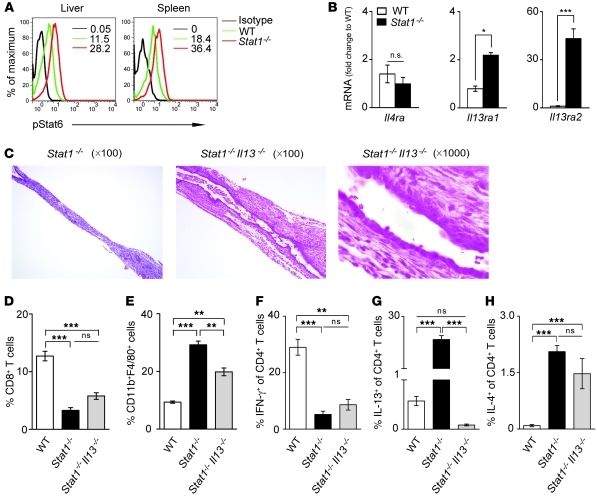
To test this hypothesis, we first determined whether the transcription factor Stat6 is activated in Stat1–/– mice infected with RRV based on its properties as inducer of IL-4 and IL-13 (32). Analyzing hepatic mononuclear cells and splenocytes by flow cytometry, we found phosphorylation of Stat6 in CD4+ cells from Stat1–/– mice increased above levels in WT mice 7 days after RRV challenge (Figure 8A). To determine whether Stat6 is critical to the development of duct obstruction, we superimposed the genetic inactivation of Stat6 into the Stat1–/– strain (Stat1–/–Stat6–/–) and subjected the mice to RRV challenge. Stat1–/–Stat6–/– mice developed jaundice, acholic stools, poor growth, and increased mortality, with bile duct obstruction and cyst formation in a fashion similar to that of Stat1–/– mice (data not shown). These results showed that Stat6 was not required for the disease phenotype.
Figure 8. Loss of IL-13 but not Stat6 decreases biliary obstruction in Stat1–/– mice.
Flow cytometric analysis of phosphorylated Stat6 in hepatic and splenic CD4+ T cells shows Stat6 activation in CD4+ T cells in the absence of Stat1 (A). (B) Graphs show the hepatic mRNA expression for receptors shared by IL-4 and IL-13 at 7 days after RRV challenge. (C) Photomicrographs of longitudinal sections of extrahepatic bile ducts of Stat1–/– and Stat1–/–Il13–/– mice 7 days after RRV challenge. (D–H) Flow cytometric analyses of hepatic mononuclear cells 10 days after RRV challenge in WT, Stat1–/–, and Stat1–/–Il13–/– mice. Surface staining was used for D and E, while dual surface and intracellular stainings were used for F–H; n = 3–5 in each group. **P < 0.01; ***P < 0.001. Values are expressed as mean ± SEM.
Based on the consistent increase in IL-13 at all stages of bile duct injury (Figures 2 and 3) and on its role as an important effector cytokine in Th2-related diseases, we quantified the hepatic mRNA expression for the receptors used by IL-13 after RRV challenge. We found that mRNA for the IL-4 receptor α (IL4Ra, shared by both IL-4 and IL-13) did not increase after RRV in Stat1–/– livers, but levels of IL-13 receptors IL13ra1 and IL13ra2 increased 2- to 30-fold above levels in WT mice (Figure 8B). To determine whether IL-13 plays a role in biliary injury and obstruction, we generated Stat1–/– mice that also lacked IL-13 (Stat1–/–Il13–/– mice) and subjected Il13–/– and Stat1–/–Il13–/– mice to RRV challenge. Il13–/– mice developed jaundice and biliary injury and obstruction similar to that in WT mice (data not shown). In contrast, 70% of Stat1–/–Il13–/– mice were alive 11 days after RRV, a time when survival of Stat1–/– mice was 30%. Notably, examination of extrahepatic bile ducts showed mostly intact epithelial surface and patent lumen despite subepithelial inflammation (Figure 8C); dilatation and cyst formation in bile ducts was similar to that in Stat1–/– mice. The improvement in the obstruction of bile ducts in Stat1–/–Il13–/– mice was associated with a number of CD8+ T cells similar to those found in Stat1–/– mice (Figure 8D), a decrease in macrophages (CD11b+F4/80+ cells; Figure 8E), and no change in the expression of IFN-γ or IL-4 by CD4+ lymphocytes (Figure 8, F–H). Further, among M2 markers, there was lower mRNA expression for Fizz1 and Mmp12 (Supplemental Figure 5). These data suggested that the improvement in the biliary phenotype could be assigned to the targeted loss of IL-13.
Expression of Th2 genes in livers of infants with BA.
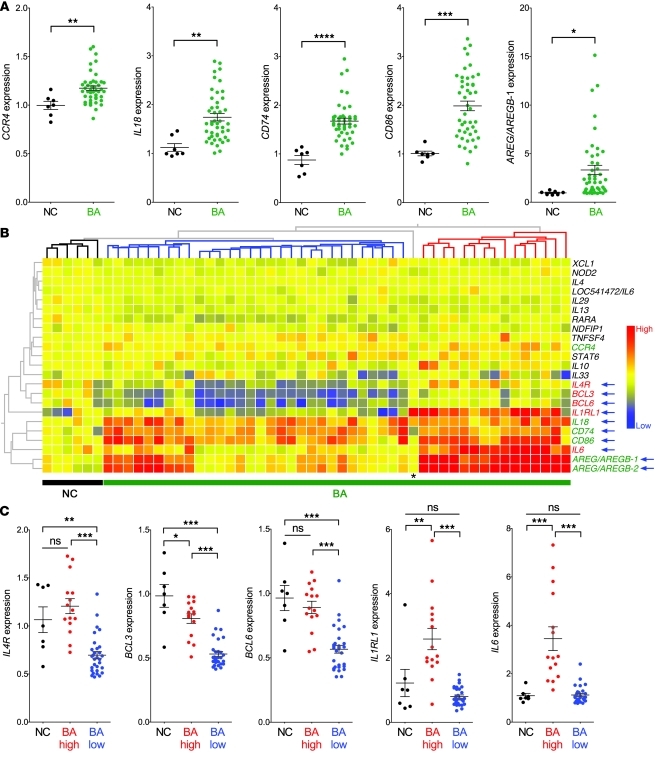
Based on the unexpected development of duct obstruction in neonatal mice in a predominantly Th2 state and in the absence of Th1, we investigated whether infants with BA show evidence of Th2 activation by examining the liver and serum at the time of diagnosis (<4 months of age). For the liver, we analyzed the mRNA expression for 23 genes linked to a Th2 response (Gene Ontology: www.geneontology.org) in 45 infants with BA and in 7 normal controls (liver transplantation–donor children at 2.5–3 years of age) reported by us previously (6, 15). Among these genes, the expression of CCR4, IL18, CD74, CD86, and AREG/AREGB increased in BA above those in controls (Figure 9A), with no increase in the expression of IL4, IL13, and STAT6 (not shown). Cluster analyses to align the subjects based on the levels of expression of the 23 genes produced a phylogenetic tree with 1 node grouping 6 of 7 controls and 2 other nodes that divided the BA cohort into 2 subgroups (Figure 9B). The subgroups were based primarily on the coordinate expression of 4 of 5 genes increased in BA (IL18, CD74, CD86, and AREG/AREGB) and of a new set of genes whose expression did not differ between BA as a single cohort and controls, but was significantly different between the 2 nodes or subgroups of BA (IL4R, BCL3, BCL6, IL1RL1, and IL6; Figure 9C). Consistent with this coordinated pattern of expression among subjects with BA, there was a high degree of correlation among these 9 genes in the BA cohort but not in controls (Supplemental Tables 2 and 3). Collectively, these results pointed to a heterogeneous expression of Th2 genes, some of which are consistently increased in BA above controls, while others, including Th2 cell receptors IL-4Rα and IL-1RL1 (33, 34), potentially identify subgroups of patients in the BA cohort based on high or low levels of expression.
Figure 9. Hepatic mRNA expression for Th2-related genes at diagnosis.
(A) Increased hepatic expression of CCR4, IL18, CD74, CD86, and AREG/AREGB-1 in BA (n = 45) above that in normal controls (NC, n = 7) at the time of diagnosis. (B) Cluster analysis depicting the hepatic expression of Th2 genes for normal controls and BA. The phylogenetic tree groups 6 of 7 normal control subjects as 1 node, and the 2 remaining nodes divide the BA cohort into 2 subgroups based on the differential expression of 9 genes (blue arrows). Among these genes, the expression of IL4, BCL3, BCL6, IL1RL1, and IL6 are not increased in BA as a single cohort over NC, but the scatter plots in C show that their expression levels are different between the 2 BA subgroups identified by the phylogenetic nodes. *P < 0.05; **P < 0.01; ***P < 0.001; ****P < 0.0001; AREG/AREGB-1 and 2 are 2 probe sets related to Amphiregulin/Amphiregulin-B. Asterisk in B identifies a normal control subject aligned among BA patients largely due to the high expression of IL1RL1. Values are expressed as mean ± SEM.
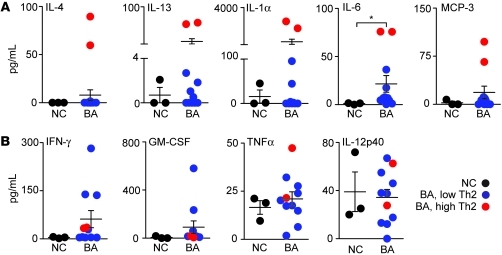
To further explore the possibility that a subgroup of patients with BA expresses Th2 markers, we determined the expression of Th1 and Th2 cytokines and chemokines in the serum from 11 patients at the time of diagnosis and in 3 age-matched normal infants serving as controls. These subjects were different from those in the liver gene expression cohort because sera were not available from them. The serum concentration of IL-6 increased in BA above that in controls (P < 0.05), but IL-4, IL-13, IL-1α, and MCP-3 did not change between the groups (Figure 10A). Interestingly, scatter plots of these data identified 2 of 11 patients that consistently had elevated levels of expression of all 5 Th2 cytokines (Figure 10A) and variable levels of Th1 cytokines (Figure 10B and Supplemental Figure 6, A and B). Combined with the gene expression data presented above, the increased levels of IL-4, IL-13, IL-1α, IL-6, and MCP-3 in the 2 patients support the existence of a subgroup of infants with BA with Th2 commitment at the time of diagnosis.
Figure 10. Serum levels of Th1 and Th2 cytokines/chemokines at diagnosis of BA.
Scatter plots show the concentration of Th1 (A) and Th2 (B) cytokines/chemokines for infants at the time of diagnosis of BA (n = 11; age <4 months) and age-matched normal infants (n = 3). The average concentrations for both groups do not differ, except for IL-6 as noted by the asterisk (*P < 0.05). The red circles depict the same 2 infants with consistently elevated levels of Th2 cytokines. Values are expressed as mean ± SEM.
Discussion
The development of experimental BA when hepatic mononuclear cells are fully committed to a Th2 phenotype is unexpected in view of the substantial body of mechanistic evidence supporting the role of Th1 circuits in pathogenesis of disease (7, 35, 36). Using mice that are unable to mount a Th1 response by the genetic inactivation of Stat1 (21), we found that perinatal infection with RRV induced epithelial injury and luminal obstruction of bile ducts. The tissue injury occurred in the presence of a prominent Th2 commitment, with high expression of IL-4 and IL-13 by hepatic lymphocytes, infiltration of myeloid cells (neutrophils and macrophages), and increased expression of genes linked to an alternative M2 differentiation state by myeloid cells. These cells were important for the obstructive phenotype, as supported by decreased duct injury and obstruction following partial depletion of macrophages. Direct evidence for a mechanistic role of Th2 in the biliary phenotype was provided by a decrease in biliary injury and lower incidence of bile duct obstruction when the genetic inactivation of the Il13 gene was superimposed into Stat1–/– mice. It is interesting that IL-13 production by CD4+ T cells also decreased after macrophage suppression, suggesting that macrophages might induce and/or maintain Th2 signals in Stat1–/– mice. In humans, the mRNA and protein expression for IL-4 and IL-13 did not increase in a BA cohort when compared with that in normal controls, but the high or low levels of these and other Th2 cytokines and genes potentially identified subgroups in the BA cohort, which is in keeping with previous reports of heterogeneity among infants at the time of diagnosis (1–7, 37–39). Collectively, these findings reveal a previously unrecognized compatibility between Th2 commitment and mechanisms of experimental BA, and identify a differential expression profile of Th2 molecules in a subset of patients at the time of diagnosis.
Effectors of the Th1 response have long been implicated in pathogenesis of BA. In humans, tissue analyses show infiltration of activated CD4+, CD8+, and NK lymphocytes, activated macrophages, and increased expression of proinflammatory cytokines, such as IFN-γ, TNF-α, IL-2, osteopontin, and others (8–15). There is initial evidence that CD8+ lymphocytes undergo oligoclonal expansion, and circulating antibodies that recognize cholangiocyte epitopes have been isolated from sera of affected children (13, 40). Despite the general predominance of these Th1 markers, we report that analyses of the gene expression pattern at diagnosis also identify an increased expression of a set of Th2 genes above controls and a second set with a coordinate expression that potentially divided the cohort into subgroups with high and low expression. Analyzing serum cytokines in a separate cohort of 11 infants with BA, we found that the concentrations of IL-4, IL-13, IL-1α, IL-6, and MCP-3 did not differ from that in controls, but were elevated in 2 of 11 patients at the time of diagnosis, suggesting that these patients may have undergone Th2 commitment and may display a different stage of disease progression. A limitation of this study, however, is the low number of serum samples analyzed, which will require validation in a larger patient cohort that is adequately powered for statistical analysis and that contains clinical and outcome data to investigate the relevance of cytokine levels as biomarkers of disease. This limitation notwithstanding, based on the detection of hepatic and serum Th2 markers at the time of diagnosis, it is possible that the pathogenesis of biliary injury may be linked to Th2 effectors in these patients. Alternatively, the activation of Th2 circuits may represent a progression of disease that began earlier in a typical Th1 response and then transitioned to a Th2 state at the time of diagnosis. Although both possibilities are reasonable, we favor the latter in view of the concomitant increase in TNF-α and IL-12 (but not IFN-γ) in the same patients and of the recent report demonstrating different stages of disease at the time of diagnosis (6).
Experimentally, our data provide evidence that components of the Th2 response directly induce intra- and extrahepatic cholangiopathy, with cholangiocyte injury, breach of the epithelial continuity, and the formation of an inflammatory plug similar to the phenotype produced by a Th1 response in RRV-infected neonatal mice (18, 19, 23). CD4+ lymphocytes from Stat1–/– mice were unable to mount an effective Th1 response after stimulation in tissue culture, in vivo upon RRV infection, or even after adoptive transfer into Rag2–/– mice. Livers of Stat1–/– mice had low infiltration of CD4+ and CD8+ lymphocytes, but these cells overexpressed IL-4 and IL-13. More noticeable was the infiltration of portal tracts and extrahepatic bile ducts by myeloid cells (neutrophils and macrophage) and an increased expression of M2 genes (Arg1, Fizz1, Ym1, and Mmp12). Together, this response is consistent with a Th2-biased immune response and the alternative activation of macrophages in a fashion that has been linked to wound healing, chronic inflammation, and a profibrotic environment in other tissues (41–44).
The improvement in epithelial injury and the prevention of bile duct obstruction after removal of IL-13 from Stat1–/– mice suggest that IL-13 is a major Th2 factor driving the atresia phenotype in these mice. Despite the important role of IL-4 in Th2 circuits, its persistent increase despite the improved phenotype produced by the loss of IL-13 is consistent with a lack of key functions by IL-4 in the induction of epithelial damage (45–47). Further, in our model, the increase in IL-4 was not associated with a higher number of hepatic B cells. Although our experimental strategy did not explore the potential mechanisms for this dissociation, our finding shows that the hepatobiliary response in Stat1–/– neonates differs from the typical B cell–rich processes that are operative in IL-4–induced allergy. As for IL-13, this cytokine has been shown to be important for hepatic fibrogenesis by means of TGF-β1 or other members of the M2 pathway (48–50). A limitation of our work relates to the lack of insight into the basis of the cystic dilatation of extrahepatic bile ducts. Its location distal to the site of obstruction rules out a cystic formation due to increased intraluminal pressure. Its persistence despite the loss of IL-13 uncouples its pathogenesis from the overexpression of this cytokine. One possibility is a potential role for IL-4 and other Th2/M2-related factors in an incomplete repair of the injured bile duct. The field will benefit from a formal inquiry of this possibility, as it may provide insight into mechanisms of wound repair of injured bile ducts or into pathogenesis of choledocal cyst, the most common cystic disease of the extrahepatic bile duct in children.
In conclusion, we show experimentally that Th2 commitment is compatible with the phenotype of BA in neonatal mice. Without much participation of IFN-γ or other Th1 molecules, neonatal exposure to rotavirus induced an IL-4– and IL-13–rich Th2 response which produced epithelial injury and inflammatory obstruction of extrahepatic bile ducts. It also produced cystic dilatation of the ducts in most mice, which remains unexplained at this time. At the mechanistic level, we were able to link IL-13 to bile duct injury and obstruction. In humans, some Th2 genes were overexpressed in BA, while others increased only in a subgroup of patients. The combination of these findings with an increased concentration of Th2 cytokines in 2 of 11 patients with BA suggests a potential transition from Th1 to a profibrogenic Th2 pathway, in keeping with published reports that some patients already display hepatic fibrosis at diagnosis (1–5). These findings add a new dimension to our understanding of pathogenesis of disease and have implications for clinical trials. Do patients respond better to portoenterostomy or antiinflammatory agents if they display greater levels of Th1 versus Th2 cytokines? These types of questions should be taken into consideration when assigning subjects to clinical trial arms. Using the data reported here, one can provide a strong rationale for the need to follow changes in levels of Th1 and Th2 markers as (secondary) end points in therapeutic trials.
Methods
Mouse model of BA.
BALB/c mice were purchased from Charles River Laboratories and Rag2–/– BALB/c mice from Taconic Laboratory. Stat1–/– mice on a BALB/c background were a gift from Joan E. Durbin (Center for Vaccines and Immunity, Research Institute at Nationwide Children’s Hospital, Ohio State University, Columbus, Ohio, USA), while Stat6–/– BALB/c mice were purchased from The Jackson Laboratory. Il13–/– BALB/c mice were generated in the laboratory of Andrew N.J. McKenzie (MRC Laboratory of Molecular Biology, Cambridge, United Kingdom; ref. 51) and were a gift from Marc E. Rothenberg (Cincinnati Children’s Hospital Medical Center). We generated Stat1–/–Il13–/– and Stat1–/–Stat6–/– double-knockout mice in our laboratory by successive matings and identified targeted genes by PCR using tail DNA according to protocols from the providers of the mouse strains. For infection with RRV, mice were injected with 1.5 × 10⁶ ffu of RRV or 0.9% NaCl (saline) solution intraperitoneally in the first 24 hours; the experimental protocols for RRV-induced BA and RRV titer were as described previously (18, 52). All mice were bred under specific pathogen–free conditions, and the review board of Cincinnati Children’s Hospital Medical Center approved experimental protocols.
Cell isolation and flow cytometric analysis.
Single-cell suspension was obtained from spleens by gently mincing the tissue in complete DMEM containing 10% FBS (Biowhittaker); then the cells were washed twice in complete DMEM, subjected to red cell lysis buffer, and used in flow cytometry or CD4+ T cell isolation for cell culture or adoptive transfer experiments. A similar protocol was applied to the liver, with additional steps of centrifugation in 33% Percoll (Sigma-Aldrich) at 800 g at 20°C for 20 minutes. The single-cell suspension was washed twice with complete DMEM, immersed in red cell lysis buffer, and then stained for flow cytometric analysis.
For flow cytometry, cells were resuspended in PBS containing 1% BSA and 0.1% sodium azide, then incubated at 4°C for 30 minutes with combinations of the following antibodies (to mouse): FITC-conjugated anti-CD4 (RM4-5), CD3 (17A2), PE-conjugated anti-CD124 (mIL4R-M1), and PerCP-conjugated anti-CD8a (53-6.7) (from BD Biosciences); and anti-CD11b (M1/70), PE-conjugated anti-CD19 (eBio1D3), PE- or APC-conjugated anti-F4/80 (BM8), and FITC- or PerCP Cy5.5–conjugated anti–Gr-1 (RB6-8C5) (from eBioscience), according to established protocols (53). For intracellular straining of cytokines, cells were stimulated with 5 ng/ml PMA, 750 ng/ml ionomycin (both from Sigma-Aldrich), in the presence of 1 μl/ml GolgiPlug (BD Biosciences) for 4–5 hours. Cells were then harvested, washed, and stained with antibodies to surface markers, then washed and blocked with purified anti-FcRII/III (CD32/CD16; 2.4G2; BD Biosciences) for 15 minutes, followed by incubation with the BD Cytofix/Cytoperm Kit (BD Pharmingen) for 30 minutes and anti-cytokine antibodies using PE-conjugated anti–IL-4 (11B11; BioLegend) or anti–IL-13 antibody (eBio13A; eBioscience) and APC-conjugated anti–IFN-γ (XMG1.2; BD Biosciences) or anti–IL-17 antibody (TC11-18H10.1; Biolegend) at 4°C. A PE-conjugated anti-mouse/rat Foxp3 Staining Set (FJK-16s; eBioscience) was used for intracellular staining according to the manufacturer’s recommendations. For phosphorylated Stat6 staining, cells were stimulated with recombinant mouse IL-4 (10 ng/ml; 404-ML; R&D Systems) at 37°C for 15 minutes and then fixed with BD Phosflow Fix Buffer I at 37°C for 10 minutes, permeabilized in BD Phosflow Perm Buffer III on ice for 30 minutes, and stained with PE-conjugated anti-Stat6 (pY641, clone J71-773.58.11; BD Biosciences). Isotype-matched negative controls were used for all flow cytometric analyses.
CD4+ T cell purification, polarization, and adoptive transfer experiment.
CD4+CD25– or CD4+ T cells were isolated from spleens of 3- to 4-week-old mice with magnetic beads (Miltenyi Biotec). Naive CD4+CD25– T cells were cultured with plate-bound anti-CD3 antibody (5 μg/ml, 145-2C11; BD Biosciences) and soluble anti-CD28 (2 μg/ml, 37.51; BD Biosciences) under the following conditions: no cytokine or antibody for Th0 condition; recombinant IL-12 (10 ng/ml; BioLegend) and purified anti–IL-4 antibody (10 μg/ml, BVD4-1D11; BD Biosciences) for Th1; recombinant IL-4 (10 ng/ml, R&D Systems), anti–IL-12p40 (10 μg/ml, C17.8; eBioscience), and anti–IFN-γ antibody (10 μg/ml, XMG1.2; BD Biosciences) for Th2 condition. Cells were analyzed on day 3 for flow cytometry. For transfer experiments, 0.5–1 × 10⁷ CD4+ T cells were isolated from spleens of 6- to 8-week-old mice with CD4+ T cell column (R&D Systems), resuspended in PBS, and injected intraperitoneally into Rag2–/– BALB/c mice in the first 24 hours of life, followed with RRV challenge 12 hours later.
Real-time PCR analysis.
RNA isolation, cDNA synthesis, and quantitative PCR amplification using the Brilliant II SYBR Green QPCR Master Mix Gene Expression Assay Kit and the Mx3005p system (Stratagene; Agilent Technologies) were performed as described previously (18, 52). All primers are listed in the Supplemental Table 1; mRNA expression of target genes was normalized to the endogenous reference Hprt gene.
Liposome depletion of macrophages.
Newborn mice were injected with 10 μg of either clodronate-loaded or PBS-loaded liposomes (Encapsula NanoSciences) intraperitoneally immediately after birth, followed by RRV administration 24 hours later; liposomes were then administered daily beginning on day 2 after RRV challenge until the time of sacrifice at day 7.
Human liver RNA and serum cytokines.
mRNA expression was extracted from a database created using 45 liver samples obtained at the time of diagnosis of BA (<4 months of age) published by us recently and from 7 liver donor children ages 2 to 3.5 years, as described (6, 15). The concentration of cytokines was done in sera from 11 children with BA (also at diagnosis, <4 months of age) and 3 age-matched normal infants by Luminex Technology Platform (Millipore). The study protocol conformed to the ethical guidelines of the 1975 Declaration of Helsinki and was approved by the Institutional Review Board of Cincinnati Children’s Hospital Medical Center, with informed consent obtained from patients’ parents/guardians.
Statistics.
All in vitro experiments were performed in triplicate. The numbers of mice or tissues used in each experiment are presented in the text or figure legends. Values are expressed as mean ± SEM, and statistical significance was determined by 2-tailed Student’s t test or by 1-way or 2-way ANOVA for comparison between 3 or more groups, with a significance set at P < 0.05. Survival curves were created using the Kaplan-Meier method utilizing GraphPad Software. Correlation coefficient matrices were generated using StatPlus (AnalystSoft).
Supplementary Material
Acknowledgments
This work was supported by NIH grants DK-64008 and 83781 (to J.A. Bezerra) and DK-78392 funding the Gene Expression and Sequence Core and the Integrative Morphology Core of the Cincinnati Digestive Disease Research Core. We thank Joan E. Durbin for providing the Stat1–/– mice in a BALB/c background, and Marc E. Rothenberg and Andrew N.J. McKenzie for the Il13–/– BALB/c mice. We also thank Bryan Donnelly for assistance with viral assays.
Footnotes
Conflict of interest: The authors have declared that no conflict of interest exists.
Citation for this article: J Clin Invest. 2011;121(11):4244–4256. doi:10.1172/JCI57728.
References
- 1.Azarow KS, Phillips MJ, Sandler AD, Hagerstrand I, Superina RA. Biliary atresia: should all patients undergo a portoenterostomy? J Pediatr Surg. 1997;32(2):168–172. doi: 10.1016/S0022-3468(97)90173-1. [DOI] [PubMed] [Google Scholar]
- 2.Pape L, Olsson K, Petersen C, von Wasilewski R, Melter M. Prognostic value of computerized quantification of liver fibrosis in children with biliary atresia. Liver Transpl. 2009;15(8):876–882. doi: 10.1002/lt.21711. [DOI] [PubMed] [Google Scholar]
- 3.Santos JL, et al. The extent of biliary proliferation in liver biopsies from patients with biliary atresia at portoenterostomy is associated with the postoperative prognosis. J Pediatr Surg. 2009;44(4):695–701. doi: 10.1016/j.jpedsurg.2008.09.013. [DOI] [PubMed] [Google Scholar]
- 4.Weerasooriya VS, White FV, Shepherd RW. Hepatic fibrosis and survival in biliary atresia. J Pediatr. 2004;144(1):123–125. doi: 10.1016/j.jpeds.2003.09.042. [DOI] [PubMed] [Google Scholar]
- 5.Whitington PF. Fortune telling in biliary atresia: what is in the tea leaves? Liver Transpl. 2009;15(8):829–830. doi: 10.1002/lt.21740. [DOI] [PubMed] [Google Scholar]
- 6.Moyer K, et al. Staging of biliary atresia at diagnosis by molecular profiling of the liver. Genome Med. 2010;2(5):33. doi: 10.1186/gm154. [DOI] [PMC free article] [PubMed] [Google Scholar]
- 7.Bessho K, Bezerra JA. Biliary atresia: will blocking inflammation tame the disease? Annu Rev Med. 2011;62:171–185. doi: 10.1146/annurev-med-042909-093734. [DOI] [PMC free article] [PubMed] [Google Scholar]
- 8.Ahmed AF, et al. CD8+ T cells infiltrating into bile ducts in biliary atresia do not appear to function as cytotoxic T cells: a clinicopathological analysis. . J Pathol. 2001;193(3):383–389. doi: 10.1002/1096-9896(2000)9999:9999<::AID-PATH793>3.0.CO;2-O. [DOI] [PubMed] [Google Scholar]
- 9.Bezerra JA, et al. Genetic induction of proinflammatory immunity in children with biliary atresia. Lancet. 2002;360(9346):1563–1659. doi: 10.1016/S0140-6736(02)11603-5. [DOI] [PubMed] [Google Scholar]
- 10.Broome U, Nemeth A, Hultcrantz R, Scheynius A. Different expression of HLA-DR and ICAM-1 in livers from patients with biliary atresia and Byler’s disease. J Hepatol. 1997;26(4):857–862. doi: 10.1016/S0168-8278(97)80253-X. [DOI] [PubMed] [Google Scholar]
- 11.Davenport M, et al. Immunohistochemistry of the liver and biliary tree in extrahepatic biliary atresia. J Pediatr Surg. 2001;36(7):1017–1025. doi: 10.1053/jpsu.2001.24730. [DOI] [PubMed] [Google Scholar]
- 12.Dillon PW, Belchis D, Minnick K, Tracy T. Differential expression of the major histocompatibility antigens and ICAM-1 on bile duct epithelial cells in biliary atresia. Tohoku J Exp Med. 1997;181(1):33–40. doi: 10.1620/tjem.181.33. [DOI] [PubMed] [Google Scholar]
- 13.Mack CL, et al. Oligoclonal expansions of CD4+ and CD8+ T-cells in the target organ of patients with biliary atresia. Gastroenterology. 2007;133(1):278–287. doi: 10.1053/j.gastro.2007.04.032. [DOI] [PMC free article] [PubMed] [Google Scholar]
- 14.Mack CL, et al. Biliary atresia is associated with CD4+ Th1 cell-mediated portal tract inflammation. Pediatr Res. 2004;56(1):79–87. doi: 10.1203/01.PDR.0000130480.51066.FB. [DOI] [PMC free article] [PubMed] [Google Scholar]
- 15.Shivakumar P, Sabla GE, Whitington P, Chougnet CA, Bezerra JA. Neonatal NK cells target the mouse duct epithelium via Nkg2d and drive tissue-specific injury in experimental biliary atresia. J Clin Invest. 2009;119(8):2281–2290. doi: 10.1172/JCI38879. [DOI] [PMC free article] [PubMed] [Google Scholar]
- 16.Petersen C, Kuske M, Bruns E, Biermanns D, Wussow PV, Mildenberger H. Progress in developing animal models for biliary atresia. Eur J Pediatr Surg. 1998;8(3):137–141. doi: 10.1055/s-2008-1071140. [DOI] [PubMed] [Google Scholar]
- 17.Riepenhoff-Talty M, et al. Group A rotaviruses produce extrahepatic biliary obstruction in orally inoculated newborn mice. Pediatr Res. 1993;33(4 pt 1):394–399. doi: 10.1203/00006450-199304000-00016. [DOI] [PubMed] [Google Scholar]
- 18.Shivakumar P, et al. Obstruction of extrahepatic bile ducts by lymphocytes is regulated by IFN-gamma in experimental biliary atresia. J Clin Invest. 2004;114(3):322–329. doi: 10.1172/JCI21153. [DOI] [PMC free article] [PubMed] [Google Scholar]
- 19.Shivakumar P, et al. Effector role of neonatal hepatic CD8+ lymphocytes in epithelial injury and autoimmunity in experimental biliary atresia. Gastroenterology. 2007;133(1):268–277. doi: 10.1053/j.gastro.2007.04.031. [DOI] [PMC free article] [PubMed] [Google Scholar]
- 20.Mohanty SK, Shivakumar P, Sabla G, Bezerra JA. Loss of interleukin-12 modifies the pro-inflammatory response but does not prevent duct obstruction in experimental biliary atresia. BMC Gastroenterol. 2006;6:14. doi: 10.1186/1471-230X-6-14. [DOI] [PMC free article] [PubMed] [Google Scholar]
- 21.Gavrilescu LC, Butcher BA, Del Rio L, Taylor GA, Denkers EY. STAT1 is essential for antimicrobial effector function but dispensable for gamma interferon production during Toxoplasma gondii infection. Infect Immun. 2004;72(3):1257–1264. doi: 10.1128/IAI.72.3.1257-1264.2004. [DOI] [PMC free article] [PubMed] [Google Scholar]
- 22.Carvalho E, Liu C, Shivakumar P, Sabla G, Aronow B, Bezerra JA. Analysis of the Biliary Transcriptome in Experimental Biliary Atresia. Gastroenterology. 2005;129(2):713–717. doi: 10.1016/j.gastro.2005.05.052. [DOI] [PubMed] [Google Scholar]
- 23.Shivakumar P, Bezerra JA. Biliary atresia and Th1 function: linking lymphocytes and bile ducts: commentary on the article by Mack et al. on page 79. Pediatr Res. 2004;56(1):9–10. doi: 10.1203/01.PDR.0000129655.02381.F0. [DOI] [PubMed] [Google Scholar]
- 24.Mantovani A, Sica A, Locati M. Macrophage polarization comes of age. Immunity. 2005;23(4):344–346. doi: 10.1016/j.immuni.2005.10.001. [DOI] [PubMed] [Google Scholar]
- 25.Gordon S. Alternative activation of macrophages. Nat Rev Immunol. 2003;3(1):23–35. doi: 10.1038/nri978. [DOI] [PubMed] [Google Scholar]
- 26.Mantovani A, Sozzani S, Locati M, Allavena P, Sica A. Macrophage polarization: tumor-associated macrophages as a paradigm for polarized M2 mononuclear phagocytes. Trends Immunol. 2002;23(11):549–555. doi: 10.1016/S1471-4906(02)02302-5. [DOI] [PubMed] [Google Scholar]
- 27.Moritoki Y, et al. B cells promote hepatic inflammation, biliary cyst formation, and salivary gland inflammation in the NOD.c3c4 model of autoimmune cholangitis. Cell Immunol. 2011;268(1):16–23. doi: 10.1016/j.cellimm.2011.01.005. [DOI] [PMC free article] [PubMed] [Google Scholar]
- 28.Ribechini E, Greifenberg V, Sandwick S, Lutz MB. Subsets, expansion and activation of myeloid-derived suppressor cells. Med Microbiol Immunol. 2010;199(3):273–281. doi: 10.1007/s00430-010-0151-4. [DOI] [PubMed] [Google Scholar]
- 29.Yang GX, et al. CD8 T cells mediate direct biliary ductule damage in nonobese diabetic autoimmune biliary disease. J Immunol. 2011;186(2):1259–1267. doi: 10.4049/jimmunol.1001597. [DOI] [PMC free article] [PubMed] [Google Scholar]
- 30.Van Rooijen N, Sanders A. Liposome mediated depletion of macrophages: mechanism of action, preparation of liposomes and applications. J Immunol Methods. 1994;174(1–2):83–93. doi: 10.1016/0022-1759(94)90012-4. [DOI] [PubMed] [Google Scholar]
- 31.Reyes JL, Terrazas CA, Alonso-Trujillo J, van Rooijen N, Satoskar AR, Terrazas LI. Early removal of alternatively activated macrophages leads to Taenia crassiceps cysticercosis clearance in vivo. Int J Parasitol. 2010;40(6):731–742. doi: 10.1016/j.ijpara.2009.11.014. [DOI] [PubMed] [Google Scholar]
- 32.Kaplan MH, Schindler U, Smiley ST, Grusby MJ. Stat6 is required for mediating responses to IL-4 and for development of Th2 cells. Immunity. 1996;4(3):313–319. doi: 10.1016/S1074-7613(00)80439-2. [DOI] [PubMed] [Google Scholar]
- 33.Zhu J, Paul WE. CD4 T cells: fates, functions, and faults. Blood. 2008;112(5):1557–1569. doi: 10.1182/blood-2008-05-078154. [DOI] [PMC free article] [PubMed] [Google Scholar]
- 34.Schmitz J, et al. IL-33, an interleukin-1-like cytokine that signals via the IL-1 receptor-related protein ST2 and induces T helper type 2-associated cytokines. Immunity. 2005;23(5):479–490. doi: 10.1016/j.immuni.2005.09.015. [DOI] [PubMed] [Google Scholar]
- 35.Mack CL. The pathogenesis of biliary atresia: evidence for a virus-induced autoimmune disease. Semin Liver Dis. 2007;27(3):233–242. doi: 10.1055/s-2007-985068. [DOI] [PMC free article] [PubMed] [Google Scholar]
- 36.Sokol RJ, Shepherd RW, Superina R, Bezerra JA, Robuck P, Hoofnagle JH. Screening and outcomes in biliary atresia: summary of a National Institutes of Health workshop. Hepatology. 2007;46(2):566–581. doi: 10.1002/hep.21790. [DOI] [PMC free article] [PubMed] [Google Scholar]
- 37.Lichtman AH, Chin J, Schmidt JA, Abbas AK. Role of interleukin 1 in the activation of T lymphocytes. Proc Natl Acad Sci U S A. 1988;85(24):9699–9703. doi: 10.1073/pnas.85.24.9699. [DOI] [PMC free article] [PubMed] [Google Scholar]
- 38.Diehl S, Rincon M. The two faces of IL-6 on Th1/Th2 differentiation. Mol Immunol. 2002;39(9):531–536. doi: 10.1016/S0161-5890(02)00210-9. [DOI] [PubMed] [Google Scholar]
- 39.Shang XZ, et al. Eosinophil recruitment in type-2 hypersensitivity pulmonary granulomas: source and contribution of monocyte chemotactic protein-3 (CCL7). Am J Pathol. 2002;161(1):257–266. doi: 10.1016/S0002-9440(10)64177-6. [DOI] [PMC free article] [PubMed] [Google Scholar]
- 40.Lu BR, Brindley SM, Tucker RM, Lambert CL, Mack CL. alpha-enolase autoantibodies cross-reactive to viral proteins in a mouse model of biliary atresia. Gastroenterology. 2010;139(5):1753–1761. doi: 10.1053/j.gastro.2010.07.042. [DOI] [PMC free article] [PubMed] [Google Scholar]
- 41.Zornetzer GA, et al. Transcriptomic analysis reveals a mechanism for a prefibrotic phenotype in STAT1 knockout mice during severe acute respiratory syndrome coronavirus infection. J Virol. 2010;84(21):11297–11309. doi: 10.1128/JVI.01130-10. [DOI] [PMC free article] [PubMed] [Google Scholar]
- 42.Coutinho HM, et al. Th2 cytokines are associated with persistent hepatic fibrosis in human Schistosoma japonicum infection. J Infect Dis. 2007;195(2):288–295. doi: 10.1086/510313. [DOI] [PubMed] [Google Scholar]
- 43.Shao DD, Suresh R, Vakil V, Gomer RH, Pilling D. Pivotal Advance: Th-1 cytokines inhibit, and Th-2 cytokines promote fibrocyte differentiation. J Leuk Biol. 2008;83(6):1323–1333. doi: 10.1189/jlb.1107782. [DOI] [PMC free article] [PubMed] [Google Scholar]
- 44.Wills-Karp M, et al. Interleukin-13: central mediator of allergic asthma. Science. 1998;282(5397):2258–2261. doi: 10.1126/science.282.5397.2258. [DOI] [PubMed] [Google Scholar]
- 45.Wynn TA. IL-13 effector functions. Annu Rev Immunol. 2003;21:425–456. doi: 10.1146/annurev.immunol.21.120601.141142. [DOI] [PubMed] [Google Scholar]
- 46.Harris J, et al. T helper 2 cytokines inhibit autophagic control of intracellular Mycobacterium tuberculosis. Immunity. 2007;27(3):505–517. doi: 10.1016/j.immuni.2007.07.022. [DOI] [PubMed] [Google Scholar]
- 47.Hershey GK. IL–13 receptors and signaling pathways: an evolving web. J Allergy Clin Immunol. 2003;111(4):677–690. doi: 10.1067/mai.2003.1333. [DOI] [PubMed] [Google Scholar]
- 48.Chiaramonte MG, et al. Regulation and function of the interleukin 13 receptor alpha 2 during a T helper cell type 2-dominant immune response. . J Exp Med. 2003;197(6):687–701. doi: 10.1084/jem.20020903. [DOI] [PMC free article] [PubMed] [Google Scholar]
- 49.Kreider T, Anthony RM, Urban JF, Jr, Gause WC. Alternatively activated macrophages in helminth infections. Curr Opin Immunol. 2007;19(4):448–453. doi: 10.1016/j.coi.2007.07.002. [DOI] [PMC free article] [PubMed] [Google Scholar]
- 50.Van Ginderachter JA, et al. Classical and alternative activation of mononuclear phagocytes: picking the best of both worlds for tumor promotion. Immunobiology. 2006;211(6–8):487–501. doi: 10.1016/j.imbio.2006.06.002. [DOI] [PubMed] [Google Scholar]
- 51.McKenzie GJ, Bancroft A, Grencis RK, McKenzie AN. A distinct role for interleukin-13 in Th2-cell-mediated immune responses. Curr Biol. 1998;8(6):339–342. doi: 10.1016/s0960-9822(98)70134-4. [DOI] [PubMed] [Google Scholar]
- 52.Allen SR, et al. Effect of rotavirus strain on the murine model of biliary atresia. J Virol. 2007;81(4):1671–1679. doi: 10.1128/JVI.02094-06. [DOI] [PMC free article] [PubMed] [Google Scholar]
- 53.Maruyama T, et al. Control of the differentiation of regulatory T cells and T(H)17 cells by the DNA-binding inhibitor Id3. Nat Immunol. 2011;12(1):86–95. doi: 10.1038/ni.1965. [DOI] [PMC free article] [PubMed] [Google Scholar]
Associated Data
This section collects any data citations, data availability statements, or supplementary materials included in this article.


